

A Systems Approach to Interrogate Gene Expression Patterns in African American Men Presenting with Clinically Localized Prostate Cancer
- PMID: 34680291
- PMCID: PMC8533960
- DOI: 10.3390/cancers13205143
A Systems Approach to Interrogate Gene Expression Patterns in African American Men Presenting with Clinically Localized Prostate Cancer
Abstract
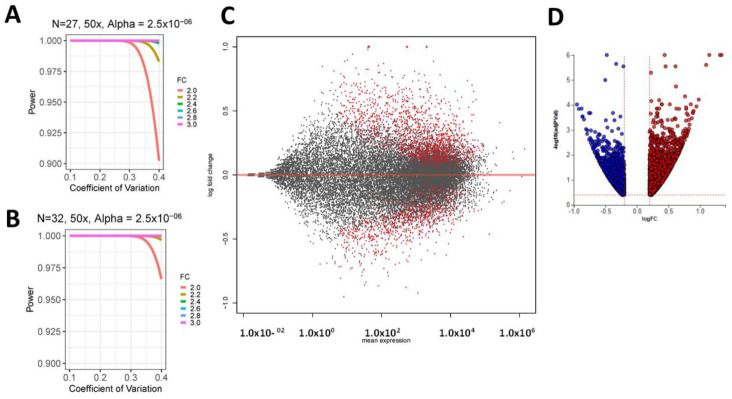
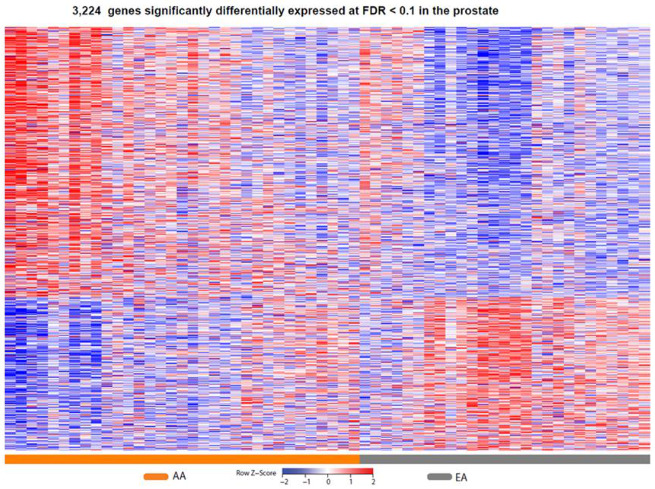
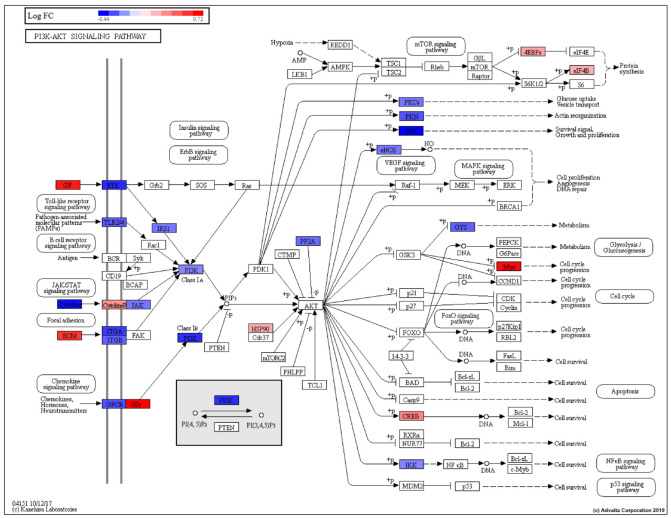
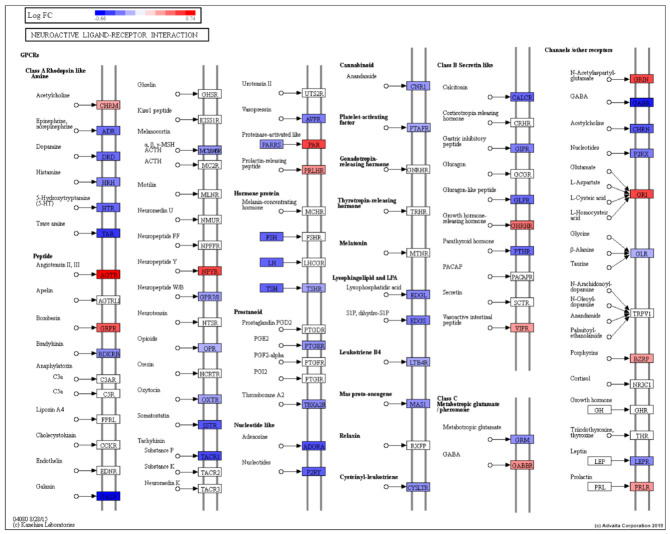
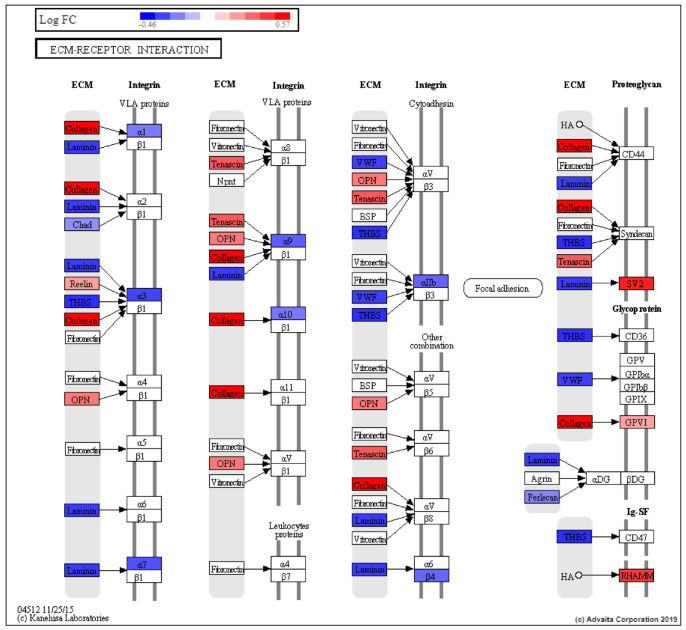
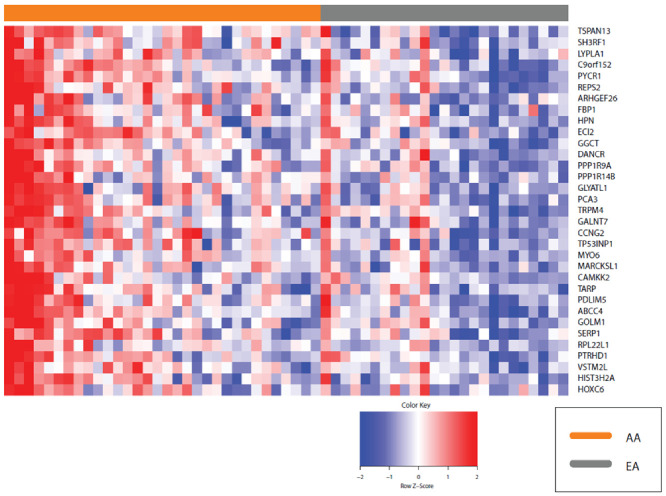
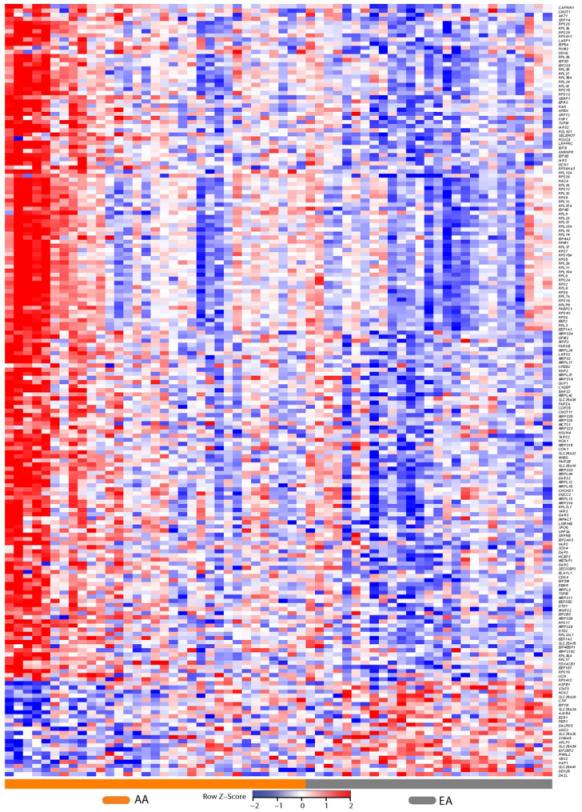
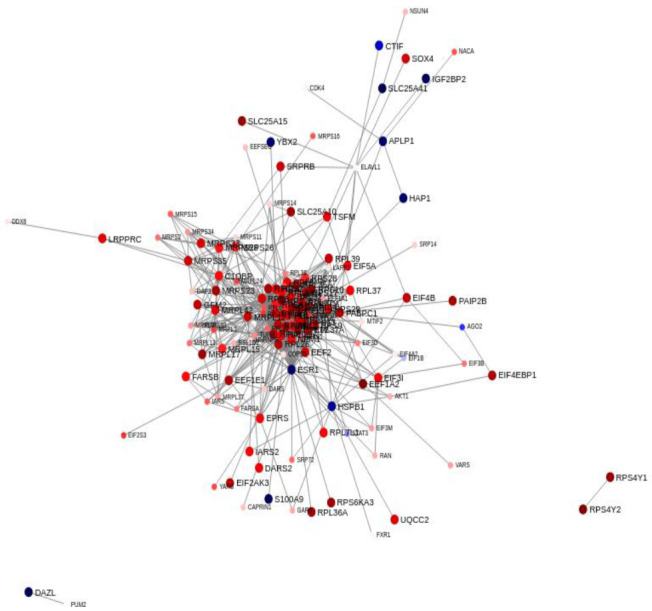
An emerging theory about racial differences in cancer risk and outcomes is that psychological and social stressors influence cellular stress responses; however, limited empirical data are available on racial differences in cellular stress responses among men who are at risk for adverse prostate cancer outcomes. In this study, we undertook a systems approach to examine molecular profiles and cellular stress responses in an important segment of African American (AA) and European American (EA) men: men undergoing prostate biopsy. We assessed the prostate transcriptome with a single biopsy core via high throughput RNA sequencing (RNA-Seq). Transcriptomic analyses uncovered impacted biological pathways including PI3K-Akt signaling pathway, Neuroactive ligand-receptor interaction pathway, and ECM-receptor interaction. Additionally, 187 genes mapping to the Gene Ontology (GO) terms RNA binding, structural constituent of ribosome, SRP-dependent co-translational protein targeting to membrane and the biological pathways, translation, L13a-mediated translational silencing of Ceruloplasmin expression were differentially expressed (DE) between EA and AA. This signature allowed separation of AA and EA patients, and AA patients with the most severe clinical characteristics. AA patients with elevated expression levels of this genomic signature presented with higher Gleason scores, a greater number of positive core biopsies, elevated dehydroepiandrosterone sulfate levels and serum vitamin D deficiency. Protein-protein interaction (PPI) network analysis revealed a high degree of connectivity between these 187 proteins.
Keywords: African American; RNA-Seq; health disparities; precision medicine; prostate; stress; transcriptomics; vitamin D.
Conflict of interest statement
The authors declare no conflict of interest. The funders had no role in the design of the study; in the collection, analyses, or interpretation of data; in the writing of the manuscript, or in the decision to publish the results.
Figures
Similar articles
-
Genomic, epigenomic, and transcriptomic signatures of prostate cancer between African American and European American patients.Front Oncol. 2023 Feb 28;13:1079037. doi: 10.3389/fonc.2023.1079037. eCollection 2023. Front Oncol. 2023. PMID: 36937425 Free PMC article. Review.
-
RNA-seq profile of African American men with a clinically localized prostate cancer.Prostate Int. 2021 Sep;9(3):125-131. doi: 10.1016/j.prnil.2020.11.002. Epub 2020 Nov 19. Prostate Int. 2021. PMID: 34692584 Free PMC article.
-
Serum Androgen Metabolites Correlate with Clinical Variables in African and European American Men with Localized, Therapy Naïve Prostate Cancer.Metabolites. 2023 Feb 16;13(2):284. doi: 10.3390/metabo13020284. Metabolites. 2023. PMID: 36837903 Free PMC article.
-
Molecular and pathological subtypes related to prostate cancer disparities and disease outcomes in African American and European American patients.Front Oncol. 2022 Aug 10;12:928357. doi: 10.3389/fonc.2022.928357. eCollection 2022. Front Oncol. 2022. PMID: 36033462 Free PMC article.
-
Vitamin D and Immune Response: Implications for Prostate Cancer in African Americans.Front Immunol. 2016 Feb 22;7:53. doi: 10.3389/fimmu.2016.00053. eCollection 2016. Front Immunol. 2016. PMID: 26941739 Free PMC article. Review.
Cited by
-
In Vivo Investigation of the Effect of Dietary Acrylamide and Evaluation of Its Clinical Relevance in Colon Cancer.Toxics. 2023 Oct 13;11(10):856. doi: 10.3390/toxics11100856. Toxics. 2023. PMID: 37888706 Free PMC article.
-
A Systems Biology Approach to Understand the Racial Disparities in Colorectal Cancer.Cancer Res Commun. 2024 Jan 12;4(1):103-117. doi: 10.1158/2767-9764.CRC-22-0464. Cancer Res Commun. 2024. PMID: 38051091 Free PMC article.
-
Genomic, epigenomic, and transcriptomic signatures of prostate cancer between African American and European American patients.Front Oncol. 2023 Feb 28;13:1079037. doi: 10.3389/fonc.2023.1079037. eCollection 2023. Front Oncol. 2023. PMID: 36937425 Free PMC article. Review.
-
Characterizing molecular subtypes of high-risk non-muscle-invasive bladder cancer in African American patients.Urol Oncol. 2022 Sep;40(9):410.e19-410.e27. doi: 10.1016/j.urolonc.2022.04.013. Epub 2022 May 23. Urol Oncol. 2022. PMID: 35618577 Free PMC article.
-
Review of prostate cancer genomic studies in Africa.Front Genet. 2022 Oct 11;13:911101. doi: 10.3389/fgene.2022.911101. eCollection 2022. Front Genet. 2022. PMID: 36303548 Free PMC article. Review.
References
-
- Dhabhar F.S., Miller A.H., McEwen B.S., Spencer R.L. Effects of stress on immune cell distribution. Dynamics and hormonal mechanisms. J. Immunol. 1995;154:5511–5527. - PubMed
-
- Dhabhar F.S., McEwen B.S. Stress-induced enhancement of antigen-specific cell-mediated immunity. J. Immunol. 1996;156:2608–2615. - PubMed
Grants and funding
LinkOut - more resources
Full Text Sources
Molecular Biology Databases
