. 2021 Nov;24(11):1542-1554.
doi: 10.1038/s41593-021-00923-4. Epub 2021 Oct 21.

Human ALS/FTD brain organoid slice cultures display distinct early astrocyte and targetable neuronal pathology

Affiliations

Human ALS/FTD brain organoid slice cultures display distinct early astrocyte and targetable neuronal pathology

Kornélia Szebényi et al. Nat Neurosci. 2021 Nov.

Abstract

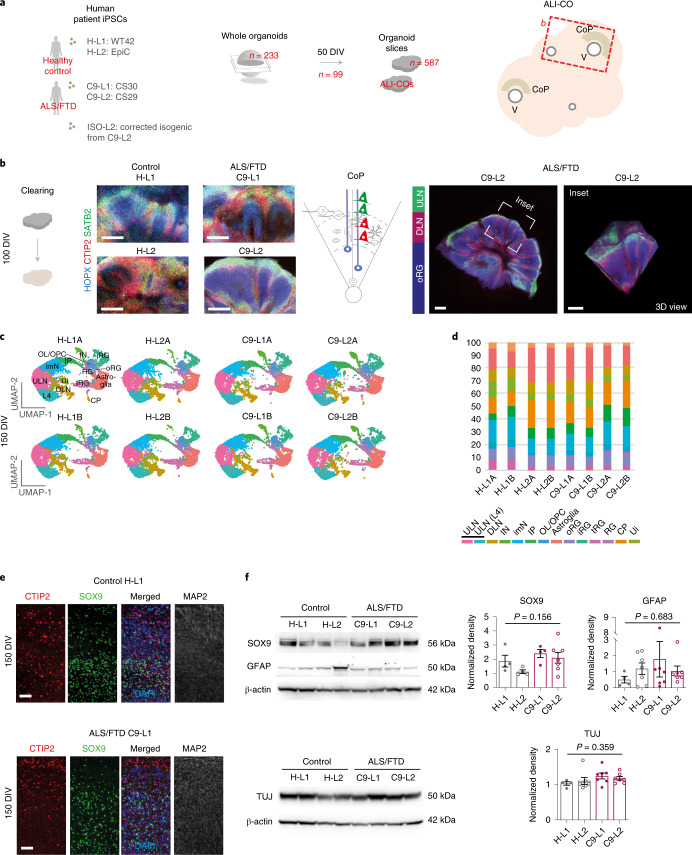
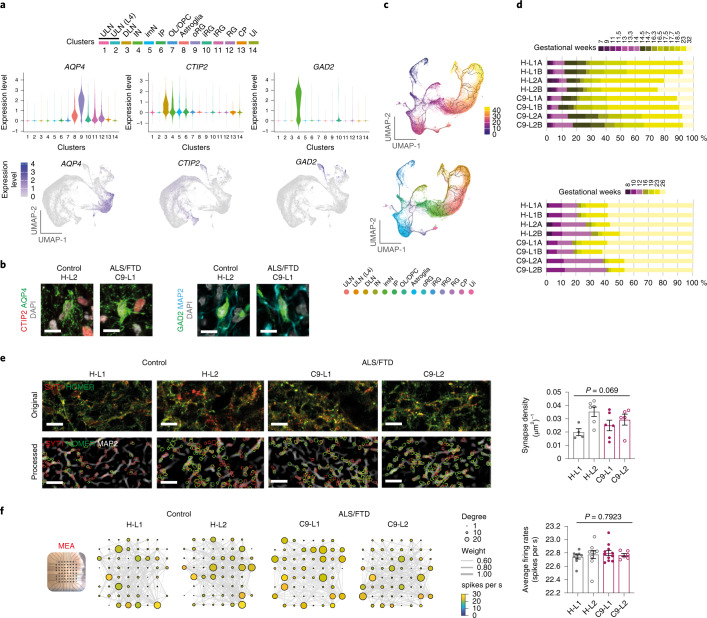
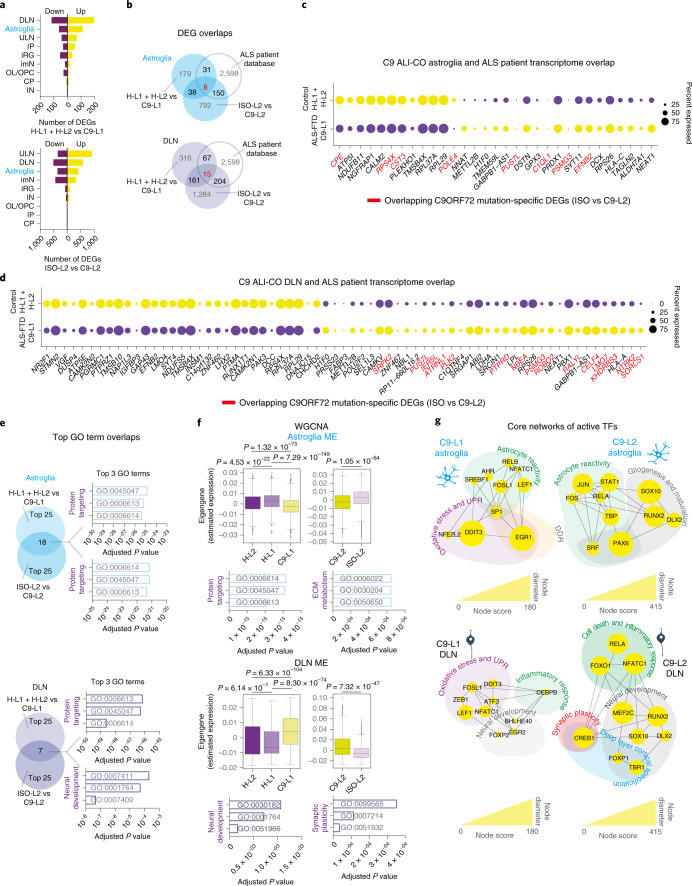
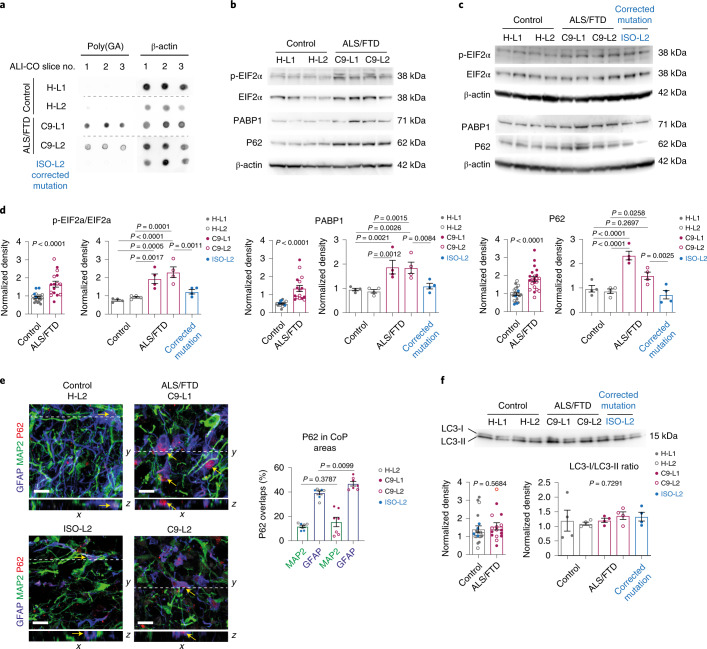
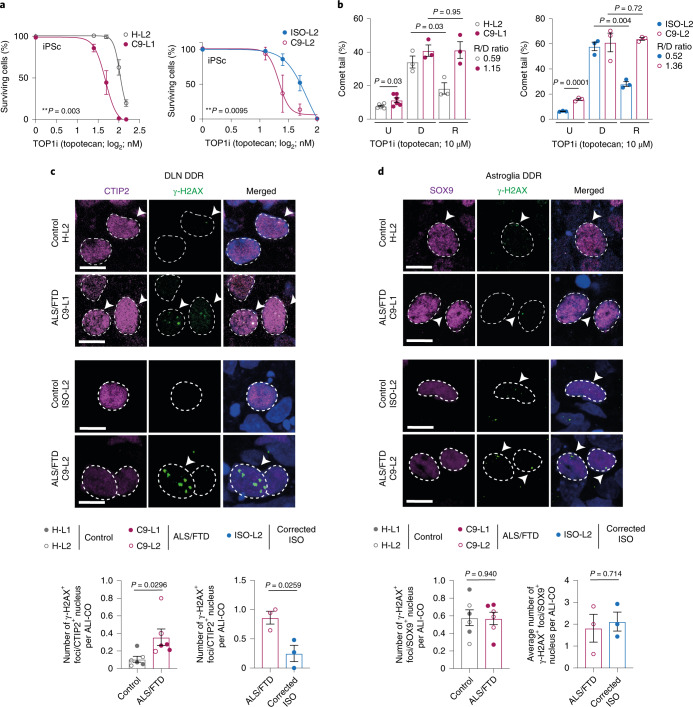
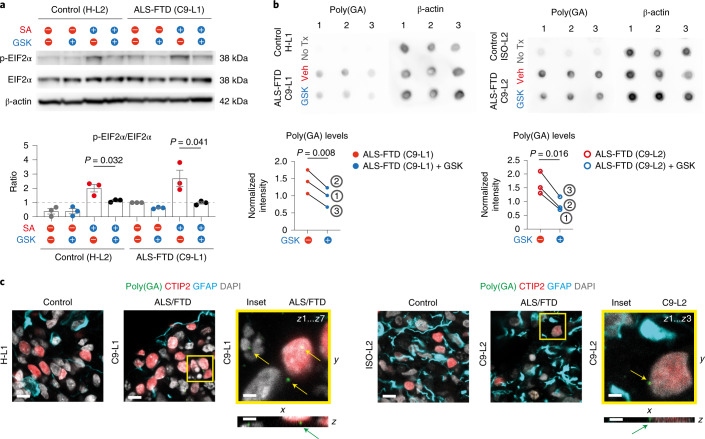
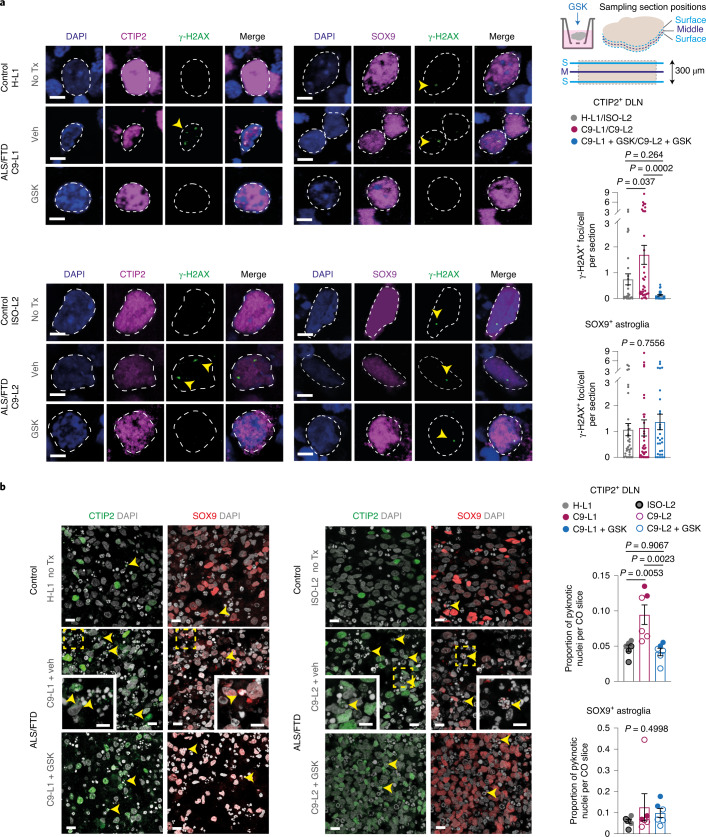
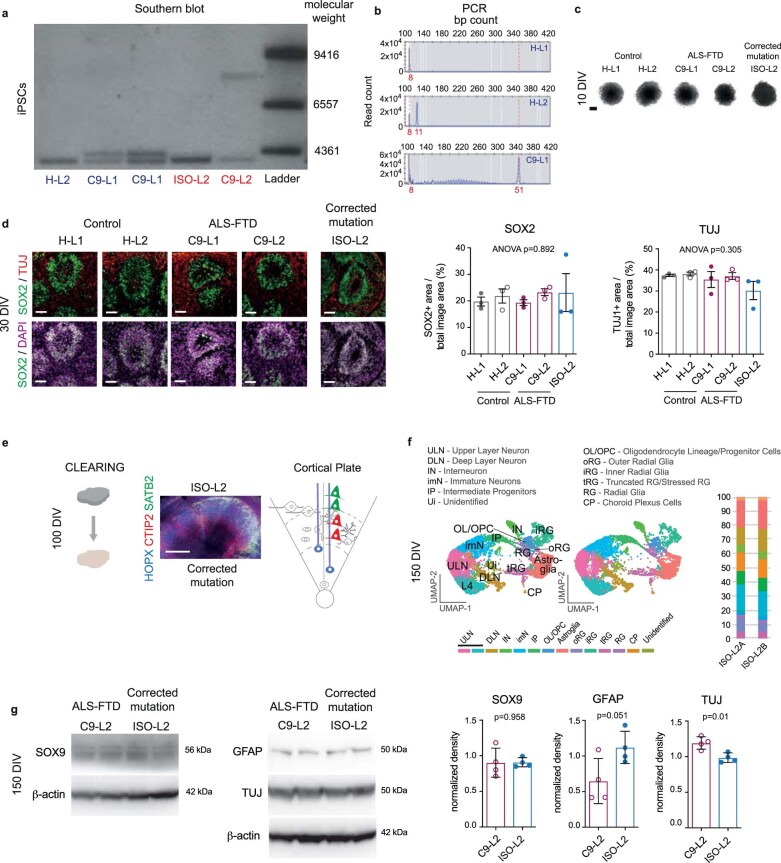
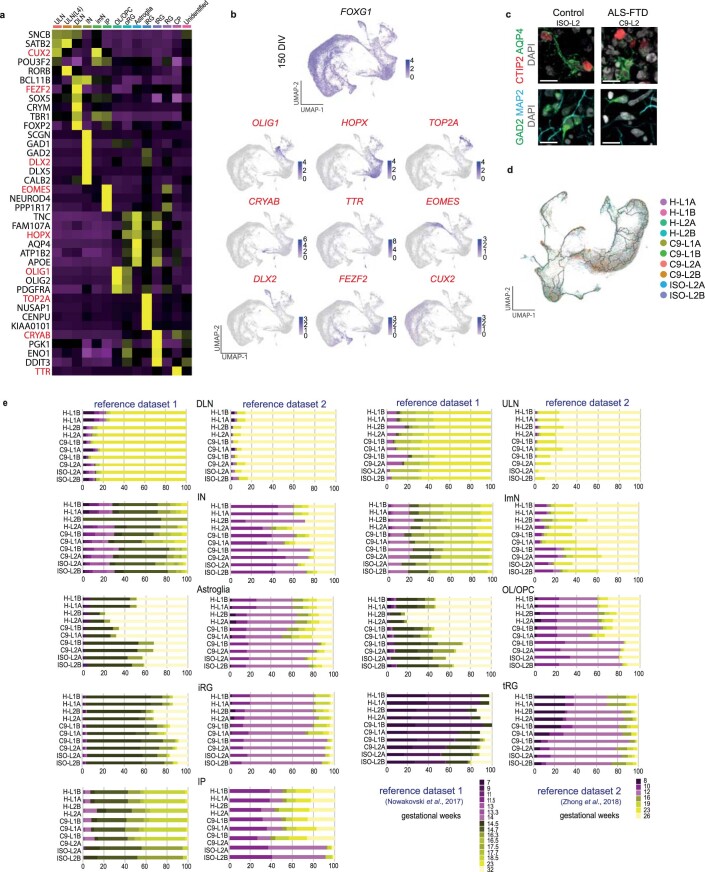
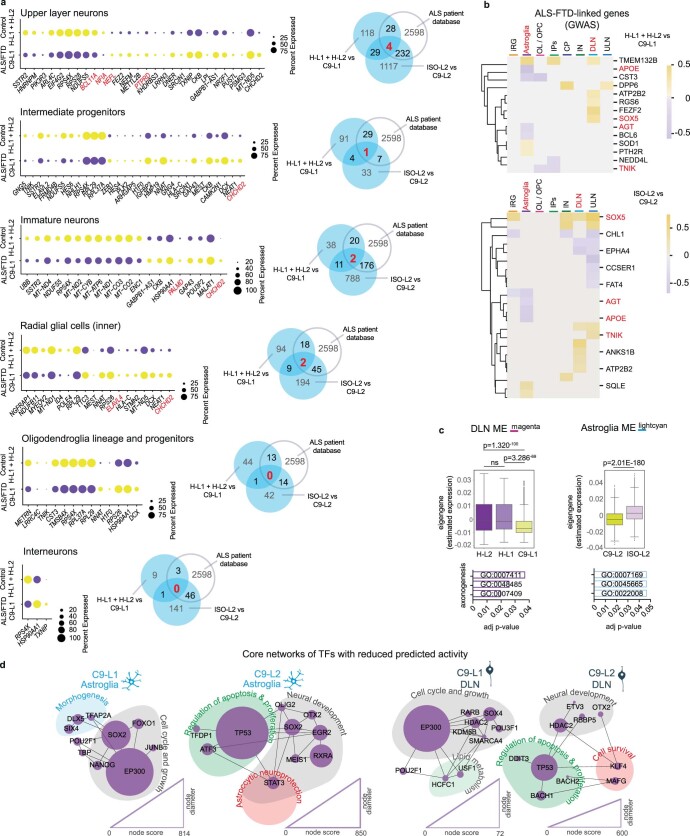
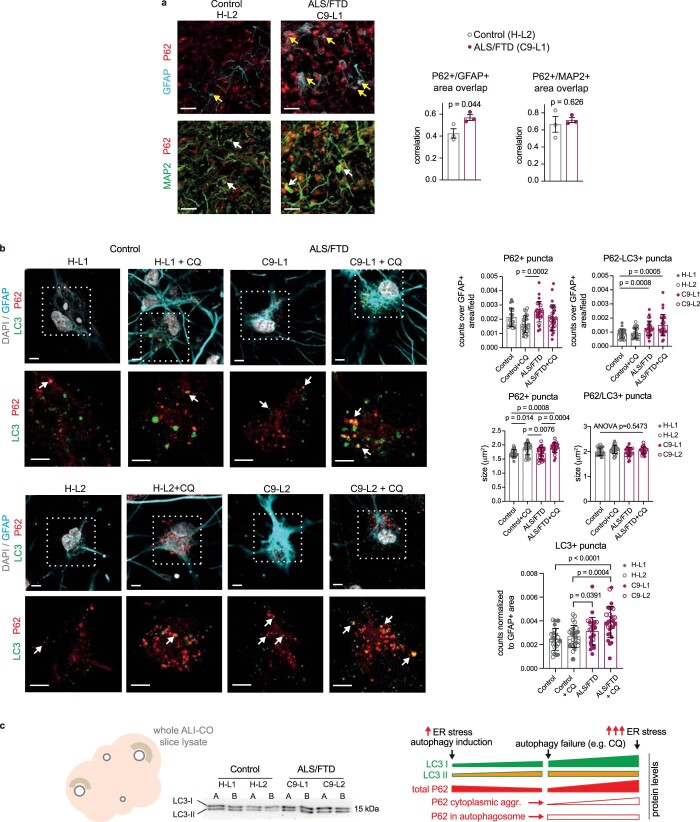
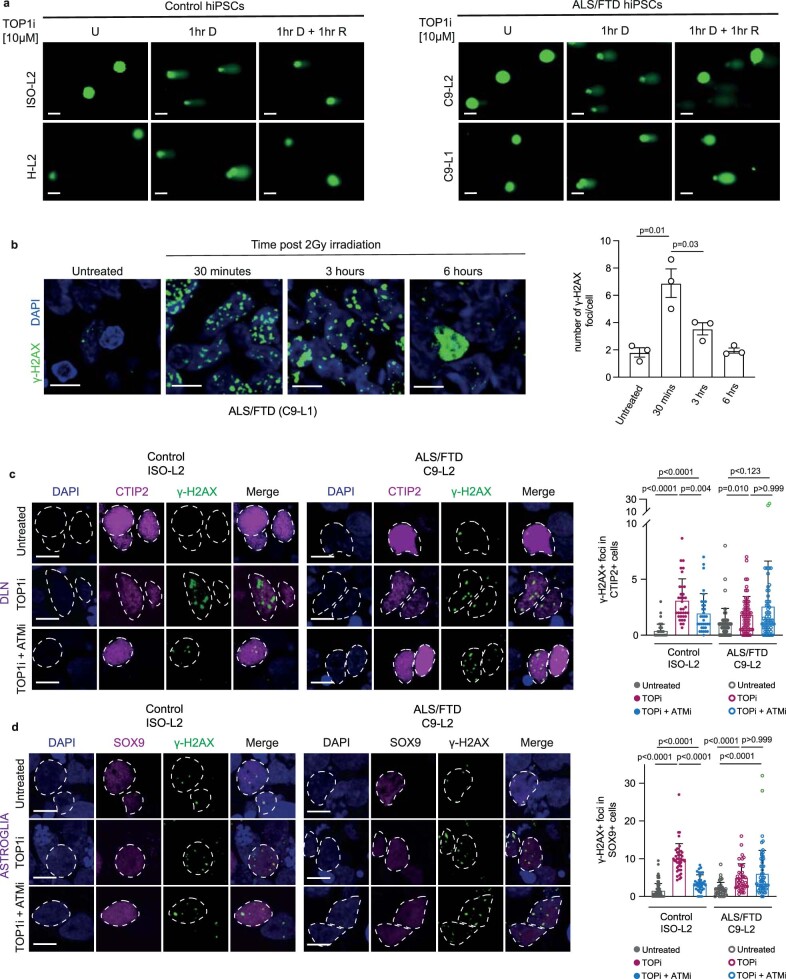
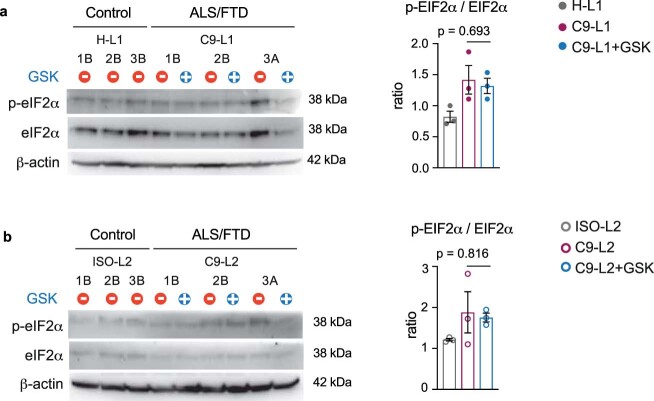
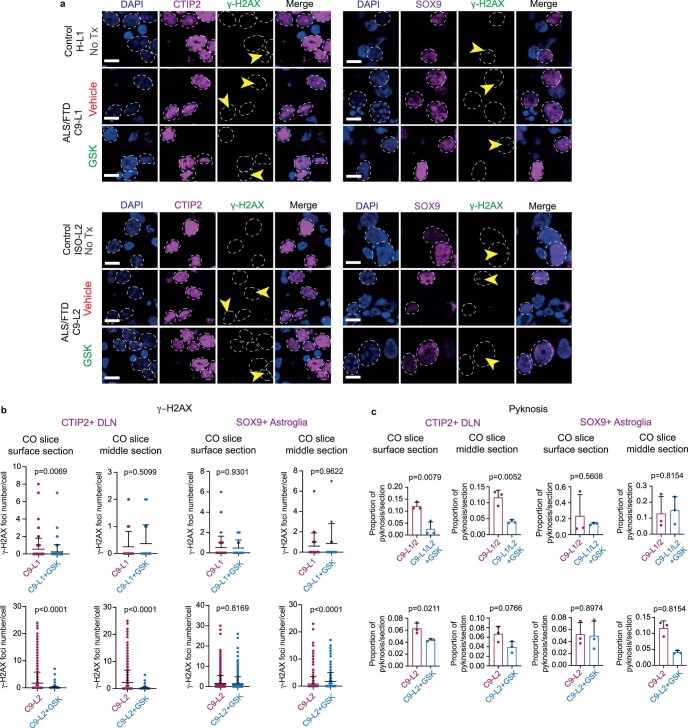
Amyotrophic lateral sclerosis overlapping with frontotemporal dementia (ALS/FTD) is a fatal and currently untreatable disease characterized by rapid cognitive decline and paralysis. Elucidating initial cellular pathologies is central to therapeutic target development, but obtaining samples from presymptomatic patients is not feasible. Here, we report the development of a cerebral organoid slice model derived from human induced pluripotent stem cells (iPSCs) that recapitulates mature cortical architecture and displays early molecular pathology of C9ORF72 ALS/FTD. Using a combination of single-cell RNA sequencing and biological assays, we reveal distinct transcriptional, proteostasis and DNA repair disturbances in astroglia and neurons. We show that astroglia display increased levels of the autophagy signaling protein P62 and that deep layer neurons accumulate dipeptide repeat protein poly(GA), DNA damage and undergo nuclear pyknosis that could be pharmacologically rescued by GSK2606414. Thus, patient-specific iPSC-derived cortical organoid slice cultures are a reproducible translational platform to investigate preclinical ALS/FTD mechanisms as well as novel therapeutic approaches.


Conflict of interest statement

G.B. is a co-founder of and consultant for Adrestia Therapeutics Ltd. The remaining authors declare no competing interests.

Figures

Fig. 1
Fig. 1. Cortical plate cytoarchitecture is recapitulated in C9 and control ALI-COs.
a, Schematic of cell line sources and generation of ALI-COs displaying ventricle-like (V) and cortical plate (CoP) formation. b, Projected 8-plane z-stack (left), single 2D plane (right) and 3D (inset) views of confocal immunofluorescence images of cleared ALI-COs (right) at 100 DIV, which demonstrate layers (schematic) of HOPX+ oRG (cyan), CTIP2+ DLNs (red) and SATB2+ ULNs (green). c, Uniform manifold approximation and projection (UMAP) plots represent 14 color-coded clusters identified in the scRNA-seq dataset (n = 75,497 cells) for all control and C9 ALI-COs at 150 DIV using cell-marker genes. ULN, upper layer cortical neuron; L4, layer 4 ULN; DLN, deep layer neuron; IN, interneurons; imN, immature neurons; IP, intermediate progenitors; OL/OPC, oligodendrocyte lineage/progenitor cells; RG, radial glia; oRG, outer RG; iRG, inner RG; tRG, truncated RG/stressed RG; CP, choroid plexus; Ui, unidentified. d, Bars represent color-coded cluster identity distributions expressed as cell proportions in each pooled ALI-CO pair sample. e, Representative images of immunostained ALI-COs at 150 DIV for 3 biological replicates per group displaying CTIP2+ DLN (red) and SOX9+ astroglia (green) with or without DAPI stain (blue) and MAP2+ (gray) neurons. f, Representative WB images (left) for SOX9, GFAP, TUJ and β-actin in samples of ALI-COs at 150 DIV and quantified (right) SOX9, GFAP and TUJ WB band density levels normalized to β-actin. Data indicate the mean ± s.e.m.; n = 4, 4, 4, 7 (SOX9) and 4, 7, 7, 7 (GFAP/TUJ) independent ALI-COs for H-L1, H-L2, C9-L1, C9-L2 organoid lines, respectively; one-way ANOVA with Tukey’s post hoc test (overall ANOVA P values are indicated in the graphs). Scale bars, 40 μm (e), 50 μm (b, left) and 500 μm (b, right). See Supplementary Table 3 for detailed statistics and source data for unprocessed WB images. Source data
Fig. 2
Fig. 2. Cortical-cell-type diversity and maturity are recapitulated in C9 and control ALI-COs.
a, Violin plots (upper) and UMAP plots (lower) illustrating AQP4 (astrocyte), CTIP2 (DLN) and GAD2 (IN) marker gene expression identified by scRNA-seq in 20 ALI-COs at 150 DIV. Cluster numbers (x axis) correspond to color-coded cell-type identities as indicated above the plots. b, Representative images demonstrating the immunoreactivity of cell-type marker proteins in ALI-COs (three biological repeats per group). c, Pseudotime analysis of scRNA-seq data with branches representing the color-coded trajectory of cell-subtype specification (upper) or cluster identities (lower). n = 75,497 cells for a and c. d, Projected transcriptomic data of four control and four C9 ALI-CO slice-pairs onto two fetal brain reference datasets, using scmap. Bars indicate the proportion of cells assigned to different fetal ages and expressed as human gestational weeks. e, Representative original confocal microscopy images (upper) illustrate pre- and post-synaptic proteins, synaptotagmin-1 (SYT1; red) and HOMER1 (HOMER; green) and their colocalization over MAP2+ dendrites (gray) in deconvoluted digital images (lower) in ALI-COs at 150 DIV and quantification (right). Data represent the mean ± s.e.m. synapse densities; n = 4, 6, 6, 5 independent ALI-CO slices for H-L1, H-L2, C9-L1, C9-L2 organoid lines, respectively; one-way ANOVA with Tukey’s post hoc test (overall ANOVA P value is indicated in the graph). f, Neuronal network analysis using MEAs (left) reveals rich spontaneous network activity in all ALI-COs. Highly connected nodes (circles) represent individual electrodes for the degree of connectivity (node size), the spike rates (node color) and the connection strength (line thickness). The graph (right) shows the firing rates (spike number per second) across all electrodes for each recording. Data are expressed as individual recordings and the mean ± s.e.m.; n = 9, 9, 11, 6 ALI-CO slices for H-L1, H-L2, C9-L1, C9-L2 organoid lines, respectively; one-way ANOVA with Tukey’s post hoc test (overall ANOVA P value is indicated in the graph). Scale bar, 10 μm (b,e). See Supplementary Table 3 for detailed statistics.
Fig. 3
Fig. 3. C9 ALI-COs at 150 DIV show similarities to ALS-related transcriptional profile, cell stress pathways and adaptive changes.
a, Number of DEGs per cell type in C9-L1 versus H-L1/H-L2 control ALI-COs (upper) and C9-L2 versus mutation-corrected isogenic ISO-L2 control (lower) ALI-COs (four slices per organoid line). b, Venn diagrams display the number of overlapping genes between C9-L1 and C9-L2 ALI-CO DEGs and ALS-related transcriptomic changes. c,d, Dot plots represent the overlap in transcriptomic changes between astroglia (c) or DLNs (d) in control or C9 ALI-COs and samples from patients with ALS. The dot size indicates the percent of cells expressing overlapping upregulated (yellow) and downregulated (purple) genes. Gene names in red indicate overlapping genes between C9-L1 ALI-CO and C9-L2 ALI-CO (mutation-specific) DEGs and ALS patient sample-related transcriptomic changes. e, Venn diagrams represent top astroglia- (upper) and DLN-related (lower) GO terms that overlap between C9-L1 ALI-CO and C9-L2 ALI-CO (mutation-specific) DEGs. f, Boxes, lines, whiskers display the quartile, median and minimum–maximum distribution (without the outliers) representing top differentially expressed module eigengenes (WGCNA) for astroglia and DLNs in two H-L2, 2 H-L1, 2 C9-L1, 2 C9-L2, 2 ISO-L2 independent ALI-CO slice-pairs (4 slices per line), respectively. Two-sided Mann–Whitney–Wilcoxon test with Bonferroni correction. Bar graphs show the corresponding top significantly enriched GO terms. g, Core interaction networks (STRING) of TFs with predicted activity (SCENIC) defined by the top 10 betweenness centrality score (Cytohubba in Cytoscape) for interacting TFs (nodes) and grouped into functional domains based on gene/protein function (https://www.uniprot.org). Node size illustrates centrality score. See Supplementary Table 3 for detailed statistics.
Fig. 4
Fig. 4. C9 ALI-COs show ALS/FTD-related pathological hallmarks at 150 DIV.
a, Dot blot shows anti-poly(GA) immunoreactivity in C9 ALI-COs (n = 3 independent ALI-COs per group). b,c, Representative WB images for the ER stress/UPR elements p-EIF2α/EIF2α, the stress granule marker PABP1, the autophagy marker P62, and β-actin in ALI-CO samples from experiments quantified in d. d, Quantification of WB band densities normalized to β-actin. Left graphs: data represent the mean ± s.e.m.; for p-EIF2α/EIF2α ratios and PABP1 n = 20 control (H-L1, H-L2, ISO-L2) and n = 16 C9 (C9-L1, C9-L2) and for P62 n = 23 control (H-L1, H-L2, ISO-L2), n = 22 C9 (C9-L1, C9-L2) ALI-COs, respectively; two-tailed unpaired t-test. Right graphs: data represent the mean ± s.e.m. from experiments comparing C9-L2 to its isogenic mutation-corrected ISO-L2 control and non-related ALI-COs; n = 4 independent ALI-COs per group; one-way ANOVA with Fisher’s LSD test. e, Representative confocal microscopy image stacks (left) and quantification (right) of ALI-COs with single plane xz orthogonal views, showing P62 immunolabeling in GFAP+ astroglia and MAP2+ neurons with DAPI+ nuclei and quantification of P62+ area overlaps with either GFAP+ or MAP+ territories. Data are expressed as the mean percentage ± s.e.m.; n = 7 independent ALI-COs per group; two-tailed unpaired t-test. f, WB image (upper) of ALI-COs, corresponding to samples in c, showing autophagy marker LC3 immunolabeling with bands representing LC3-I early, LC3-II late autophagosomes and β-actin. Lower left: data in the graph represent the mean ± s.e.m. of LC3-II/LC3-I ratios; n = 20 control (H-L1, H-L2, ISO-L2), n = 16 C9 (C9-L1, C9-L2) independent ALI-COs per group. Lower right: data in the graph represent the mean ± s.e.m. from experiments comparing C9-L2 to ISO-L2 control and non-related ALI-COs; n = 4 independent ALI-COs; one-way ANOVA with Fisher’s LSD test. Scale bar, 10 μm (e). See Supplementary Table 3 for detailed statistics and source data for unprocessed WB images. Source data
Fig. 5
Fig. 5. DNA damage accumulation in C9 hiPSCs and ALI-COs.
a, Control and C9 hiPSC survival curves in response to topotecan, a TOP1i, in cultures of healthy control H-L2/C9-L1 hiPSC pairs (left) and genetically corrected isogenic control ISO-L2/C9-L2 hiPSC pairs (right). Data represent the percent of surviving cells as the mean ± s.e.m.; n = 3 independent cultures for each line; extra sum of square F-test. b, Quantification of comet assays for corresponding control and C9 hiPSCs (as seen for a) in response to TOP1i treatment. Graph represents the percentage of comet tails for untreated hiPSCs (U) and 1 h after TOP1i-induced DNA damage (D) or 1 h after TOP1i removal (R). Data show the mean ± s.e.m.; n = 3 independent cultures per group (for untreated H-L2, C9-L1 cells, n = 6 independent cultures per group; >30 cells for each). Two-tailed unpaired t-test. c,d, Confocal microscopy immunofluorescence images (upper) displaying γ-H2AX+ foci (green) in the nuclei of CTIP2+ DLNs (c) and SOX9+ astroglial cells (d) in control and C9 ALI-COs at 150 DIV and quantification (lower). Dashed circles illustrate nuclei defined by DAPI staining (blue in the merged images); γ-H2AX+nuclei are labelled by arrowheads. Corresponding bar plot graphs represent γ-H2AX+ foci for DLNs (c) and astroglia (d). Data expressed as the mean ± s.e.m. foci per cell per ALI-CO slice; n = 6 (left graphs) and n = 3 independent ALI-COs (right graphs) in 3 experiments; two-tailed unpaired t-test. Scale bars, 10 μm (c,d). See Supplementary Table 3 for detailed statistics.
Fig. 6
Fig. 6. GSK reduces UPR activation and poly(GA) levels in C9 CO slices.
a, WB image of CO slice samples at 220 DIV after immersion in medium for 12 h of GSK treatment with or without SA for 2 h. WB bands represent p-EIF2α, EIF2α and β-actin protein levels (upper) with quantification of p-EIF2α/EIF2α band density ratios after normalization to β-actin and to untreated C9-L1 controls in each blot (lower). Data are expressed as the mean ± s.e.m.; n = 3 independent CO slices; two-tailed unpaired t-test. b, Upper: dot blots show anti-poly(GA) immunoreactivity in C9-L1 versus H-L1 CO slice samples at 240 DIV and C9-L2 versus ISO-L2 CO slice samples at 200 DIV with or without (No Tx) a 14-day-long GSK or vehicle (Veh) treatment. Lower: scatter plots represent individual values of normalized blot densities to β-actin; n = 3 control–treatment CO slice-pairs from 3 independent organoids; two-tailed paired t-test. c, Representative immunofluorescence confocal superimposed z-stack images showing CTIP2+ neuronal nuclei (red) with perinuclear poly(GA) foci (green; arrows) and GFAP+ astroglia (cyan) overlapped with DAPI staining for three biological repeats per group. Orthogonal views (xz) represent single confocal reconstructed planes. Scale bars, 10 μm for all images (2 μm for insets). See Supplementary Table 3 for detailed statistics and source data for unprocessed WB images. Source data
Fig. 7
Fig. 7. Neuronal vulnerability is distinct from astroglial stress and is partially rescuable in C9 CO slices.
a, Left: representative confocal microscopy images showing γ-H2AX+ foci (arrowheads) in CTIP+ DLNs and SOX9+ astroglial nuclei in C9-L1 (240 DIV) and in C9-L2 CO slices (200 DIV) immersed in medium and treated with GSK or vehicle in comparison to age-matched untreated H-L1 or ISO-L2 control CO slices, respectively. Right: schematic (upper) of the section sampling across the vertical axis of CO slices for quantification (lower). Data represent foci numbers per cell and expressed as the mean ± s.e.m. of section averages; for DLNs, n = 28, 36, 30 sections from 7 control, 8 C9 and 6 GSK-treated C9 independent CO slices, respectively (including 6 independent untreated–treated C9 CO slice-pairs); for astroglia n = 33, 36, 29 from 8 control, 8 C9 and 6 GSK treated C9 independent CO slices, respectively (including 6 independent untreated–treated C9 CO slice-pairs); one-way ANOVA and Tukey’s post hoc test (for astroglia, overall ANOVA P value is indicated in the graph). b, Immunofluorescence confocal stack images (left) displaying pyknosis (arrowheads) in CTIP2+ DLNs and SOX9+ astroglial nuclei in C9-L1 (240 DIV) and in C9-L2 CO slices (200 DIV) treated with GSK or vehicle in comparison to age-matched untreated H-L1 or ISO-L2 control CO slices, respectively, and quantification (right). Data represent the proportion of pyknotic nuclei with residual CTIP2 or SOX9 immunoreactivity and expressed as the mean ± s.e.m.; n = 6 for independent control slices, and 6 independent untreated and GSK-treated C9 CO slice-pairs; one-way ANOVA and Tukey’s post hoc test (for astroglia, overall P value is indicated in the graph). Scale bars, 5 μm (a,b (inset)) or 10 μm (b). See Supplementary Table 3 for detailed statistics.
Extended Data Fig. 1
Extended Data Fig. 1. Human iPSC genotyping and consistent early organoid formation.
a, Southern blot demonstrates C9ORF72 hexanucleotide repeats in C9-L2 iPSCs and its absence in the isogenic mutation-corrected control line, ISO-L2. Shorter repeat length is shown for C9-L1 iPSCs versus the C9-L2 lines. b, PCR-based fragment analysis of iPSC lines with shorter repeat length. c, Expanded neuroepithelia show similar bud-formation between COs at 10 DIV. d, Representative immunofluorescence images of COs demonstrating palisade-like organization of SOX2+ progenitor cells (green) surrounded by immature TUJ+ neurons (red) in COs at 30 DIV and quantification of SOX2 and TUJ immunoreactivity. Data expressed as mean ± s.e.m.; n = 3 independent COs per group; One-way ANOVA with Tukey’s post-hoc test (overall p-values are indicated in graphs). e, Projected 8-plane z-stack views of confocal immunofluorescence images of cleared ISO-L2 ALI-CO at 100 DIV, demonstrating layers (schematic) of HOPX+ outer radial glia (cyan), CTIP2+ DLNs (red) and SATB2+ upper layer neurons (green). f, UMAP plots represent 14 color-coded clusters identified in the scRNA-seq dataset (n = 75,497 cells from 4 ISO-L2 ALI-COs at 150 DIV), using cell-marker genes15. Bars represent color-coded cluster identity distributions expressed as cell proportions in each pooled ALI-CO-pair sample. ULN: upper layer cortical layer neurons; L4: layer 4 ULN; DLN: deep layer cortical layer neurons; IN: interneurons; imN: immature neurons; IP: intermediate progenitors; Astroglia: mature and developing astrocytes; OL/OPC: oligodendrocyte lineage/oligodendrocyte progenitor cells; oRG: outer RG; iRG: inner radial glia; tRG/stress: ‘truncated’ radial glia or stressed RG; RG: radial glia; CP: choroid plexus. g, Representative western blots for SOX9, GFAP, TUJ and β-actin in samples of ALI-COs at 150 DIV and quantification of SOX9, GFAP and TUJ band density levels normalized to β-actin. Data indicate mean ± s.e.m.; n = 4 independent C9-L2 and ISO-L2 ALI-COs; Two-tailed unpaired t-test. Scale bar=300 μm for c, 50 μm for d, 500 μm for e. See Supplementary Table 3 for detailed statistics and Source Data for unprocessed WB images. Source data
Extended Data Fig. 2
Extended Data Fig. 2. Cortical cell-subtype transcriptional maturity profiles are recapitulated in control and C9 ALI-COs at 150 DIV.
a, Average gene expression of marker genes for various subpopulations identified in 14 unbiased clusters by scRNA-seq within the merged dataset of control and C9 ALI-COs (n = 75,497 cells). ULN: upper layer cortical neurons; ULN(L4): layer 4 neurons; DLN: deep layer cortical neurons; IN: interneurons; imN: immature neurons; IP: intermediate progenitors; Astroglia: mature and developing astrocytes; OL/OPC: oligodendrocyte lineage/oligodendrocyte progenitor cells; oRG: outer RG; iRG: inner radial glia; tRG/stress: ‘truncated’ radial glia or stressed RG; RG: radial glia; CP: choroid plexus. b, UMAP representations of scaled expression levels and distribution of key marker genes (in red) of major cell-types. c, Representative immunofluorescence images of CTIP2+ DLNs, GAD2+ INs and AQP4+ astroglia for 3 biological repeats. d, UMAP representation of inferred developmental trajectories in control and C9 ALI-COs, obtained by using Monocle3. e, Bar plots indicate proportion of cells mapping to transcriptional profiles of various fetal ages16,17 in scMAP18. Scale bar=10 μm for c.
Extended Data Fig. 3
Extended Data Fig. 3. C9 ALS/FTD ALI-COs and patient samples show transcriptomic overlaps.
a, Dot plots represent the overlap of transcriptomic changes per cell-type between C9 ALI-COs at 150 DIV and human ALS patient-related samples20–25. Dot size indicates the percentage of cells expressing upregulated (yellow) and downregulated (purple) genes. Venn diagrams display the number of overlapping genes between C9-L1 and/or mutation-specific C9-L2 ALI-CO DEGs (in red) and ALS-related transcriptomic changes b, Heatmap shows log-fold expression changes per cell-type for significant C9-L1 (upper panel) or mutation-specific C9-L2 (lower panel) DEGs overlapping with each other (in red) or with ALS/FTD-related genes taken from the ALSoD GWAS database (https://alsod.ac.uk). c, Boxes, lines, whiskers display the quartile, median, min-max distribution (without the outliers) representing highly correlated genes defined by top differentially expressed module eigengenes (WGCNA) for astroglia and deep layer neurons (DLN) for 2 independent ALI-CO slice-pairs per group (4 ALI-CO slices per line). Two-sided Mann-Whitney-Wilcoxon test with Bonferroni correction. Bar graphs show corresponding top significantly enriched GO terms. d, Core interaction networks (STRING) of transcription factors (TFs) with predicted reduced activity (SCENIC), defined by the top 10 betweenness centrality score (Cytohubba/Cytoscape) for interacting TFs (nodes) and grouped into functional domains based on protein function (www.uniprot.org). Node size illustrates centrality score. See Supplementary Table 3 for detailed statistics.
Extended Data Fig. 4
Extended Data Fig. 4. Autophagy is activated in C9 ALI-COs and astroglia.
a, Representative whole-section confocal microscopy slide-scanner images of control and C9 ALI-COs at 150 DIV, displaying autophagy marker P62+ (red), astroglial marker GFAP (green) and mature neuronal marker MAP2 (cyan) labeling. Quantification of p62+ area overlaps with either GFAP+ or MAP+ territories, expressed as mean ± s.e.m for correlation coefficients (CellProfiler); n = 3 independent ALI-COs per group; Two-tailed unpaired t-test. b, Representative confocal microscopy images of dissociated control/C9 ALI-CO cell cultures (±chloroquine [CQ] treatment) immunlabeled for P62/LC3 autophagy markers. Quantification of P62+ and LC3+ punctae in GFAP+ astroglia. Data expressed as mean ± s.d.; n = 25, 26, 28, 29 fields (4 cultures from 6 independent ALI-COs per group); Two-way ANOVA with Tukey’s posthoc test. c, Western blot (WB) of whole ALI-CO slice samples, showing autophagy marker LC3-immunolabelling with bands representing LC3-I early and LC3-II late autophagosomes. Schematic (right side) illustrates typical P62, LC3 level changes in authophagy activation vs failure. Scale bar=80 μm for a, 5 μm for b. See Supplementary Table 3 for detailed statistics and Source Data for unprocessed WB images. Source data
Extended Data Fig. 5
Extended Data Fig. 5. C9 ALI-CO neurons show increased genomic instability.
a, Representative images of alkaline comet assay, showing SYBR green stained nuclei of untreated (U) control and C9 hiPSCs or 1 hour (hr) after TOP1i-induced DNA damage (D; Damage) or 1 hr after TOP1i removal (R; Recovery) from 3 independent experiments. b, Confocal microscopy immunofluorescence images displaying DNA damage marker γ-H2AX + foci (green) accumulation in C9 ALI-COs at 150 DIV following 2 Gy gamma irradiation (IR) and quantification. Data expressed as mean ± s.d.; n = 3 ALI-CO sections (> 120 cells for each); Two-tailed unpaired t-test. c and d, Representative confocal immunofluorescence images of γ-H2AX+ foci in CTIP2+ DLN (c) and SOX9+ astroglial nuclei (d) in C9-L2 vs ISO-L2 ALI-COs treated with TOP1i alone ± ATM kinase inhibitor, AZD0156 (ATMi). Quantification of γ-H2AX+ foci. Data expressed as individual foci/cell, mean ± s.d.; n = 95-152 DLNs (c) and n = 99-193 astroglia (d) from 3 independent ALI-COs per group. Kruskal-Wallis test with Dunn’s multiple comparisons test. Scale bar=5 µm for all images. See Supplementary Table 3 for detailed statistics.
Extended Data Fig. 6
Extended Data Fig. 6. Long-term GSK treatment of fully immersed CO slices in media no longer prevents EIF2α phosphorylation.
a and b, Western blots (WB) displaying p-EIF2α, EIF2α, β-actin levels in samples of H-L1 control and C9-L1 CO slices at 240 DIV (a) and ISO-L2 and C9-L2 CO slices at 200 DIV (b) immersed in media with or without 14-day treatment with GSK. Quantification of p-eIF2α and eIF2α protein levels as indication of UPR activation for H-L1/C9-L1 CO slice samples (a) and for the ISO-L2/C9-L2 CO slice samples (b). Data represent mean ± s.e.m. for ratios of band densities; n = 3 independent control CO slices and independent untreated/treated C9 CO slice pairs; Two-tailed unpaired t-test for the GSK effect. See Supplementary Table 3 for detailed statistics and Source Data for unprocessed WB images. Source data
Extended Data Fig. 7
Extended Data Fig. 7. The rescue of neuronal vulnerability by GSK is more effective overall in the surface of C9 CO slices.
a, Representative low magnification immunofluorescence images of γ-H2AX+ foci in CTIP2+ deep layer neuronal (DLN) and SOX9+ astroglial nuclei in C9 CO slices immersed in media and treated with GSK or vehicle in comparison to untreated controls for experiments quantified in b (8 independent untreated and 6 treated COs). Arrowheads illustrate nuclei (dashed circles defined by DAPI staining) with γ-H2AX+ foci (green). b, For C9-L1 CO slices (240DIV), graphs represent foci/cell ± s.d.; n = 105, 110 and 32, 32 CTIP2+ DLNs and 57, 23 and 25, 14 SOX9+ astroglia in surface and middle sections for C9 and GSK-treated C9 independent CO slice-pairs, respectively. For C9-L2 COs (200DIV), graphs represent foci/cell ± s.d.; n = 640, 534 and 404, 286 CTIP2+ DLNs and 631, 558 and 411, 274 SOX9+ astroglia in surface and middle sections for untreated and GSK-treated independent C9 CO slice-pairs, respectively; Two-sided Mann Whitney test for the GSK effect. c, Quantification of pyknosis in CTIP2+ DLN and SOX9+ astroglial nuclei in C9 CO slices treated with GSK or vehicle and in untreated controls. Data represent the proportion of pyknotic nuclei with residual CTIP2- or SOX9-immunoreactvity and expressed as mean ± s.d. for surface or middle sections; n = 3 (2 C9-L1/1 C9-L2) untreated and 3 GSK-treated independent C9 CO slice-pairs at 240 DIV (upper panel) or 3 C9-L2 untreated and 3 GSK-treated independent CO slice-pairs at 200DIV (lower panel) per group; Two-tailed unpaired t-test for the GSK effect. Scale bars=10 μm. See Supplementary Table 3 for detailed statistics.

Similar articles

Cited by

References

    1. Lancaster MA, Knoblich JA. Organogenesis in a dish: modeling development and disease using organoid technologies. Science. 2014;345:1247125. doi: 10.1126/science.1247125. - DOI - PubMed
    1. Quadrato G, et al. Cell diversity and network dynamics in photosensitive human brain organoids. Nature. 2017;545:48–53. doi: 10.1038/nature22047. - DOI - PMC - PubMed
    1. Lancaster MA, et al. Cerebral organoids model human brain development and microcephaly. Nature. 2013;501:373–379. doi: 10.1038/nature12517. - DOI - PMC - PubMed
    1. Eisen A, Kiernan M, Mitsumoto H, Swash M. Amyotrophic lateral sclerosis: a long preclinical period? J. Neurol. Neurosurg. Psychiatry. 2014;85:1232–1238. doi: 10.1136/jnnp-2013-307135. - DOI - PubMed
    1. Giandomenico SL, et al. Cerebral organoids at the air–liquid interface generate diverse nerve tracts with functional output. Nat. Neurosci. 2019;22:669–679. doi: 10.1038/s41593-019-0350-2. - DOI - PMC - PubMed

Publication types

MeSH terms