. 2021 Nov;599(7886):628-634.
doi: 10.1038/s41586-021-04103-z. Epub 2021 Oct 18.

Exome sequencing and analysis of 454,787 UK Biobank participants

Affiliations

Exome sequencing and analysis of 454,787 UK Biobank participants

Joshua D Backman et al. Nature. 2021 Nov.

Abstract

A major goal in human genetics is to use natural variation to understand the phenotypic consequences of altering each protein-coding gene in the genome. Here we used exome sequencing1 to explore protein-altering variants and their consequences in 454,787 participants in the UK Biobank study2. We identified 12 million coding variants, including around 1 million loss-of-function and around 1.8 million deleterious missense variants. When these were tested for association with 3,994 health-related traits, we found 564 genes with trait associations at P ≤ 2.18 × 10⁻¹¹. Rare variant associations were enriched in loci from genome-wide association studies (GWAS), but most (91%) were independent of common variant signals. We discovered several risk-increasing associations with traits related to liver disease, eye disease and cancer, among others, as well as risk-lowering associations for hypertension (SLC9A3R2), diabetes (MAP3K15, FAM234A) and asthma (SLC27A3). Six genes were associated with brain imaging phenotypes, including two involved in neural development (GBE1, PLD1). Of the signals available and powered for replication in an independent cohort, 81% were confirmed; furthermore, association signals were generally consistent across individuals of European, Asian and African ancestry. We illustrate the ability of exome sequencing to identify gene-trait associations, elucidate gene function and pinpoint effector genes that underlie GWAS signals at scale.


Conflict of interest statement

J.D.B., A.H.L., A.M., D.S., J. Mbatchou, C.E.G., D.L., A.E.L., S.B., A.Y., N.B., M.D.K., A.D., S.L., C.B., X.B., A.H., E.M., L.G., K.W., J.A.K., V.R., J. Mighty, M.J., L.M., G.C., E.J., L.H., W.J.S., A.R.S., L.A.L., J.D.O., M.N.C., J.G.R., G.Y., H.M.K., J. Marchini, A.B., G.R.A. and M.A.R.F. are current employees and/or stockholders of Regeneron Genetics Center or Regeneron Pharmaceuticals.

Figures
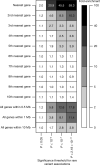
Fig. 1
Fig. 1. Enrichment of rare variant associations among genes located in GWAS loci.
We tested whether genes located in GWAS loci were more likely to have significant associations with a burden of rare variants when compared to genes elsewhere in the genome. We considered four different significance thresholds to define significant burden associations (P ≤ 0.05, P ≤ 10−4, P ≤ 10−7 and P ≤ 2.18 × 10−11) and considered 13 different gene-sets, from all genes located within 10 Mb of, to only the nearest gene to, the GWAS sentinel variants. The enrichment of significant associations was greatest when considering the nearest gene to GWAS sentinel variants, reaching 59.3-fold (95% CI 51.8 to 68.2, P< 10−300) when considering a significance threshold of P ≤ 2.18 × 10−11. Results are based on the analysis of a pruned set of 188 traits (101 binary traits and 87 quantitative traits; see Methods for details).
Fig. 2
Fig. 2. Imputation of rare variants from exome sequencing.
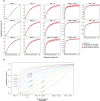
Imputation accuracy (r2, y axis) is shown as a function of the variant allele frequency (x axis; minor allele count (MAC) for ultra-rare variants; MAF for variants with MAF > 10−4) and the number of individuals (n) included in the reference panel (different lines). Full results are provided in Supplementary Table 23.
Extended Data Fig. 1
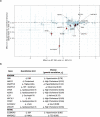
Extended Data Fig. 1. Lead trait associations for 564 genes with a rare variant association at P ≤ 2.18 × 10⁻¹¹.
a, Associations with binary traits. b, Associations with quantitative traits. In red (and table): associations with odds ratio >100 for binary traits and |effect| > 2 for quantitative traits. Diamonds show associations that were no longer significant after accounting for nearby GWAS signals.
Extended Data Fig. 2
Extended Data Fig. 2. Power to identify associations with rare variants in the analysis of 430,998 participants of European ancestry from the UK Biobank.
a, Protective associations (i.e. with an odds ratio <1). b, Predisposing associations (i.e. with an odds ratio >1). Power was estimated using asymptotic theory (broken lines) and also through simulations (solid lines), separately for variants with an effect allele frequency (EAF) of 1% (purple), 0.1% (blue), 0.01% (green) and 0.001% (yellow). Power to identify protective associations was low because identification of rare variants that reduce disease risk typically requires very large numbers of cases, and population cohorts like that ascertained by the UK Biobank study typically include many more unaffected than affected individuals for each disease.
Extended Data Fig. 3
Extended Data Fig. 3. Genes for which a rare variant had a favourable effect on a quantitative trait (P ≤ 2.18 × 10⁻¹¹) and also a protective association with a genetically correlated disease.
a, The x- and y-axes show the effect of the rare variant (listed in Supplementary Table 12) on the quantitative trait and genetically correlated disease, respectively. b, Thirteen genes for which the disease association was significant after correcting for multiple testing (P≤0.05/129 = 3.8x10⁻⁴; also shown in red in panel a).
Extended Data Fig. 4
Extended Data Fig. 4. Associations with common and rare variants in individuals of European ancestry.
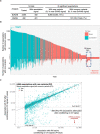
a, Number of traits tested and genetic associations discovered in UKB 450K. An exome-wide association study (ExWAS) was performed for 3,994 traits, of which 492 had at least 1 gene with a rare variant (RV) association at P ≤ 2.18 × 10−11. Across all 492 traits, we identified 8,865 significant RV associations, a list that includes redundant associations arising from having tested multiple (often correlated) variants and traits per gene. The 8,865 associations (including 6,564 or 74% located within 1 Mb of a GWAS signal) reduced down to (i) 2,283 associations when selecting only the most significant association per gene per trait (Supplementary Data 2); and (ii) 564 associations when selecting only the most significant association per gene (Supplementary Table 6). For each of the 492 traits with at least 1 RV association, we performed a genome-wide association study (GWAS) using TOPMed data for the same individuals included in the ExWAS. Of the 492 traits, 421 had at least 1 common variant (CV) signal at P < 5 × 10−8. Independent CV associations were identified for each trait using approximate conditional analysis, and then the number of independent associations was summed across all traits, for a total of 107,276 associations (including 7,546 or 7% that were located within 1Mb of an ExWAS signal). b, Top half of the figure shows number of independent CV signals (MAF>1% and conditionally independent) per trait, from the TOPMed GWAS. Bottom half of the figure shows number of genes with a RV association for the same trait from ExWAS. The x-axis shows all 492 traits that had 1 or more genes with a RV association, sorted by the number of CV signals, with ties in turn sorted by number of genes with a RV association. Traits that did not have RV signals (3,994-492 = 3,506) are not shown on this plot. Twenty binary traits that had 2 or more genes with a RV association but no CV signals from the GWAS are highlighted by the dashed box and listed in Supplementary Table 13. c, This panel shows associations with RV before (x-axis) and after (y-axis) accounting for the effect of CV signals. Of the 8,865 RV associations, 806 (9%) were no longer significant at P < 2.18 × 10−11 after accounting for CV signals (see also Supplementary Table 17). The highlighted association between HSPG2 and alkaline phosphatase is an example of an association that was greatly attenuated after controlling for the effect of CV signals (regional association plots shown in Supplementary Fig. 8).
Extended Data Fig. 5
Extended Data Fig. 5. Comparison of effect sizes across ancestries for 564 lead associations identified in Europeans.
For each of the 564 genes with at least 1 rare variant association in individuals of European (EUR) ancestry, we selected the most significant association (484 with a quantitative trait, 80 with a binary trait; see Supplementary Table 6) and then compared the effect size estimated in Europeans with that estimated in individuals of South Asian (SAS), African (AFR) and East Asian (EAS) ancestry, if available. a, Of the 484 gene associations with a quantitative trait, 355 (83% directionally concordant), 347 (73%) and 210 (74%) were available in SAS, AFR and EAS, respectively. b, Of the 80 gene associations with a binary trait, 31 (61% directionally concordant), 31 (61%) and 11 (64%) were available in SAS, AFR and EAS, respectively. Red circles represent associations with P ≤ 0.05 in the corresponding non-European ancestry. Numbers in the corner of each quadrant represent the proportion of associations in that quadrant, out of the total number of associations in black, and out of the subset with a P ≤ 0.05 in red. Triangles: associations between binary traits and variants for which the minor allele count (MAC) was 0 in affected individuals.
Extended Data Fig. 6
Extended Data Fig. 6. Effect of burden mask composition on yield of significant rare variant associations.
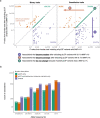
a, Comparison of the trait association P-value between burden tests that included pLOF variants with a minor allele frequency (MAF) up to 1% (x-axis) and burden tests that included pLOF variants with a MAF up to 0.1% (y-axis). For a large fraction of associations (64.1% for binary traits, 79.8% for quantitative traits), the association P-value was the same between the 2 burden test strategies, indicating that there were no (or very few) variants with a MAF between 0.1% and 1% included in the burden test. b, Comparison of association yield between burden tests that included pLOF variants only and burden tests that included both pLOF and deleterious missense variants. This comparison was performed separately for the 5 different allele frequency thresholds used to determine which variants were aggregated in the burden test. The proportion of trait associations discovered only when considering both pLOF and deleterious missense variants increased steadily with increasing allele frequency, from 19.3% (46/238) when testing only singletons, to 42.6% (655/1,539) when considering variants with a MAF up to 1%.
Extended Data Fig. 7
Extended Data Fig. 7. Illustration of the utility of exome sequencing data to identify likely effector genes of common variant signals from GWAS.
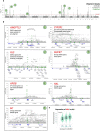
a, GWAS results for serum vitamin D levels, based on TOPMed imputed data for the same individuals with exome sequencing data. There were 82 independent common variant signals (considering only variants with a MAF>1% and P < 5 × 10−8; of these, 62 were located >10 Mb apart). Analysis of exome sequencing data identified 7 genes with a significant rare variant burden association at P < 2.18 × 10−11 (shown by green circles in the Manhattan plot; up to 10 burden tests performed per gene) after conditioning on GWAS signals. Of these 7 genes (highlighted by the large, green and numbered circles), 5 were the nearest gene to a GWAS signal: FLG, ANGPTL3, GC, DHCR7 and HAL. P-values were capped at <10−50. b, Regional association plots are shown for these 7 genes, with green circles showing results from burden tests only, and grey circles showing results from all other variants tested individually, from imputed and exome data. c, Association between a sentinel eQTL for HAL (rs3819817) and gene expression in skin tissue (sun exposed – lower leg), estimated by GTEx using linear regression. This variant co-localized (r2 = 0.97) with the peak variant associated with vitamin D levels at the HAL locus (rs10859995).
Extended Data Fig. 8
Extended Data Fig. 8. Number of genes with pLOF carriers in exome sequencing data.
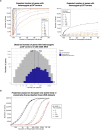
a, Predicted number of genes with heterozygote (top-left panel) and homozygote (top-right panel) pLOF carriers in exome sequencing data in datasets of up to 5 million individuals. Bottom panel shows distribution of the observed number of heterozygote pLOF carriers per gene in exome sequencing of 454,787 individuals from the UK Biobank. b, Predicted number of genes with heterozygote pLOF carriers in 5 million individuals based on a reference dataset of (i) 46K individuals of European ancestry from the UKB (solid lines); and (ii) 46K individuals from the UKB spanning multiple ancestries (dashed lines), including 23K of European ancestry and 23K individuals of other ancestries (10K of South Asian, 9K of African, 2K of East Asian ancestry, 1K of Hispanic or Latin American ancestry and 1K of admixed ancestry).
Extended Data Fig. 9
Extended Data Fig. 9. Predicted imputation accuracy for variants from exome sequencing as a function of the size of the reference panel using a two-parameter logistic model.
a, Each panel shows the imputation accuracy (r2, y-axis) as a function of the number of individuals included in the reference panel (x-axis), for a given allele frequency bin (estimated in the reference panel). Grey dots show the imputation accuracy that was observed when analysing reference panels with up to 400,000 individuals. Red dots show the imputation accuracy that was predicted for reference panels with >400,000 individuals, obtained by fitting a 2-parameter logistic curve to results from reference panels with ≤400,000 individuals. The fit from this logistic curve is shown by the solid line, with associated 95% confidence intervals shown in light red. The blue dot is the extrapolated value for a reference panel of 400,000 individuals obtained by fitting the curve using only reference panels with <400,000 individuals. b, Imputation accuracy (r2, y-axis) is shown as a function of the variant allele frequency (x-axis; minor allele count [MAC] for ultra-rare variants, minor allele frequency [MAF] for variants with MAF>10−4) and the number of individuals (N) included in the reference panel (different lines). Solid lines show the imputation accuracy that was observed when analysing reference panels with up to 400,000 individuals. Dashed lines show the imputation accuracy that was predicted for reference panels with >400,000 individuals, obtained by fitting a 2-parameter logistic curve to results from reference panels with ≤400,000 individuals.

Comment in

Similar articles

Cited by

References

    1. Szustakowski JD, et al. Advancing human genetics research and drug discovery through exome sequencing of the UK Biobank. Nat. Genet. 2021;53:942–948. - PubMed
    1. Bycroft C, et al. The UK Biobank resource with deep phenotyping and genomic data. Nature. 2018;562:203–209. - PMC - PubMed
    1. Van Hout CV, et al. Exome sequencing and characterization of 49,960 individuals in the UK Biobank. Nature. 2020;586:749–756. - PMC - PubMed
    1. Taliun D, et al. Sequencing of 53,831 diverse genomes from the NHLBI TOPMed Program. Nature. 2021;590:290–299. - PMC - PubMed
    1. Karczewski KJ, et al. The mutational constraint spectrum quantified from variation in 141,456 humans. Nature. 2020;581:434–443. - PMC - PubMed

Publication types

MeSH terms