Enhanced Vulnerability of LKB1-Deficient NSCLC to Disruption of ATP Pools and Redox Homeostasis by 8-Cl-Ado
- PMID: 34654720
- PMCID: PMC8816854
- DOI: 10.1158/1541-7786.MCR-21-0448
Enhanced Vulnerability of LKB1-Deficient NSCLC to Disruption of ATP Pools and Redox Homeostasis by 8-Cl-Ado
Abstract
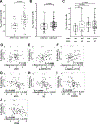
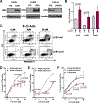
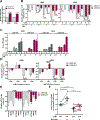
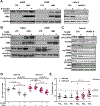
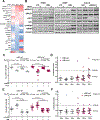
Loss-of-function somatic mutations of STK11, a tumor suppressor gene encoding LKB1 that contributes to the altered metabolic phenotype of cancer cells, is the second most common event in lung adenocarcinomas and often co-occurs with activating KRAS mutations. Tumor cells lacking LKB1 display an aggressive phenotype, with uncontrolled cell growth and higher energetic and redox stress due to its failure to balance ATP and NADPH levels in response to cellular stimulus. The identification of effective therapeutic regimens for patients with LKB1-deficient non-small cell lung cancer (NSCLC) remains a major clinical need. Here, we report that LKB1-deficient NSCLC tumor cells displayed reduced basal levels of ATP and to a lesser extent other nucleotides, and markedly enhanced sensitivity to 8-Cl-adenosine (8-Cl-Ado), an energy-depleting nucleoside analog. Treatment with 8-Cl-Ado depleted intracellular ATP levels, raised redox stress, and induced cell death leading to a compensatory suppression of mTOR signaling in LKB1-intact, but not LKB1-deficient, cells. Proteomic analysis revealed that the MAPK/MEK/ERK and PI3K/AKT pathways were activated in response to 8-Cl-Ado treatment and targeting these pathways enhanced the antitumor efficacy of 8-Cl-Ado. IMPLICATIONS: Together, our findings demonstrate that LKB1-deficient tumor cells are selectively sensitive to 8-Cl-Ado and suggest that therapeutic approaches targeting vulnerable energy stores combined with signaling pathway inhibitors merit further investigation for this patient population.
©2021 American Association for Cancer Research.
Figures


Similar articles
-
LKB1 deficiency enhances sensitivity to energetic stress induced by erlotinib treatment in non-small-cell lung cancer (NSCLC) cells.Oncogene. 2016 Feb 18;35(7):856-66. doi: 10.1038/onc.2015.140. Epub 2015 Jun 29. Oncogene. 2016. PMID: 26119936 Free PMC article.
-
The Effect of LKB1 Activity on the Sensitivity to PI3K/mTOR Inhibition in Non-Small Cell Lung Cancer.J Thorac Oncol. 2019 Jun;14(6):1061-1076. doi: 10.1016/j.jtho.2019.02.019. Epub 2019 Feb 27. J Thorac Oncol. 2019. PMID: 30825612 Free PMC article.
-
LKB1 and KEAP1/NRF2 Pathways Cooperatively Promote Metabolic Reprogramming with Enhanced Glutamine Dependence in KRAS-Mutant Lung Adenocarcinoma.Cancer Res. 2019 Jul 1;79(13):3251-3267. doi: 10.1158/0008-5472.CAN-18-3527. Epub 2019 Apr 30. Cancer Res. 2019. PMID: 31040157 Free PMC article.
-
Inhibition of autophagy and MEK promotes ferroptosis in Lkb1-deficient Kras-driven lung tumors.Cell Death Dis. 2023 Jan 26;14(1):61. doi: 10.1038/s41419-023-05592-8. Cell Death Dis. 2023. PMID: 36702816 Free PMC article.
-
LKB1/AMPK Pathway and Drug Response in Cancer: A Therapeutic Perspective.Oxid Med Cell Longev. 2019 Oct 31;2019:8730816. doi: 10.1155/2019/8730816. eCollection 2019. Oxid Med Cell Longev. 2019. PMID: 31781355 Free PMC article. Review.
Cited by
-
Inhibition of USP14 enhances anti-tumor effect in vemurafenib-resistant melanoma by regulation of Skp2.Cell Biol Toxicol. 2023 Oct;39(5):2381-2399. doi: 10.1007/s10565-022-09729-x. Epub 2022 Jun 1. Cell Biol Toxicol. 2023. PMID: 35648318
-
LKB1: Can We Target an Hidden Target? Focus on NSCLC.Front Oncol. 2022 May 11;12:889826. doi: 10.3389/fonc.2022.889826. eCollection 2022. Front Oncol. 2022. PMID: 35646638 Free PMC article. Review.
-
Energy metabolism as the hub of advanced non-small cell lung cancer management: a comprehensive view in the framework of predictive, preventive, and personalized medicine.EPMA J. 2024 Apr 8;15(2):289-319. doi: 10.1007/s13167-024-00357-5. eCollection 2024 Jun. EPMA J. 2024. PMID: 38841622 Free PMC article. Review.
References
-
- Torre LA, Siegel RL, Jemal A. Lung Cancer Statistics. In: Ahmad A, Gadgeel S, editors. Lung Cancer and Personalized Medicine: Current Knowledge and Therapies. Cham: Springer International Publishing; 2016. p 1–19.
-
- Nanjundan M, Byers LA, Carey MS, Siwak DR, Raso MG, Diao L, et al. Proteomic profiling identifies pathways dysregulated in non-small cell lung cancer and an inverse association of AMPK and adhesion pathways with recurrence. J Thorac Oncol 2010;5(12):1894–904 doi 10.1097/JTO.0b013e3181f2a266. - DOI - PMC - PubMed
Publication types
MeSH terms
Substances
Grants and funding
LinkOut - more resources
Full Text Sources
Medical
Miscellaneous

