

Genome-wide survey of Gγ subunit gene family in eight Rosaceae and expression analysis of PbrGGs in pear (Pyrus bretschneideri)
- PMID: 34654373
- PMCID: PMC8518290
- DOI: 10.1186/s12870-021-03250-9
Genome-wide survey of Gγ subunit gene family in eight Rosaceae and expression analysis of PbrGGs in pear (Pyrus bretschneideri)
Abstract
Background: Heterotrimeric G-proteins, composed of Gα, Gβ and Gγ subunits, are important signal transmitters, mediating the cellular response to multiple stimuli in animals and plants. The Gγ subunit is an essential component of the G-protein, providing appropriate functional specificity to the heterotrimer complex and has been well studied in many species. However, the evolutionary history, expression pattern and functional characteristics of Gγ subunits has not been explored in the Rosaceae, representing many important fruit crops.
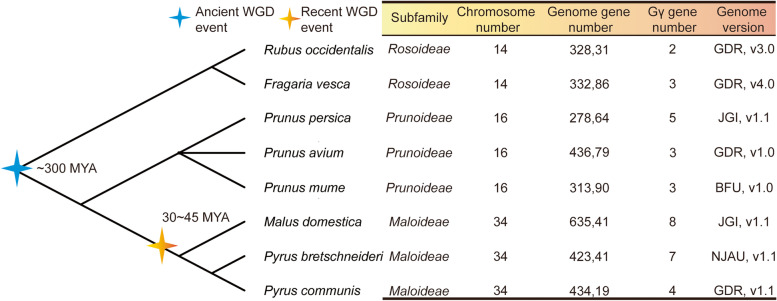
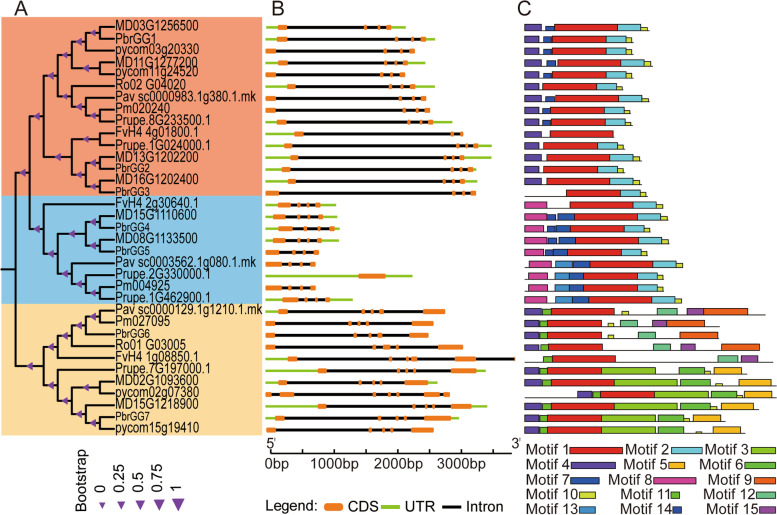
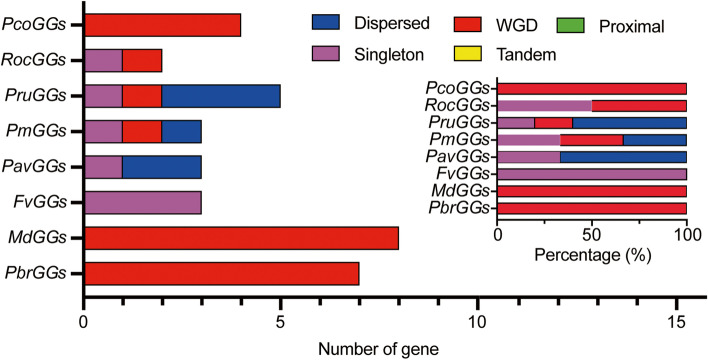
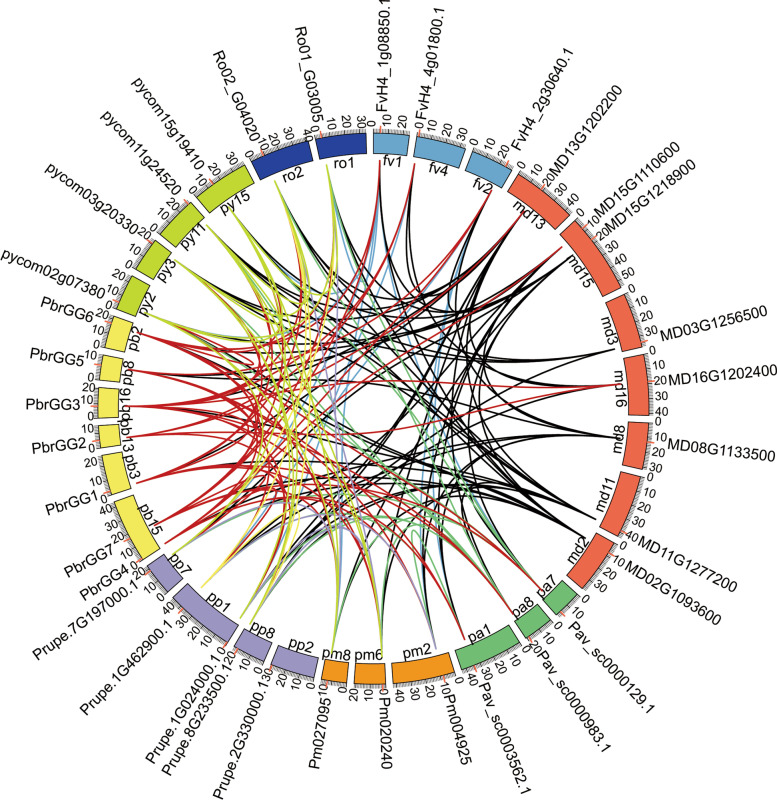
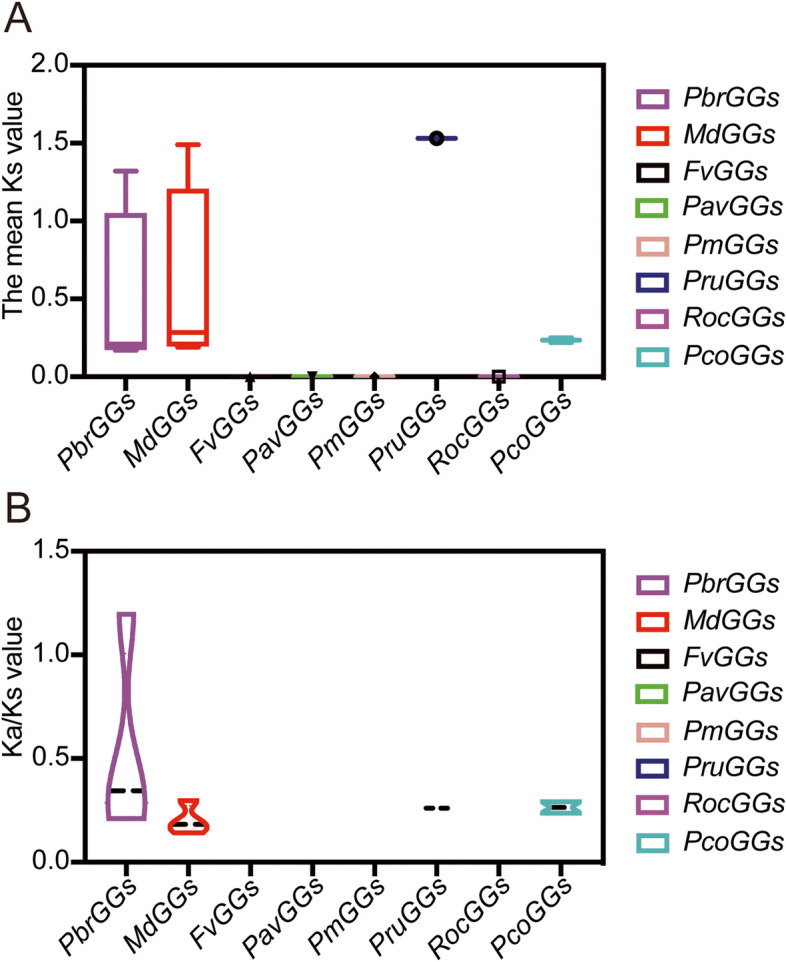
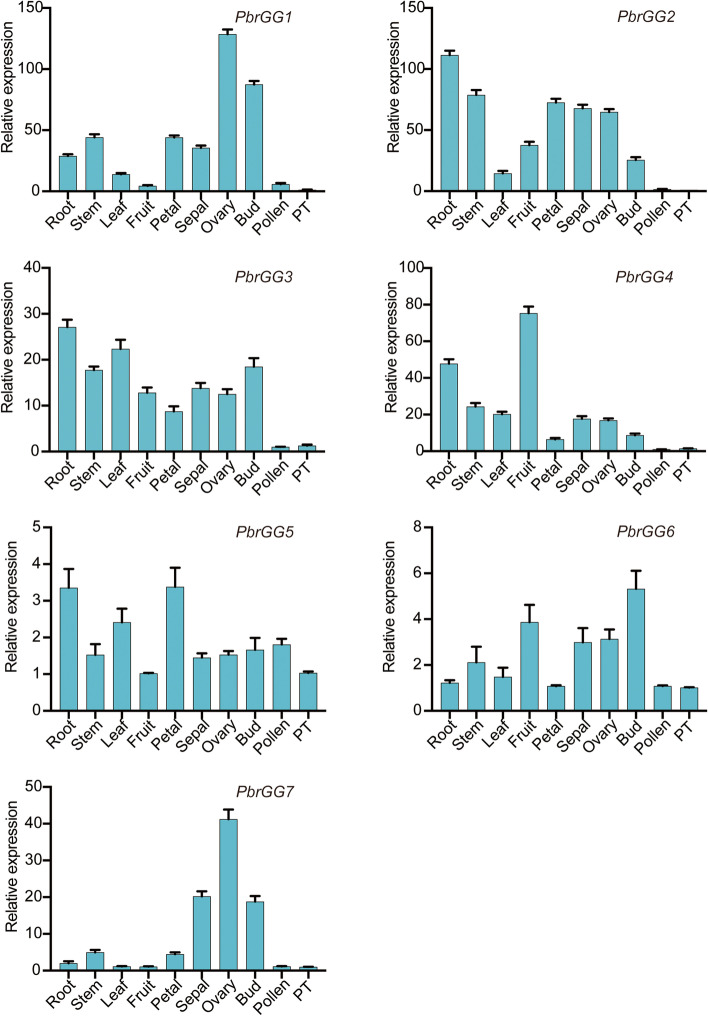
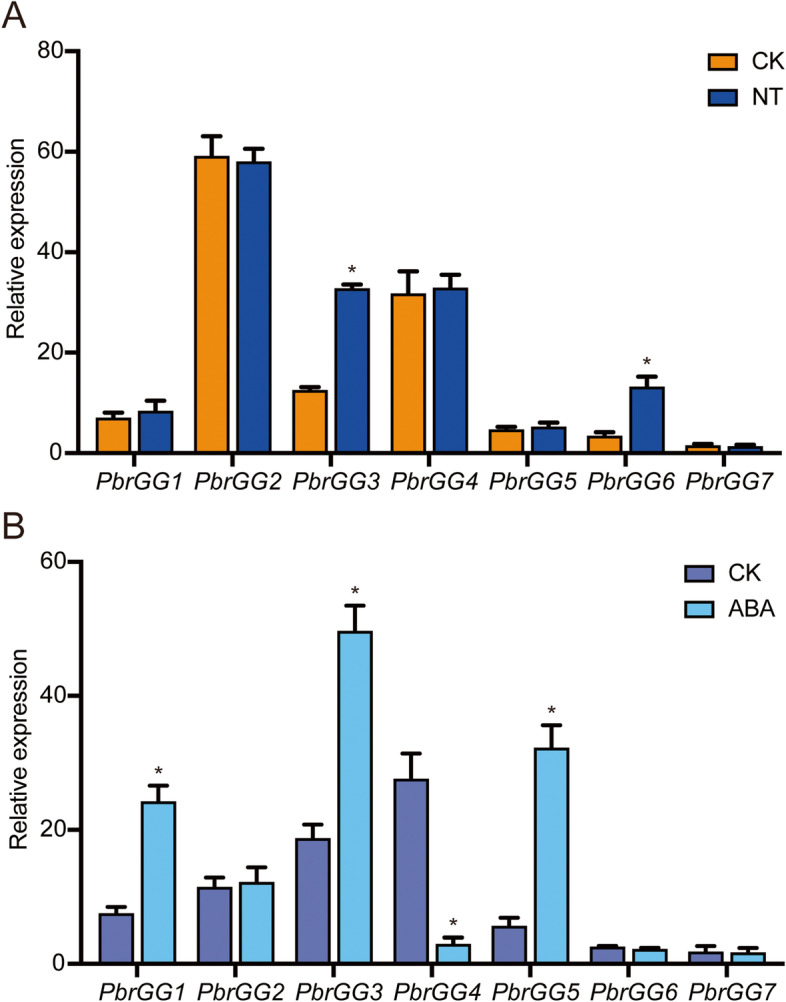
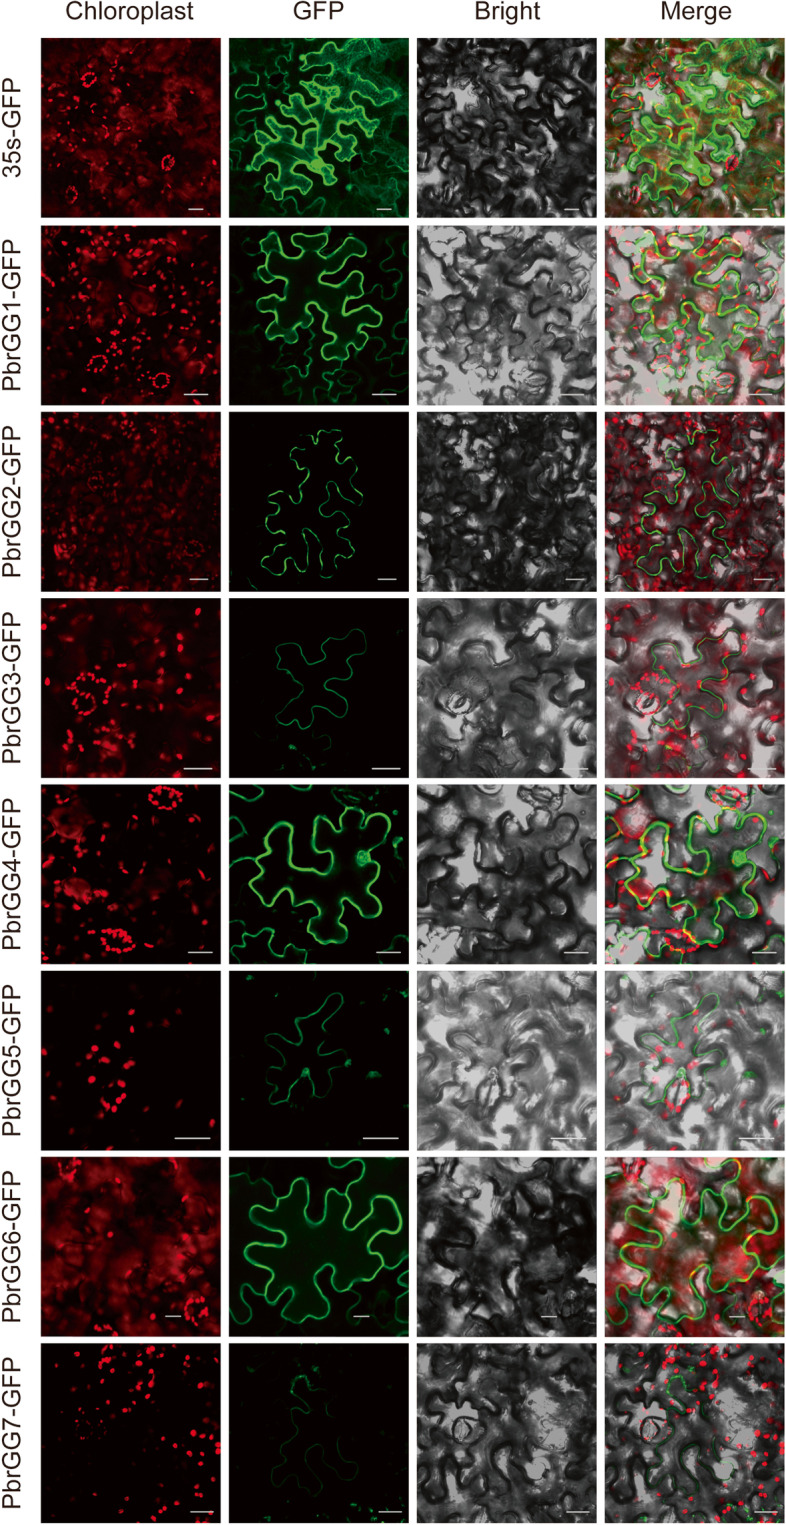
Results: In this study, 35 Gγ subunit genes were identified from the eight species belonging to the Rosaceae family. Based on the structural gene characteristics, conserved protein motifs and phylogenetic analysis of the Gγ subunit genes, the genes were classified into three clades. Purifying selection was shown to play an important role in the evolution of Gγ subunit genes, while a recent whole-genome duplication event was the principal force determining the expansion of the Gγ subunit gene family in the subfamily Maloideae. Gγ subunit genes exhibited diverse spatiotemporal expression patterns in Chinese white pear, including fruit, root, ovary and bud, and under abiotic stress conditions, the relative expression of Gγ subunit genes were up-regulated or down-regulated. In addition, seven of the Gγ subunit proteins in pear were located on the plasma membrane, in the cytoplasm or nucleus.
Conclusion: Overall, this study of the Gγ subunit gene family in eight Rosaceae species provided useful information to better understand the evolution and expression of these genes and facilitated further exploration of their functions in these important crop plants.
Keywords: Abiotic stress; Expression pattern; Gγ subunit; Pear; Subcellular localization.
© 2021. The Author(s).
Conflict of interest statement
The authors declare that they have no competing interests.
Figures
Similar articles
-
Genome‑wide characterization of the Gα subunit gene family in Rosaceae and expression analysis of PbrGPAs under heat stress.Gene. 2022 Feb 5;810:146056. doi: 10.1016/j.gene.2021.146056. Epub 2021 Oct 31. Gene. 2022. PMID: 34732368
-
Genome-wide identification and comparative analysis of the heat shock transcription factor family in Chinese white pear (Pyrus bretschneideri) and five other Rosaceae species.BMC Plant Biol. 2015 Jan 21;15:12. doi: 10.1186/s12870-014-0401-5. BMC Plant Biol. 2015. PMID: 25604453 Free PMC article.
-
Comprehensive Comparative Analysis of the GATA Transcription Factors in Four Rosaceae Species and Phytohormonal Response in Chinese Pear (Pyrus bretschneideri) Fruit.Int J Mol Sci. 2021 Nov 19;22(22):12492. doi: 10.3390/ijms222212492. Int J Mol Sci. 2021. PMID: 34830372 Free PMC article.
-
Comparative genomic analysis of the RabGAP gene family in seven Rosaceae species, and functional identification of PbrRabGAP10 in controlling pollen tube growth by mediating cellulose deposition in pear.Int J Biol Macromol. 2024 Jan;256(Pt 2):128498. doi: 10.1016/j.ijbiomac.2023.128498. Epub 2023 Dec 1. Int J Biol Macromol. 2024. PMID: 38042315 Review.
-
The roles of WRKY transcription factors in Malus spp. and Pyrus spp.Funct Integr Genomics. 2022 Oct;22(5):713-729. doi: 10.1007/s10142-022-00886-0. Epub 2022 Jul 29. Funct Integr Genomics. 2022. PMID: 35906324 Review.
Cited by
-
Heterotrimeric G Protein Signaling in Abiotic Stress.Plants (Basel). 2022 Mar 25;11(7):876. doi: 10.3390/plants11070876. Plants (Basel). 2022. PMID: 35406855 Free PMC article. Review.
References
MeSH terms
Substances
LinkOut - more resources
Full Text Sources
