. 2021 Nov 8;39(11):1479-1496.e18.
doi: 10.1016/j.ccell.2021.09.008. Epub 2021 Oct 14.

Signatures of plasticity, metastasis, and immunosuppression in an atlas of human small cell lung cancer

Affiliations

Signatures of plasticity, metastasis, and immunosuppression in an atlas of human small cell lung cancer

Joseph M Chan et al. Cancer Cell. .

Abstract

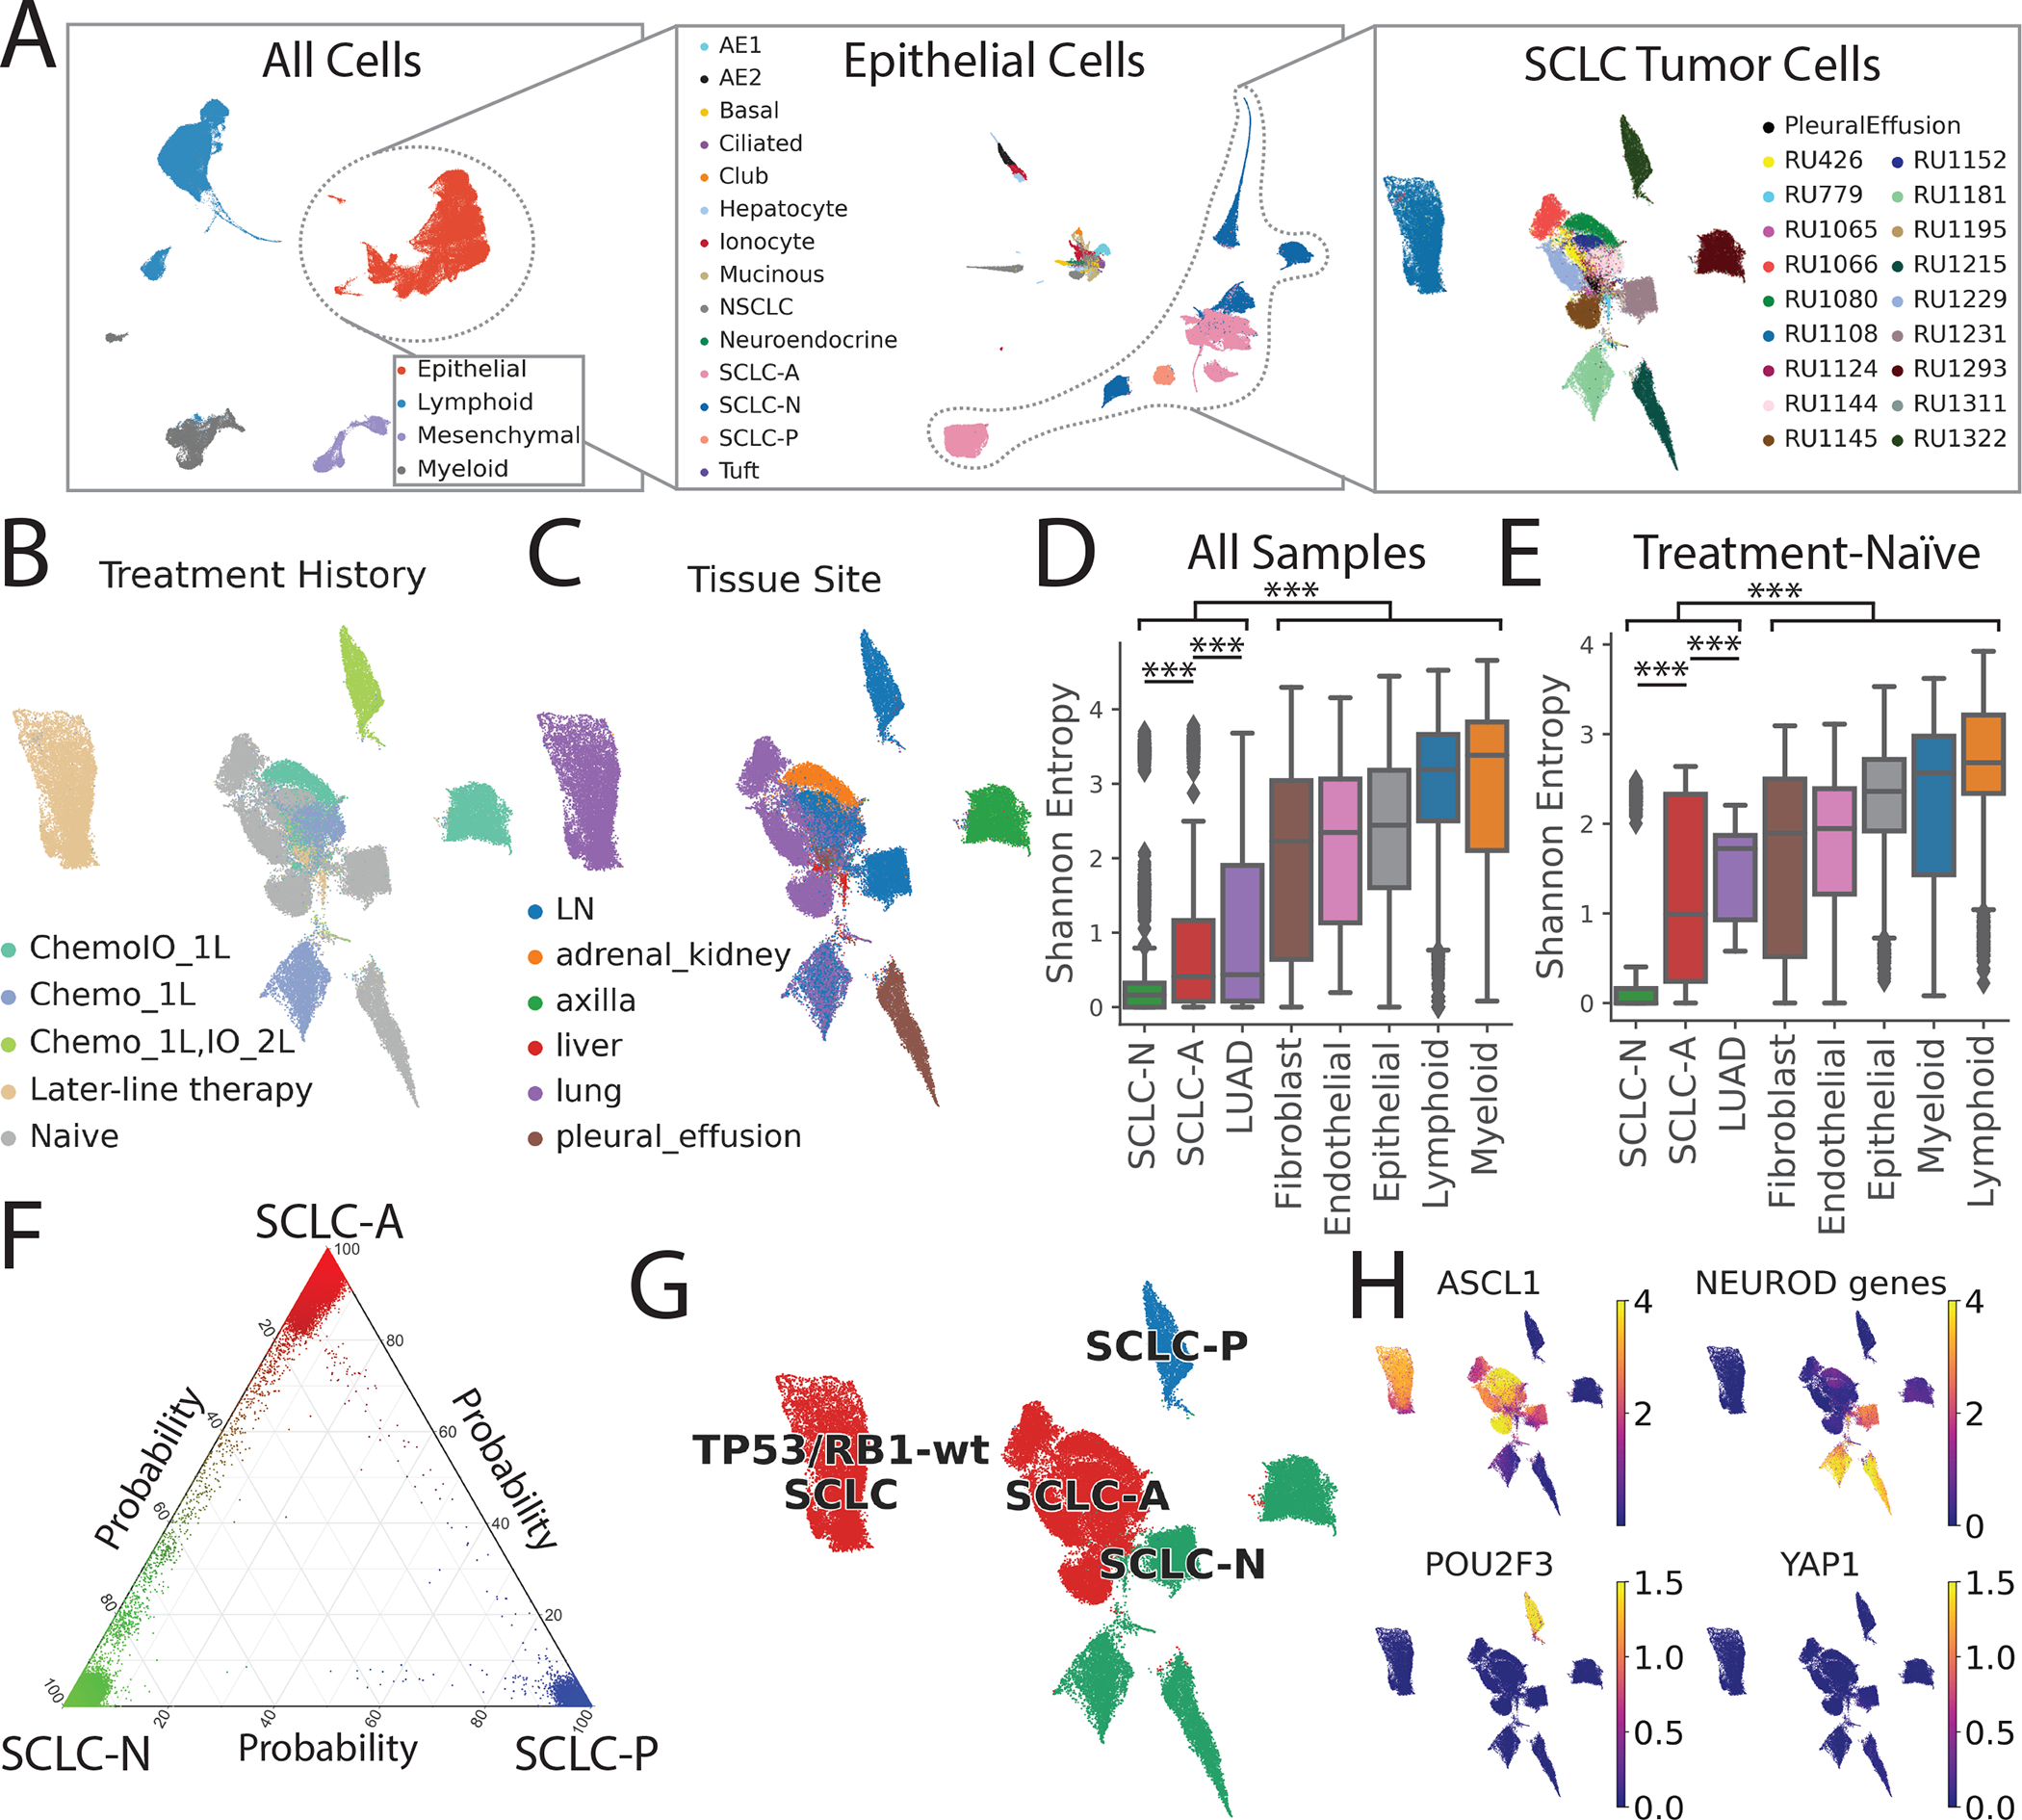
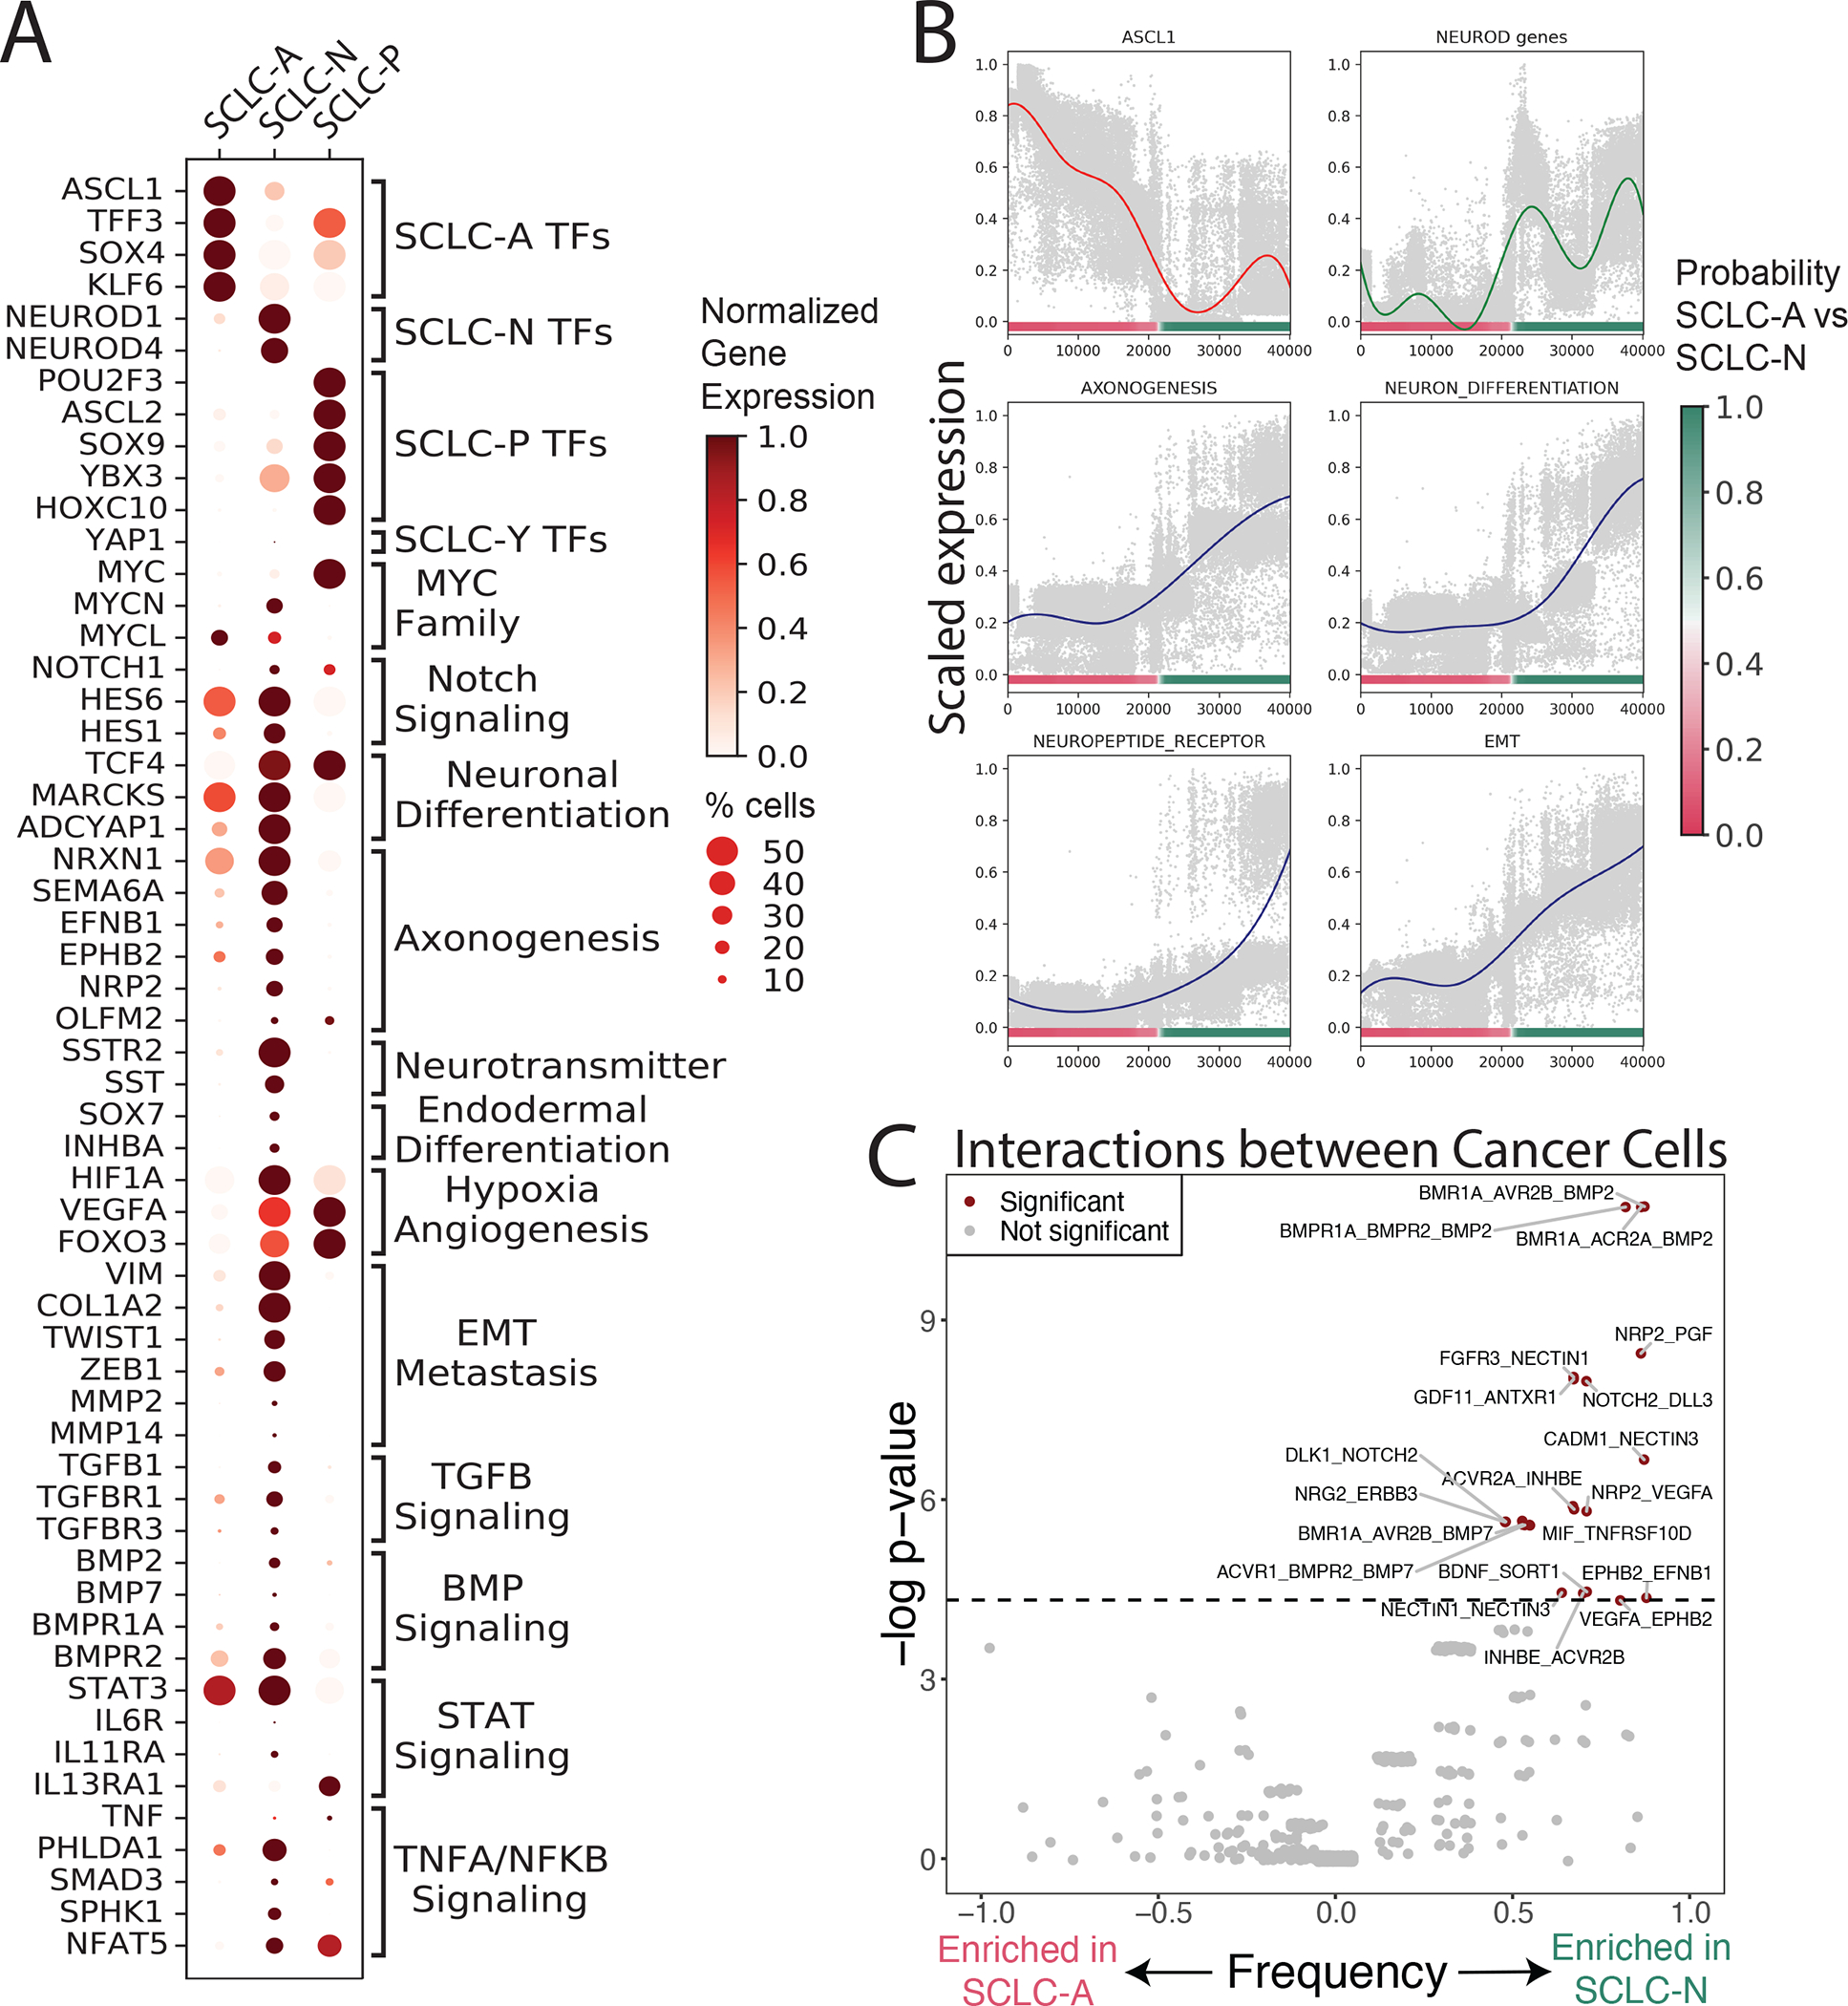
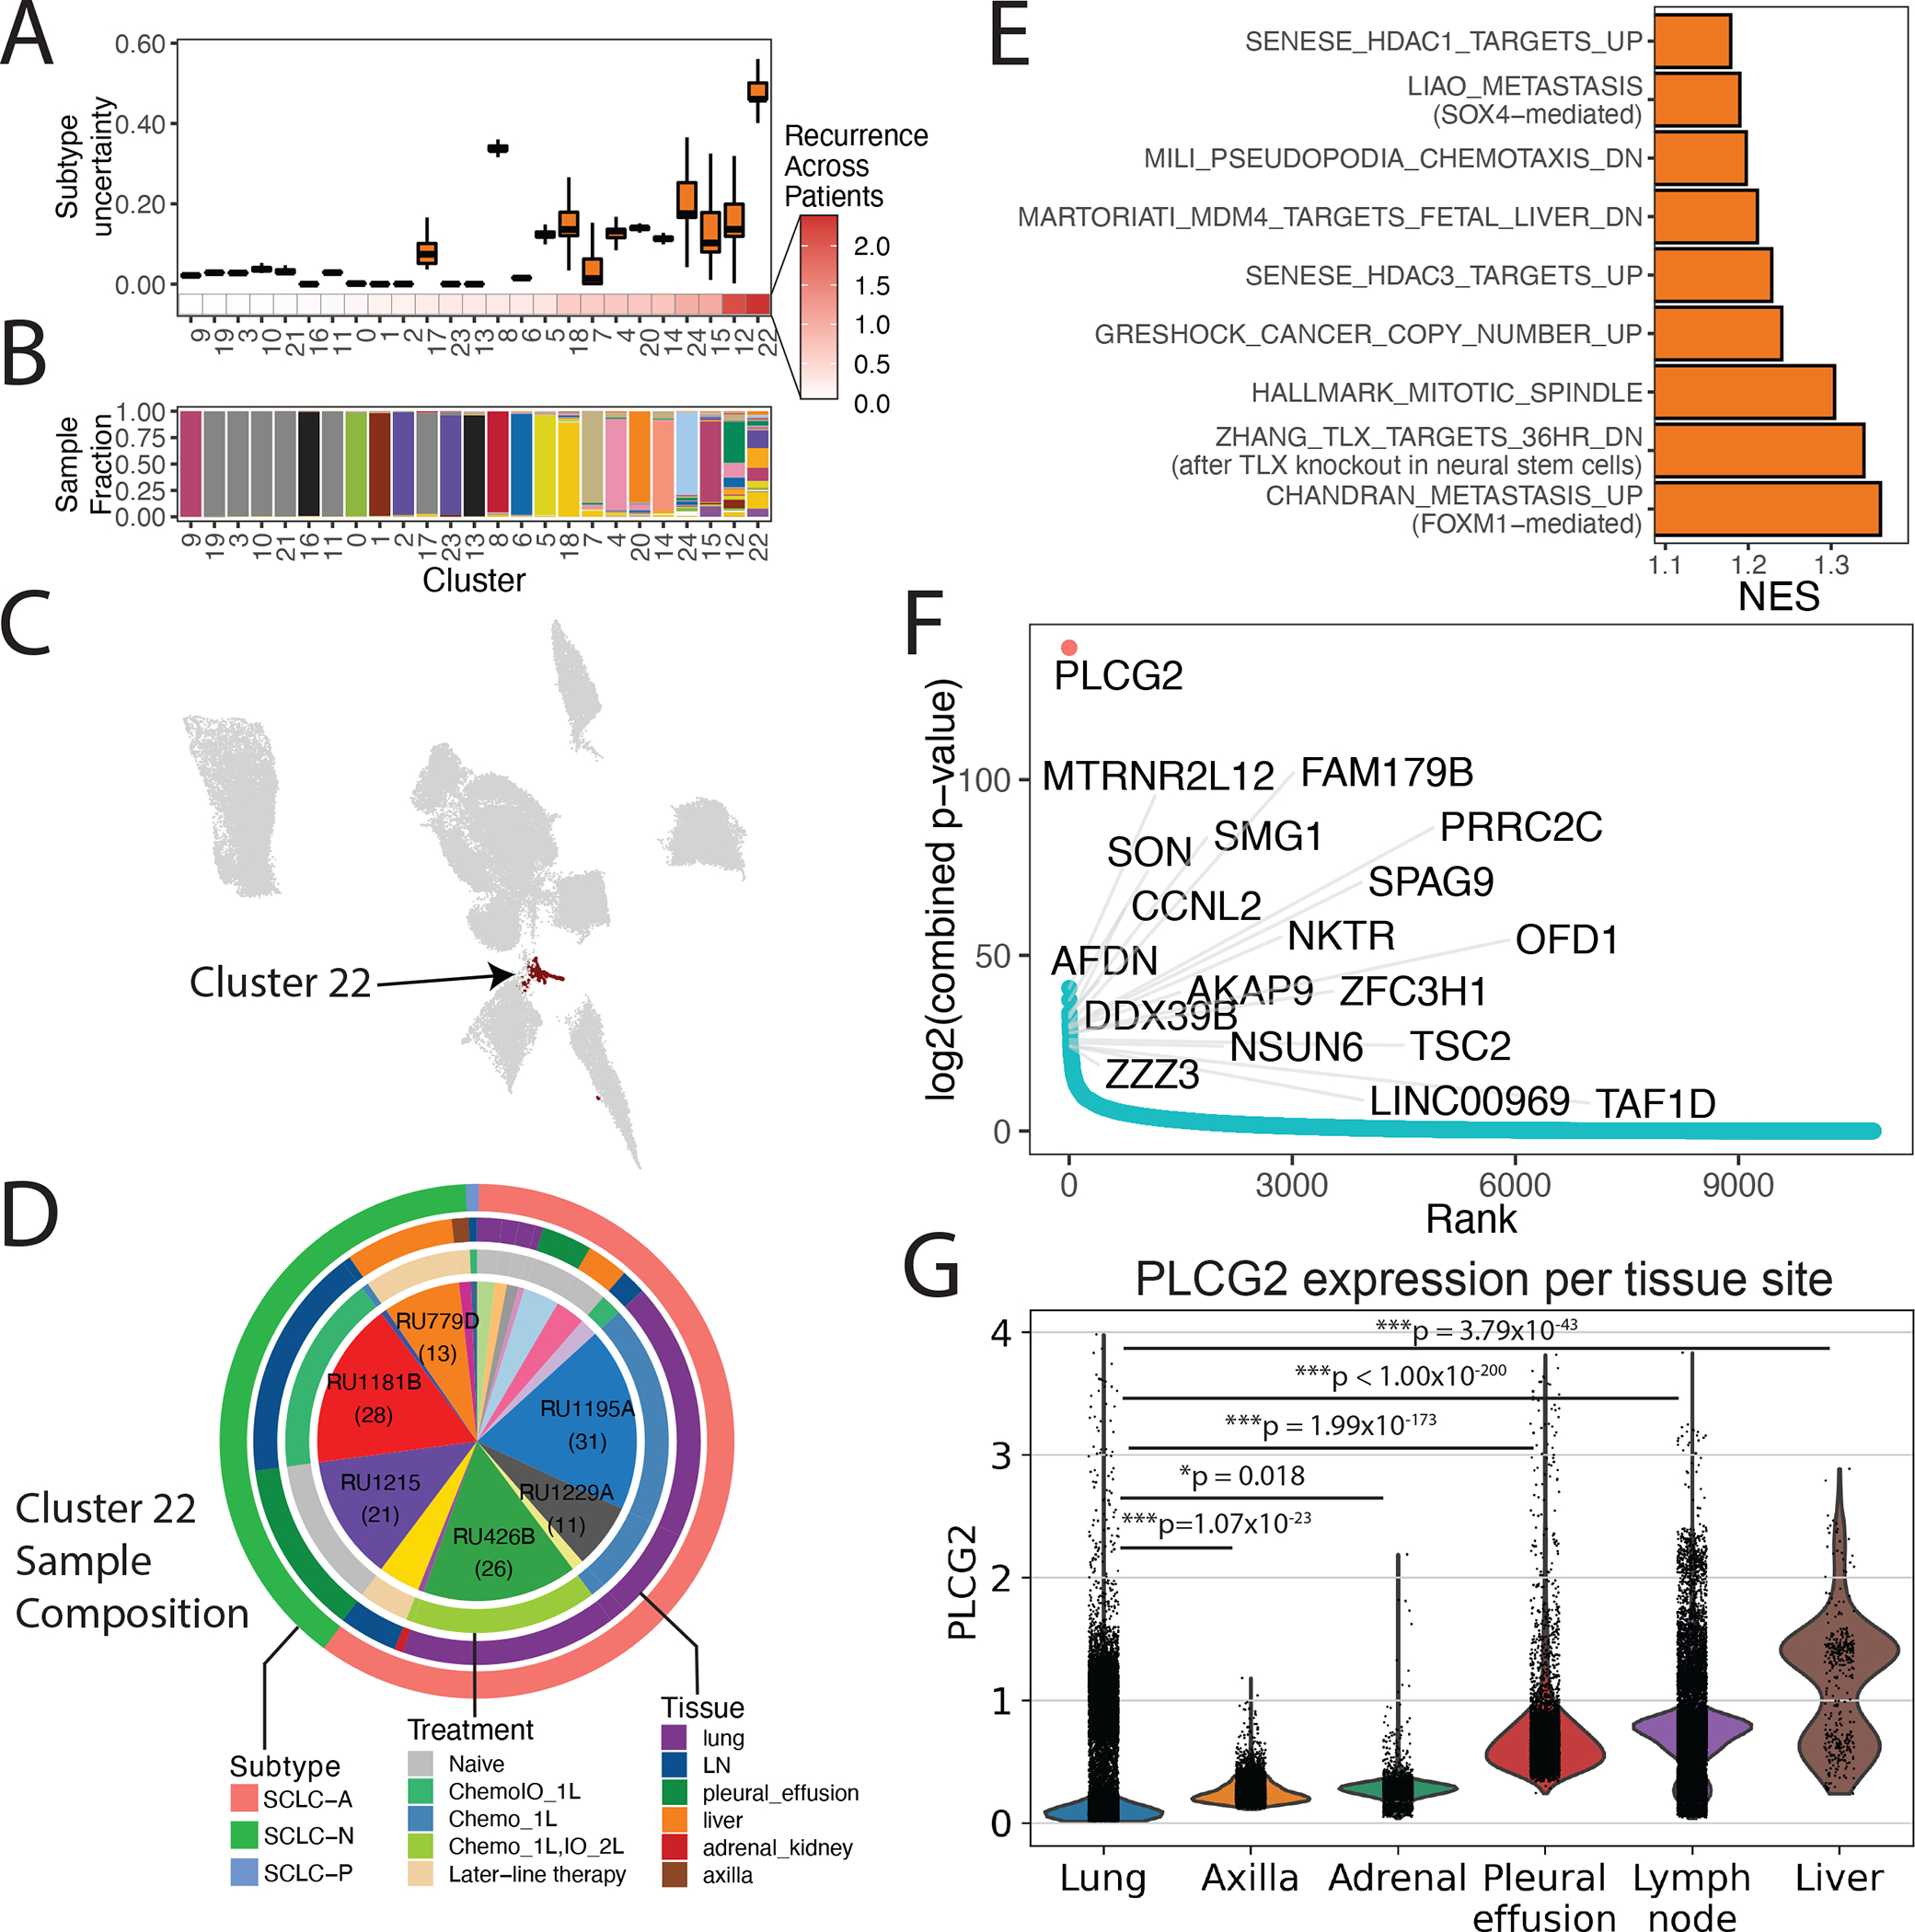
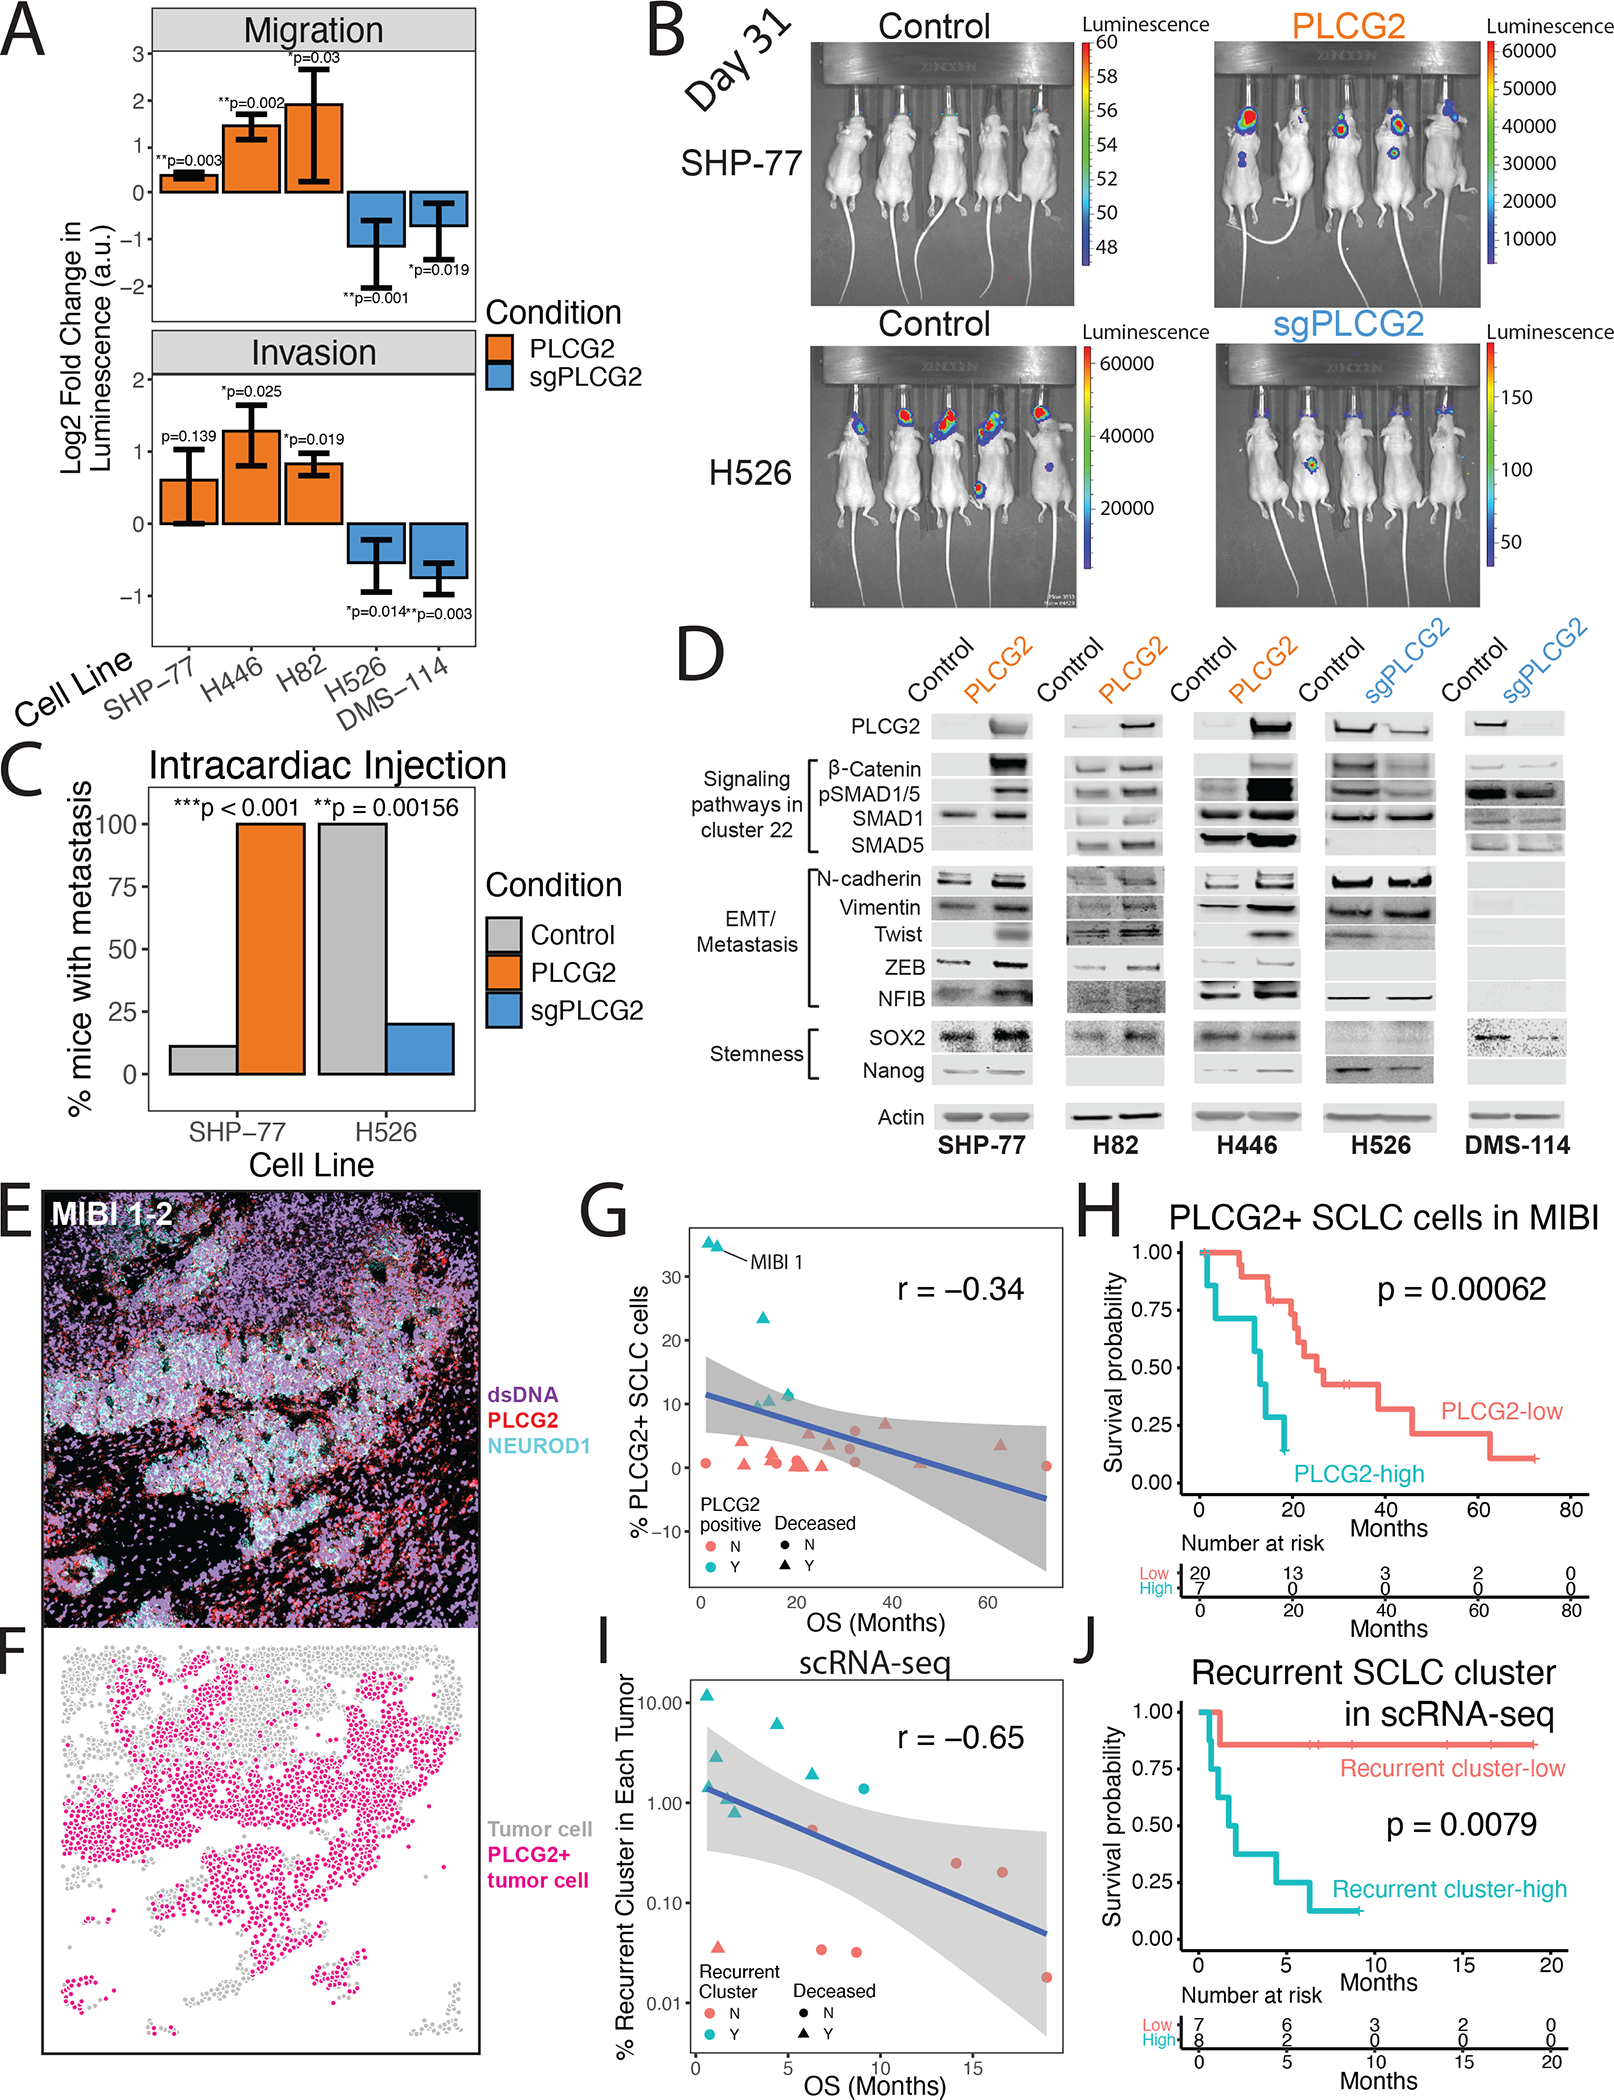
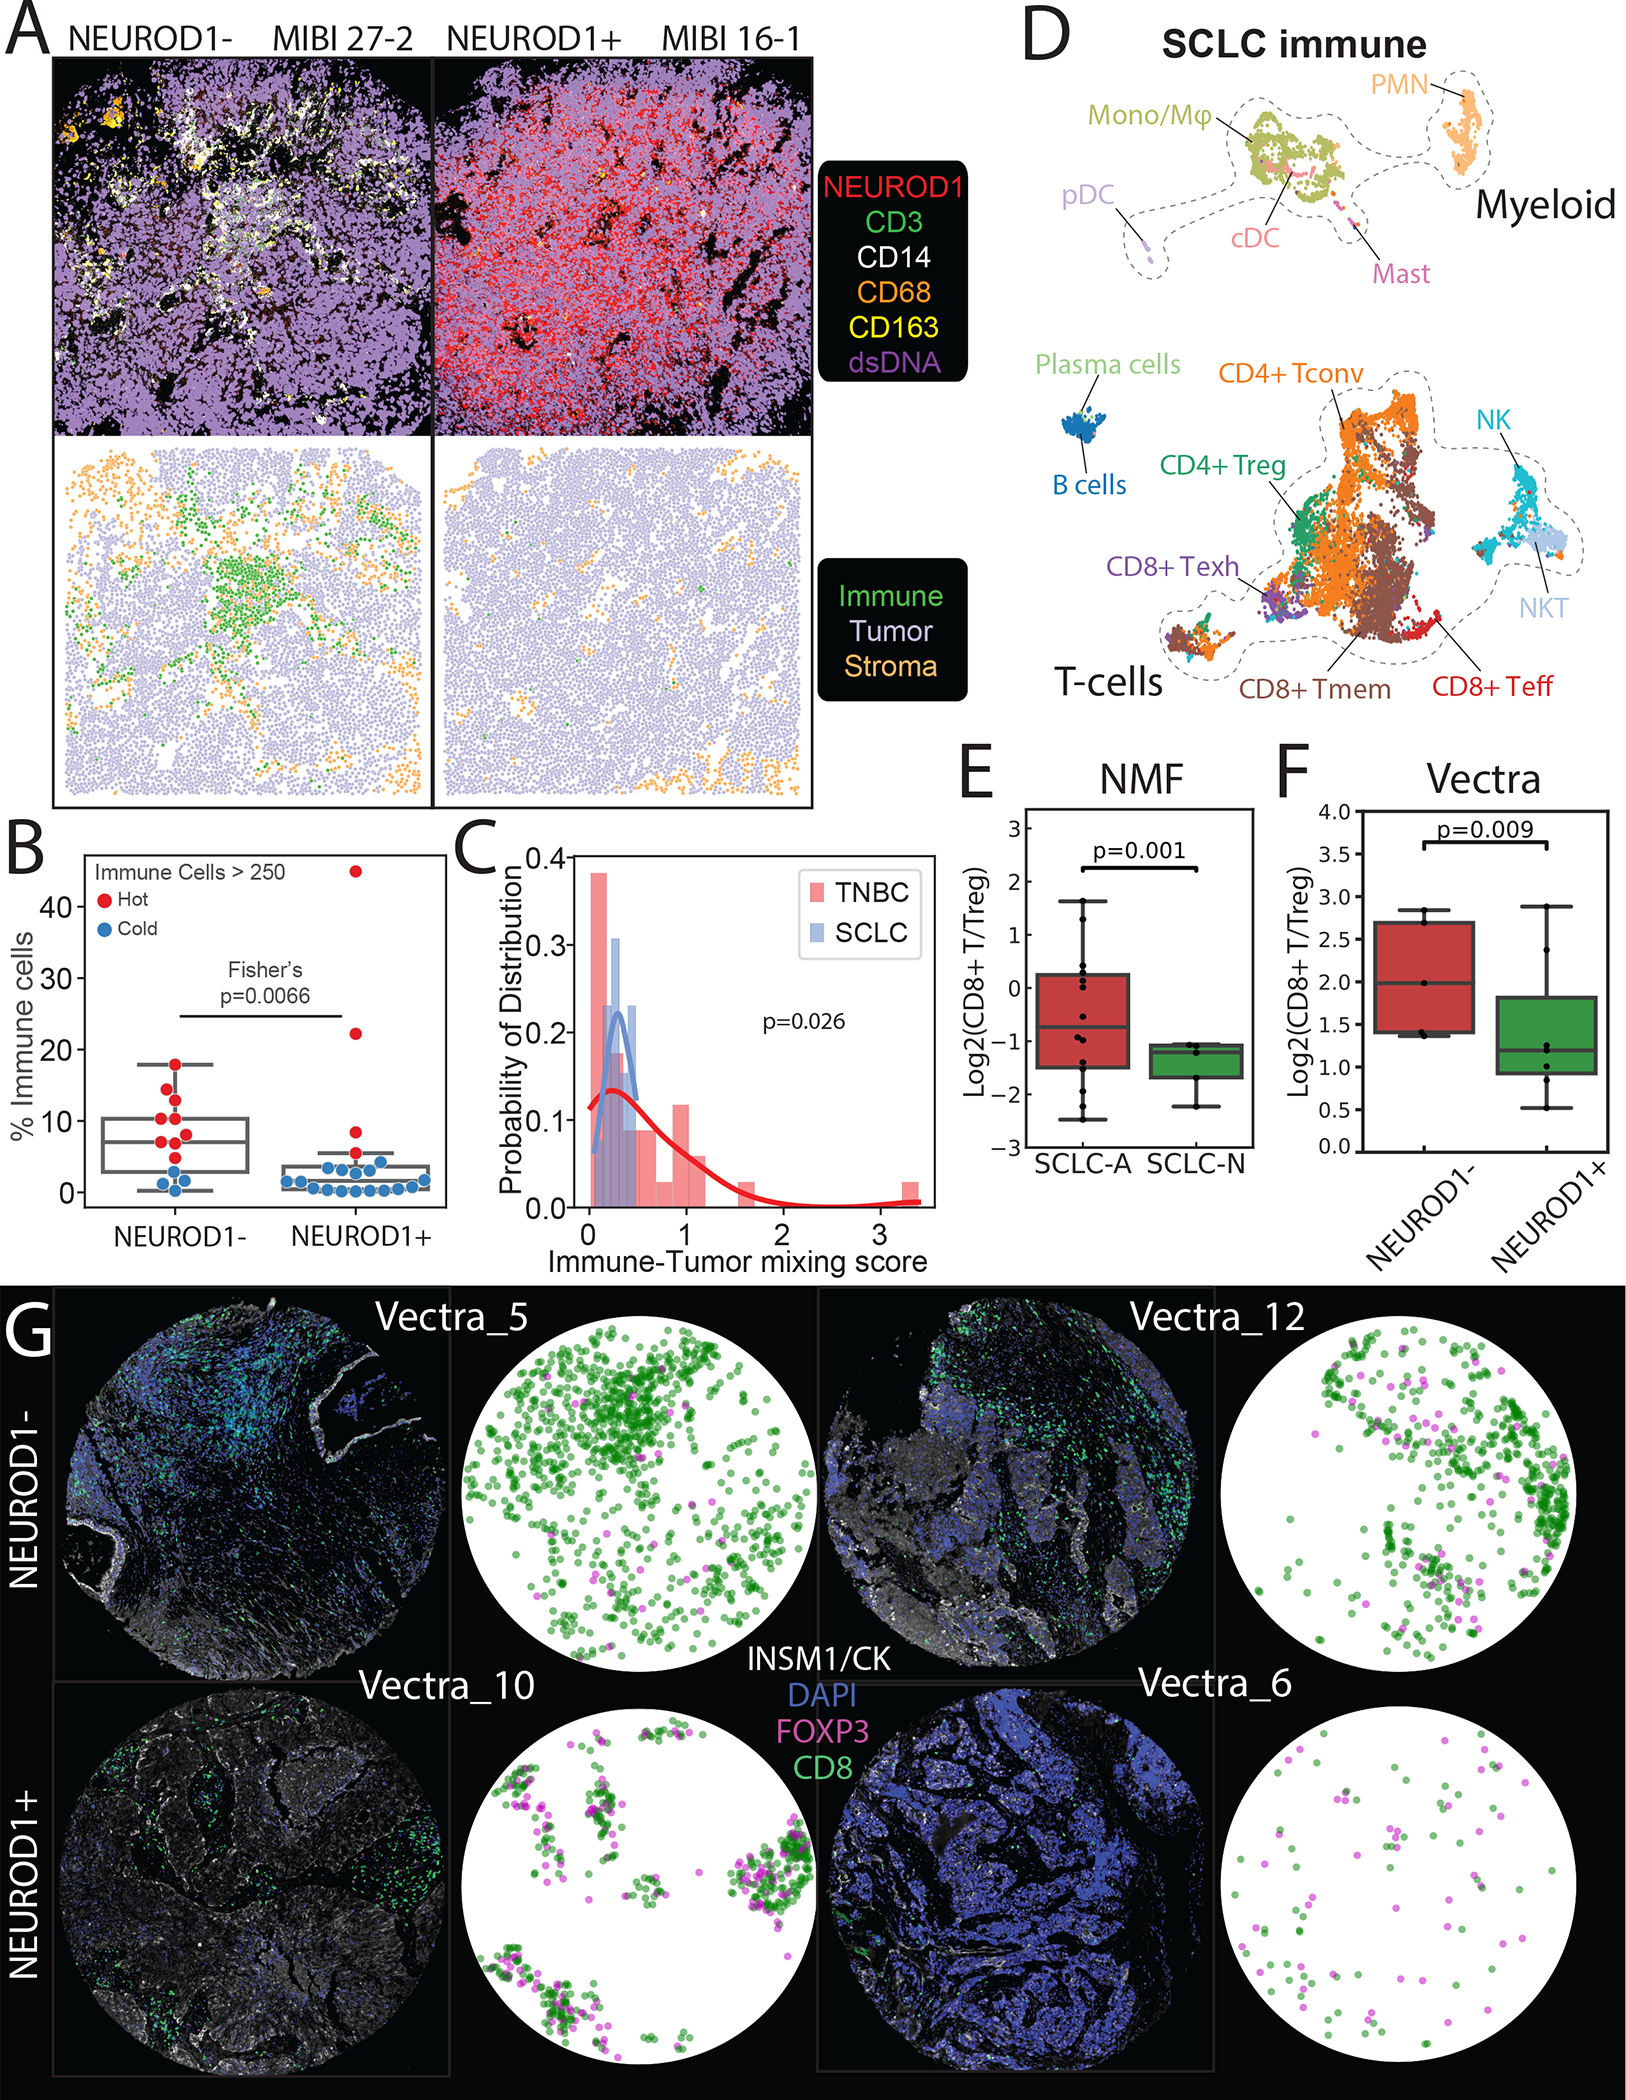
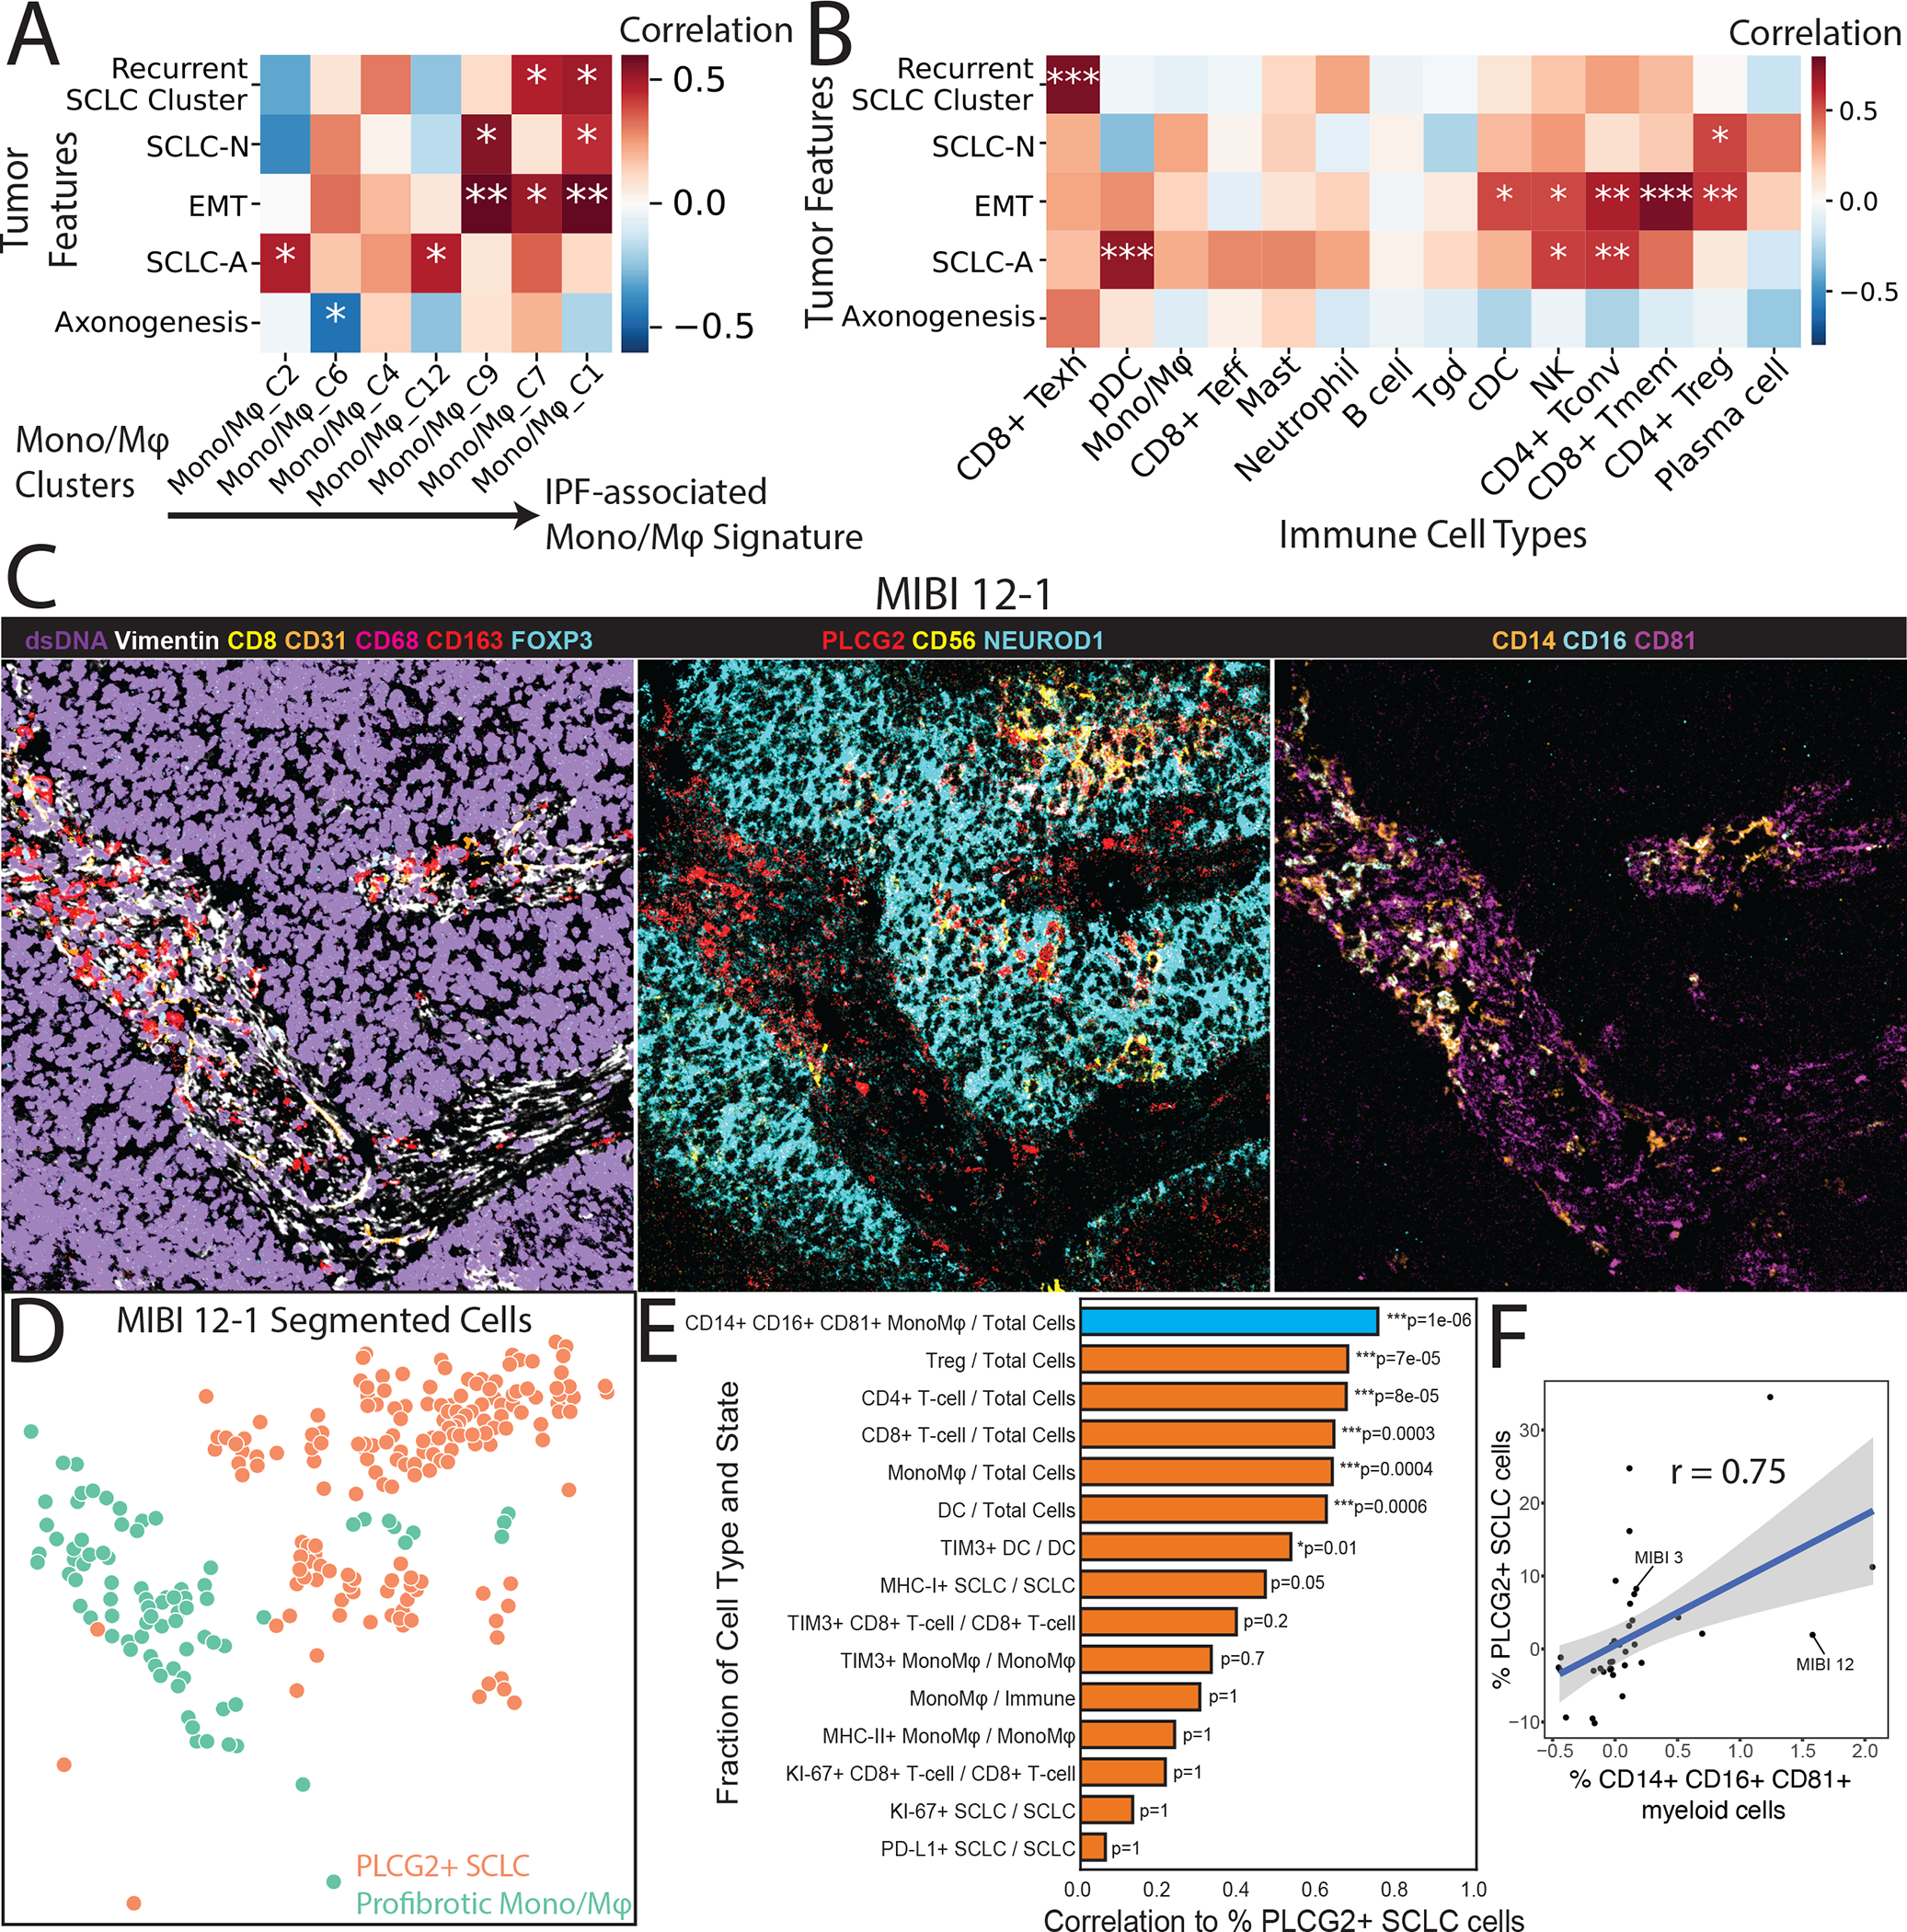
Small cell lung cancer (SCLC) is an aggressive malignancy that includes subtypes defined by differential expression of ASCL1, NEUROD1, and POU2F3 (SCLC-A, -N, and -P, respectively). To define the heterogeneity of tumors and their associated microenvironments across subtypes, we sequenced 155,098 transcriptomes from 21 human biospecimens, including 54,523 SCLC transcriptomes. We observe greater tumor diversity in SCLC than lung adenocarcinoma, driven by canonical, intermediate, and admixed subtypes. We discover a PLCG2-high SCLC phenotype with stem-like, pro-metastatic features that recurs across subtypes and predicts worse overall survival. SCLC exhibits greater immune sequestration and less immune infiltration than lung adenocarcinoma, and SCLC-N shows less immune infiltrate and greater T cell dysfunction than SCLC-A. We identify a profibrotic, immunosuppressive monocyte/macrophage population in SCLC tumors that is particularly associated with the recurrent, PLCG2-high subpopulation.

Keywords: PLCG2; SCLC; metastasis; myeloid; scRNA-seq; single cell; tumor atlas.


Conflict of interest statement

Declaration of interests J.M.C. reports an advisory role in VantAI. A.Q.-V. reports honoraria from AstraZeneca. M.O. reports advisory roles for PharMar, Novartis, and Targeted Oncology, and reports honoraria from Bristol-Myers Squibb and Merck Sharp & Dohme. C.M.R. has consulted regarding oncology drug development with AbbVie, Amgen, Ascentage, AstraZeneca, Bicycle, Celgene, Daiichi Sankyo, Genentech/Roche, Ipsen, Jazz, Lilly, Pfizer, PharmaMar, Syros, and Vavotek. C.M.R. serves on the scientific advisory boards of Bridge Medicines, Earli, and Harpoon Therapeutics.

Figures

Figure 1:
Figure 1:. The single-cell transcriptional landscape of SCLC.
LUAD and normal adjacent lung serve as reference tissues. (A) UMAP of iterative subsets of cells from the global level (left, n=155,098 cells) to the epithelial compartment (middle, n=64,301 cells) to SCLC cells (right, n=54,523 cells). Each dot represents a single cell colored by cell type. UMAP of SCLC cells annotated by (B) treatment history and (C) tissue site. Inter-patient heterogeneity within each cell type as measured by Shannon entropy for (D) all samples and (E) treatment-naïve samples (Student’s t-test, error bars: 95% confidence intervals; STAR Methods). DC = dendritic cells, LN = lymph node, Chemo_1L = chemotherapy in first line, ChemoIO_1L = chemotherapy plus immunotherapy in first line, IO_2L = Immunotherapy in second line, later-line therapy = multiple lines of treatment. p-values: *<0.05, **<0.01, ***<0.001. (F) UMAP of SCLC cells colored by subtype (red = SCLC-A, green = SCLC-N, blue = SCLC-P), based on maximum likelihood computed by our classifier. Sample RU1108 is labeled as a TP53/RB1 wild-type SCLC-A outlier (STAR Methods). (G) UMAP of imputed expression of ASCL1, NEUROD1, POU2F3 and YAP1 in the SCLC cohort using MAGIC109 (k=30, t=3). Expression in units of log2(X+1) where X = normalized counts. (H) Ternary plot of SCLC subtype probability per cell, calculated by Markov absorption probabilities (STAR Methods). Cell color is assigned by the likelihood of SCLC-A (red), SCLC-N (green), and SCLC-P (blue). See also Figures S1–S2, and Table S1.
Figure 2:
Figure 2:. Gene programs and cell-cell interactions enriched in each SCLC subtype
(A) Dot plot showing selected DEGs between each SCLC subtype versus the rest, as well as between SCLC-A vs SCLC-N. DEGs are grouped by enriched gene pathways as assessed by GSEA (NES > 1, FDR < 0.1) (Tables S3–8). Dot size = % cells expressing gene; dot color = mean expression scaled from 0 to 1. (B) Scaled expression of canonical markers or scaled average Z-score of select enriched pathways in SCLC-N (Y-axis), versus SCLC subtype probability (X-axis). Solid lines represent average gene/pathway trend (STAR Methods). (C) Enrichment of interactions between cancer cells within SCLC-A vs SCLC-N. Significant interactions are assessed using CellPhoneDB102. Enrichment of interactions within SCLC-A vs SCLC-N is plotted as significance (−log2 of Fisher’s test) versus frequency. Dashed line corresponds to nominal p < 0.05. See also Figure S2 and Table S1.
Figure 3:
Figure 3:. A subpopulation with metastatic, stem-like phenotype recurs broadly across SCLC tumors.
(A) Boxplot of subtype uncertainty of each SCLC cell stratfied by cluster (Y-axis; measured as entropy of subtype probabilities per cell within each cluster; error bars span 25th to 75th percentile), ordered by recurrence across patients (X-axis; measured as Shannon entropy of patients per cluster; STAR Methods). (B) Stacked barplot of sample fraction per cluster, ordered by recurrence across patients, as in (A). (C) UMAP of SCLC cells with recurrent cluster 22 colored in black. (D) Proportion of samples comprising the recurrent cluster (9 of 21 profiled tumors harboring >3% of the cluster). The number of cells per sample are indicated in parentheses for samples with the greatest representation of the recurrent cluster. Outer rings indicate the major intratumoral subtype (outer), tissue site (middle), and treatment history (inner). (E) Gene programs significantly enriched in cluster 22. Barplot of NES from GSEA for significantly enriched pathway (FDR < 0.05 and NES > 1; Table S9). (F) Genes ordered from most to least recurrently overexpressed along the X-axis, with recurrence score plotted on the Y-axis. The recurrence score is calculated as follows. Within each sample, DEGs were assessed between the recurrent cluster vs the rest of the tumor. The adjusted p-values for differential expression within each tumor are combined using Edgington’s method. The recurrence score is the −log of the combined p-value (Table S11; STAR Methods). (G) Violin plot with PLCG2 expression among individual cancer cells in our SCLC samples, grouped by tissue site (Bonferroni-adjusted Mann-Whitney test). Expression is plotted as log2(X+1) where X is the normalized count, imputed using MAGIC (k=30, t=3). See also Figure S3 and Table S1.
Figure 4:
Figure 4:. A role for the PLCG2+ recurrent cluster in metastasis and patient outcome associated with PLCG2 expression
(A) Migration (top) and invasion (bottom) assays for PLCG2-overexpressing cell lines (SHP-77, H446, and H82) and PLCG2-CRISPR KO polyclonal (H526, DMS-114) cell lines, measured with a luminometric method in at least 3 independent experiments (3 technical replicates/experiment). Log2 fold change over control condition was calculated (two-tailed Student’s t-test; error bars: standard deviation). (B) Luminescence imaging of mice at day 31 following intracardiac injection to assess metastatic capacity of PLCG2-overexpressing SHP77 cells and PLCG2-KO polyclonal H526 cells. (C) Barplot showing the percentage of mice with metastasis in in vivo intracardiac injections of PLCG2-overexpressing SHP-77 and PLCG2-downregulated H526 cell lines in mice compared to control conditions (Fisher’s exact test). (D) Western blots of markers associated with signaling pathways upregulated in cluster 22 (Wnt and BMP pathways), EMT/metastasis, and stemness in PLCG2-overexpressing and -KO polyclonal cell lines. (E) Color overlay of PLCG2 (red), NEUROD1 (cyan), and dsDNA (violet) channels in SCLC tumor MIBI 1 from field of view (FoV) 2 (800 × 800 μm), illustrating high fraction of PLCG2-positive cancer cells. Error bars: 95% confidence interval. (F) Same FoV as (E) now visualized based on segmented cancer cells using Mesmer (Greenwald et al., 2021), represented by dots colored by PLCG2 positivity. Error bars: 95% confidence interval. (G) Scatterplot of the percent of PLCG2-positive SCLC cells per sample using MIBI-TOF vs overall survival (months) in an independent TMA cohort, annotated by percent of PLCG2+ SCLC cells >7% (cyan) and deceased patient (triangle). Spearman’s correlation r and example patient MIBI 1 from Figures 4E–F are shown. (H) Kaplan-Meier analysis of OS in an independent cohort of SCLC patients (Table S14) with high vs low PLCG2 positivity (>7% vs ≤7% of SCLC cells with high PLCG2 staining intensity), as assessed by MIBI-TOF on a TMA. Note that the adjusted Cox proportional hazards model using the fraction of PLCG2-positive SCLC cells as a continuous rather than dichotomized covariate was also significantly predictive (p = 0.012, STAR methods). (I) Scatterplot of the percent of the recurrent SCLC cluster per sample using scRNA-seq (log10 scale) vs overall survival (months), annotated by percent of recurrent cluster > 0.75% (cyan) and deceased patients (triangle). Spearman’s correlation r is indicated. (J) Kaplan-Meier analysis of OS in patients with detectable PLCG2+ recurrent cluster cells by scRNA-seq (>0.75% vs ≤0.75% of SCLC cells) (Table S16). Note that the adjusted Cox proportional hazards model using the fraction of the recurrent cluster as a continuous rather than dichotomized covariate was also significantly predictive (p = 0.009, STAR methods). PLCG2 = PLCG2 overexpression, sgPLCG2 = CRISPR knockout. See also Figure S1 and Tables S1, S14, and S16.
Figure 5:
Figure 5:. Analysis of therapy and subtype-specific changes in immune phenotype indicate suppressed T-cell activity in SCLC-N
(A) Comparison of MIBI images depicting NEUROD1− SCLC tumor MIBI 27 from FoV 2 (left) and NEUROD1+ SCLC tumor MIBI 16 from FoV 1 (right) (each FoV 800 × 800 μm), illustrating differences in immune abundance and sequestration. Top: Color overlay of NEUROD1 (red), CD3 (green), CD14 (white), CD68 (orange), CD163 (yellow), and dsDNA (violet) channels. Bottom: FoV from the top panel now visualized with segmented cancer cells using Mesmer(Greenwald et al., 2021), represented by dots colored by cell type (immune, tumor, and stroma). (B) Boxplot comparing the percent of immune out of total cells between NEUROD1− vs NEUROD1+ SCLC cells. The overlying swarmplot is colored by hot (red) vs cold (blue) where hot is defined as number of immune cells > 250 in an 800 × 800 μm FoV (N=33, Fisher’s exact test; error bars: 95% confidence intervals). (C) The probability distribution of the immune-tumor mixing score in SCLC vs TNBC, defined as the number of interactions between immune and cancer cells divided by the number of interactions between immune and non-cancer cells (N=47, Welch’s t-test). (D) UMAPs of SCLC immune subsets. Tconv = conventional T-cell; Treg = regulatory T-cell; Teff = effector T-cell; Tmem = memory T-cell; Tgd = γδ T-cell; Mono/Mφ = monocyte/macrophage; PMN = neutrophil; cDC = conventional dendritic cell; pDC = plasmacytoid dendritic cell. (E) Barplot comparing CD8+ Teff/Treg log ratio based on NMF cell loadings associated with T-cell phenotype in SCLC-A vs SCLC-N in our single-cell cohort (N=19), adjusted for treatment and tissue site (weighted t-test; error bars: 95% confidence interval). (F) Barplot comparing CD8+ T/Treg log ratio in NEUROD1− vs NEUROD1+ SCLC in an independent cohort with Vectra imaging (N=12; weighted t-test; error bars: 95% confidence interval). (G) Select Vectra imaging of NEUROD1− vs NEUROD1+ SCLC (2 samples each). Fluorescent markers include CD8 (cytotoxic T-cells), Foxp3 (Tregs), INSM1/CK7 (epithelial and cancer cells), and DAPI (DNA). CD8 (green) or Foxp3 (pink) positivity of segmented cells are shown. See also Figures S4–S5 and Tables S14, S17, and S18.
Figure 6:
Figure 6:. SCLC tumors are associated with a pro-fibrotic, immunosuppressive Mono/Mφ subset
(A) UMAP of SCLC myeloid cells (N=2,951 cells) annotated by myeloid cell type (left) and clusters within the SCLC compartment only (right). (B) Heatmap showing normalized mean expression of select markers from the IPF-associated profibrotic macrophage gene signature(Adams et al., 2020) (N=143 genes with log fold change > 0.3) per Mono/Mφ subsets. Expression is imputed using MAGIC (k=30, t=3) and scaled from 0 to 1 across clusters. Left barplot shows average z-scored gene expression across the entire gene signature per cluster. Clusters (rows) ordered by signature score. (C) UMAP of SCLC myeloid cells showing gene signature scores for IPF-associated pro-fibrotic macrophages (left) and monocytes (right). Scores are calculated by taking the average Z-score of imputed expression of a given gene set, taken from(Adams et al., 2020). (D) Heatmaps showing normalized mean imputed expression of IPF-associated pro-fibrotic macrophage (left) and monocytic (right) gene signatures(Adams et al., 2020) per SCLC Mono/Mφ cluster, as described in (B). (E) Boxplot showing the proportion of pro-fibrotic Mono/Mφ in each sample of the combined LUAD and SCLC myeloid compartment (combined myeloid cluster 6, which includes SCLC clusters 1 and 7) in different histologies for all samples (N=48) and treatment-naive samples (N=23). We also denote in the overlying swarmplot which samples are matched to the same patient (Mann-Whitney test; error bars: 95% confidence interval). p-values: *<0.05, **<0.01, ***<0.001. See also Figures S6–S7 and Tables S18–S19.
Figure 7:
Figure 7:. The recurrent PLCG2-high SCLC phenotype is associated with the pro-fibrotic, immunosuppressive Mono/Mφ subset and exhausted CD8+ T-cells
Heatmaps showing covariate-adjusted Spearman’s correlation of SCLC phenotypes with (A) Mono/Mφ subsets and (B) coarse immune cell types. Mono/Mφ in (A) are arranged along columns from low to high score for IPF-associated Mono/Mφ, as in Figure 6C. Treatment and tissue covariates were adjusted (STAR Methods). Tumor features in (A) are arranged by hierarchical clustering using Euclidean distance and average linkage. Tumor features in (B) follow the ordering in (A) for readability. p-values: *<0.05, **<0.01, ***<0.001. (C) Color overlay of SCLC tumor MIBI 12 at FoV 1 (500 × 500 μm) showing the co-occurrence of the PLCG2-positive SCLC cells and the putative profibrotic Mono/Mφ. Left: Channels dsDNA (violet), Vimentin (white), CD8 (yellow), CD31 (orange), CD68 (red), CD163 (red), and FOXP3 (cyan) illustrate the global tumor environment structure. Middle: Channels PLCG2 (red), CD56 (yellow), and NEUROD1 (cyan) identify PLCG2+ tumor. Right: Channels CD14 (orange), CD16 (cyan), and CD81 (magenta) identify the profibrotic Mono/Mφ. (D) FoV from the (C) now visualized with segmented cancer cells using Mesmer(Greenwald et al., 2021), represented by dots colored by PLCG2+ SCLC cells vs profibrotic Mono/Mφ. (E) Barplot of covariate-adjusted Spearman’s correlation between the percent of PLCG2+ SCLC cells and the fraction of different cell types/states in MIBI-TOF of an independent TMA cohort. The following covariates were adjusted: SCLC subtype (NEUROD1+/−), treated vs naive, combined vs single histology and distant metastasis vs primary (Student’s t-test; STAR Methods). PLCG2+ SCLC cells had the highest correlation with CD14+ CD16+ CD81+ Mono/Mφ, shown in blue (r=0.75, N=37, Bonferroni-adjusted p = 1 × 10⁻⁶; STAR methods). (F) Scatterplot of residuals for the fraction of CD14+ CD16+ CD81+ myeloid cells out of all myeloid cells (representing the profibrotic Mono/Mφ) vs the fraction of PLCG2+ SCLC cells out of all SCLC cells (representing the recurrent PLCG2-high SCLC phenotype). Residuals correspond to the partial correlation described in (E). Example patient MIBI 12 from Figures 7C is indicated.

Similar articles

Cited by

References

    1. Adams TS, Schupp JC, Poli S, Ayaub EA, Neumark N, Ahangari F, Chu SG, Raby BA, DeIuliis G, Januszyk M et al. (2020). Single-cell RNA-seq reveals ectopic and aberrant lung-resident cell populations in idiopathic pulmonary fibrosis. Sci. Adv. 6. - PMC - PubMed
    1. Aizarani N, Saviano A, Sagar Mailly L, Durand S, Herman JS, Pessaux P, Baumert TF, and Grün D (2019). A human liver cell atlas reveals heterogeneity and epithelial progenitors. Nature 572, 199–204. - PMC - PubMed
    1. Patel Anoop P,*1, 2, 3, 4 Itay Tirosh,*3 Trombetta John J., 3Alex K. Shalek, 3 Gillespie Shawn M., 2, 3, 4 Wakimoto Hiroaki, 1 Cahill Daniel P., 1 Nahed Brian V., 1 Curry William T., 1 Martuza Robert L., 1 Louis David N., 2 Rozenblatt-Rosen Orit, 3 Mari, 4†‡, and Human (2014). R es e a rc h | r e po r ts. Science (80-. ). 344, 1396–1402. - PMC - PubMed
    1. Azizi E, Carr AJ, Plitas G, Cornish AE, Konopacki C, Prabhakaran S, Nainys J, Wu K, Kiseliovas V, Setty M et al. (2018). Single-Cell Map of Diverse Immune Phenotypes in the Breast Tumor Microenvironment. Cell 174, 1293–1308.e36. - PMC - PubMed
    1. Bach DH, Park HJ, and Lee SK (2018). The Dual Role of Bone Morphogenetic Proteins in Cancer. Mol. Ther. - Oncolytics 8, 1–13. - PMC - PubMed

Publication types