. 2021 Nov 8;49(19):10879-10894.
doi: 10.1093/nar/gkab904.

Calling large indels in 1047 Arabidopsis with IndelEnsembler

Affiliations

Calling large indels in 1047 Arabidopsis with IndelEnsembler

Dong-Xu Liu et al. Nucleic Acids Res. .

Abstract

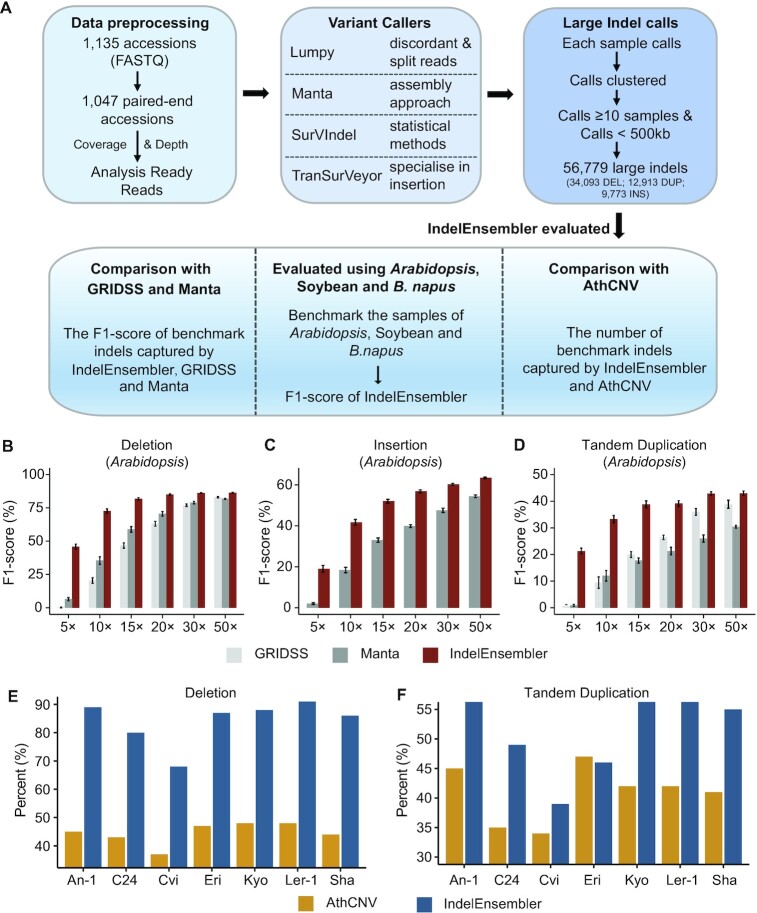
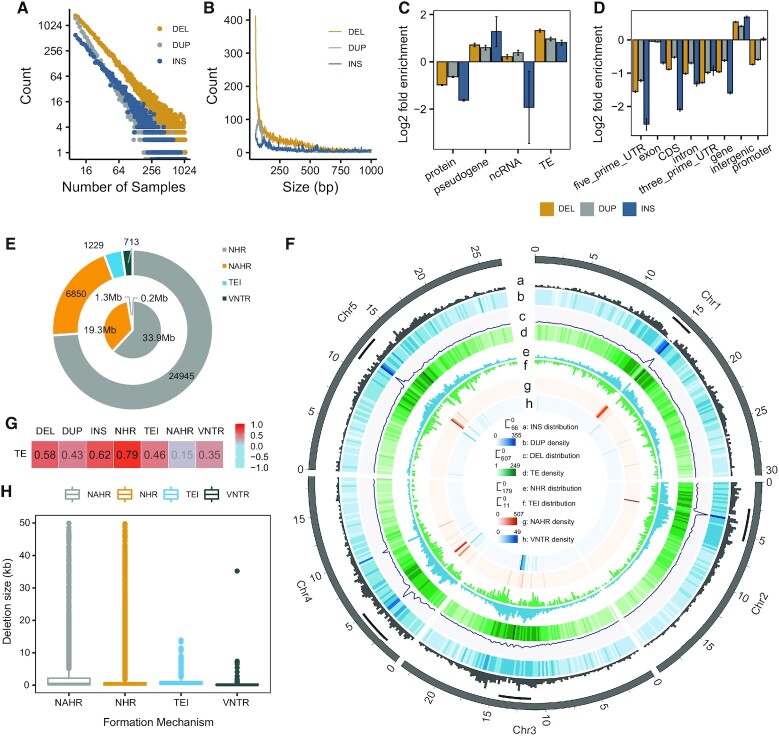
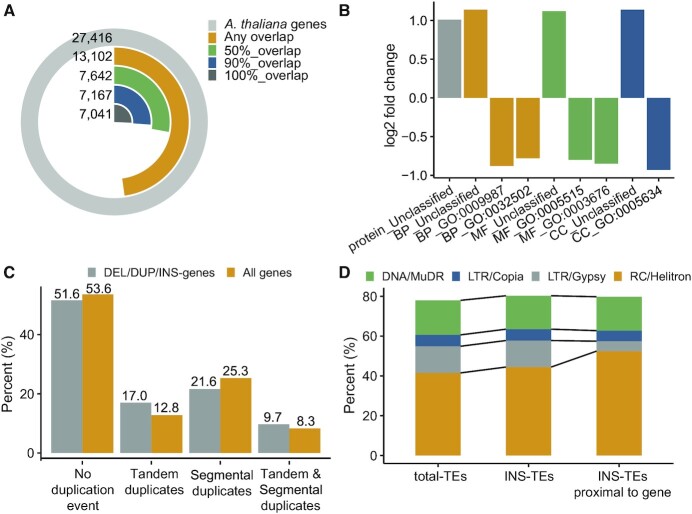
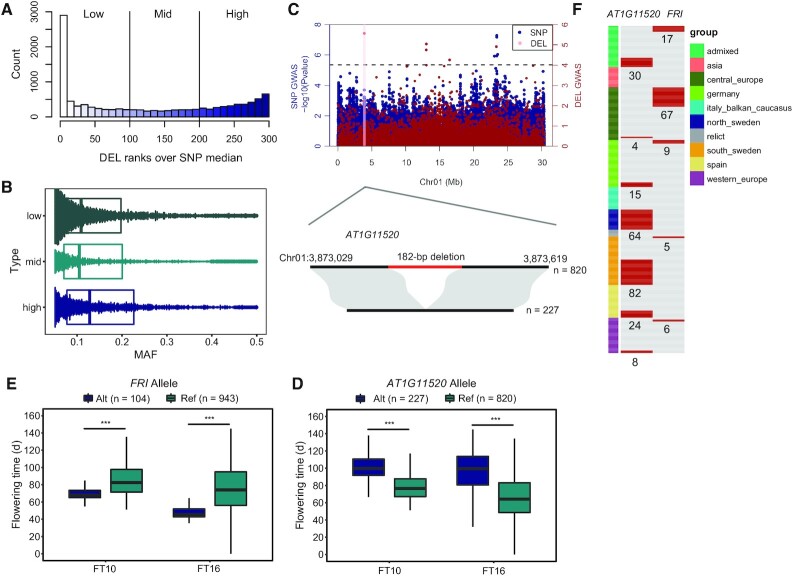
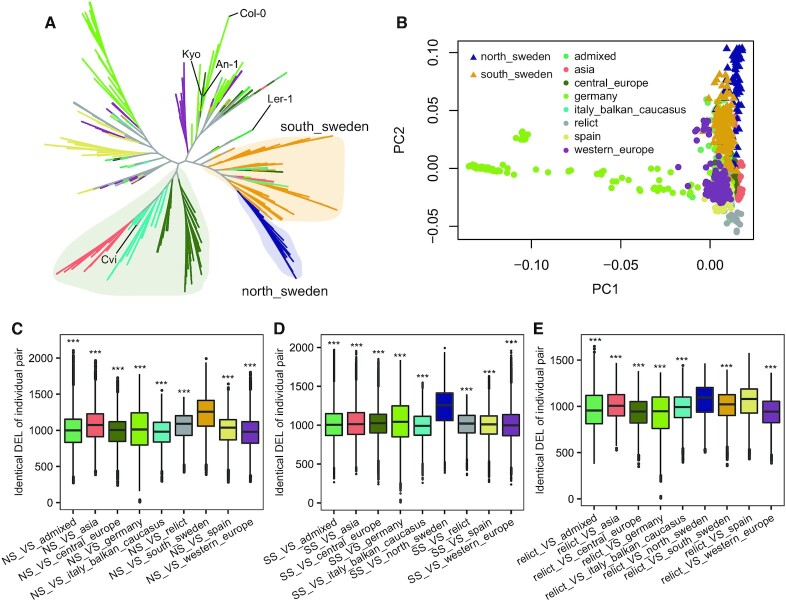
Large indels greatly impact the observable phenotypes in different organisms including plants and human. Hence, extracting large indels with high precision and sensitivity is important. Here, we developed IndelEnsembler to detect large indels in 1047 Arabidopsis whole-genome sequencing data. IndelEnsembler identified 34 093 deletions, 12 913 tandem duplications and 9773 insertions. Our large indel dataset was more comprehensive and accurate compared with the previous dataset of AthCNV (1). We captured nearly twice of the ground truth deletions and on average 27% more ground truth duplications compared with AthCNV, though our dataset has less number of large indels compared with AthCNV. Our large indels were positively correlated with transposon elements across the Arabidopsis genome. The non-homologous recombination events were the major formation mechanism of deletions in Arabidopsis genome. The Neighbor joining (NJ) tree constructed based on IndelEnsembler's deletions clearly divided the geographic subgroups of 1047 Arabidopsis. More importantly, our large indels represent a previously unassessed source of genetic variation. Approximately 49% of the deletions have low linkage disequilibrium (LD) with surrounding single nucleotide polymorphisms. Some of them could affect trait performance. For instance, using deletion-based genome-wide association study (DEL-GWAS), the accessions containing a 182-bp deletion in AT1G11520 had delayed flowering time and all accessions in north Sweden had the 182-bp deletion. We also found the accessions with 65-bp deletion in the first exon of AT4G00650 (FRI) flowered earlier than those without it. These two deletions cannot be detected in AthCNV and, interestingly, they do not co-occur in any Arabidopsis thaliana accession. By SNP-GWAS, surrounding SNPs of these two deletions do not correlate with flowering time. This example demonstrated that existing large indel datasets miss phenotypic variations and our large indel dataset filled in the gap.


Figures

Figure 1.
Figure 1.
Summary and Evaluation the performance of IndelEnsembler. (A) Large indel discovery pipeline IndelEnsembler in 1047 Arabidopsis. The software comparison of GRIDSS, Manta and IndelEnsembler in detecting deletions (B), insertions (C) and duplications (D) in Arabidopsis. (E) The percent of ground truth deletions captured by AthCNV and IndelEnsembler. (F) The percent of ground truth duplications captured by AthCNV and IndelEnsembler.
Figure 2.
Figure 2.
Large indels distribution and spatial distribution of deletions based on the different formation mechanisms. (A) Frequency spectrum of deletions (yellow) duplications (grey) and insertions (blue) amongst 1047 Arabidopsis thaliana accessions. (B) Size distribution of large indels in our discovery set. (C) Enrichment/depletion of large indels in various gene types. (D) Enrichment/depletion of large indels in various genomic regions. (E) Distribution of different DEL formation mechanisms. Outer circle represents number of DELs per mechanism. Inner circle represents cumulative genomic size of these events. (F) Tracks (outer to inner circles) indicate the following: a–d, insertions, duplications, deletions and transposable elements (TEs) per 200 kb (red color indicates more); e–h, deletions per 200 kb per mechanism (NHR, TEI, NAHR, VNTR), range max: 179, 11, 507, 49. (G) Pearson's correlation of deletion, duplication, insertion and four mechanism with TEs. Pearson's correlation coefficients (r) of DEL, DUP, INS, NHR, TEI, NAHR and VNTR with TE were 0.58, 0.43, 0.79, 0.46, 0.15, 0.35, respectively; P< 2.2 × 10–16, P< 2.2 × 10–16, P< 2.2 × 10–16, P< 2.2 × 10–16, P= 6.6 × 10–16, P= 1.6 × 10–5, P= 5.7 × 10–14, respectively. (H) Sizes of deletions formed by different mechanisms.
Figure 3.
Figure 3.
Genomic Content in Regions Overlapped by DEL/DUP/INSs. (A) Fractions of annotated Arabidopsis genes with various degrees of overlap with DEL/DUP/INSs. (B) Over- and underrepresented protein types and GO terms among the DEL/DUP/INS-genes. All terms are either significantly enriched or depleted (binomial test with Bonferroni-corrected P-value < 0.05). (GO:0009987: cellular process; GO:0032502: developmental process; GO:0005515: protein binding; GO:0003676: nucleic acid binding; GO:0005634: nucleus). (C) Percentages of DEL/DUP/INS-genes and all genes that are overlapped with tandem duplicated and/or segmental duplicated regions. (D) Repeat families composition for all Arabidopsis TEs, all INS-TEs and all gene-proximal INS-TEs (located within ±2 kb distance).
Figure 4.
Figure 4.
Links between genes and TEs variation and localization. (A) Distances of proximal TEs around DEL-genes. (B) Distances of proximal TEs around DUP-genes. (C) Distances of proximal TEs around INS-genes. For each gene, a proximal TE was defined as each TE that overlaps with this gene (distance = 0) or locate within 2 kb upstream from the gene's 5' untranslated region (distance < 0) or locate within 2 kb downstream from 3' untranslated region (distance > 0). (D) Distance between gene and centromere for every gene-TE pair classified by variation status (Wilcoxon rank sum test with continuity correction for the difference between DEL-DEL and DEL-NONDEL groups, P-value < 2.2e–16). (E) Distance between gene and centromere for every gene-TE pairs classified by variation status (Wilcoxon rank sum test with continuity correction for the difference between INS-INS and INS-NONINS groups, P-value < 2.2e-16). (F) Distance between gene and centromere for every gene-TE pairs by variation status (Wilcoxon rank sum test with continuity correction for the difference between DUP-DUP and DUP-NONDUP groups, P-value > 0.05). Boxplots in (D), (E) and (F) show median (inner line) and inner quartiles (box). Whiskers extend to the highest and lowest values no greater than 1.5 times the inner quartile range.
Figure 5.
Figure 5.
An overview of significant deletions. (A) Histogram of the relative LD metrices for common DELs. (B) Boxplots showing distribution of minor allele frequencies for each LD category. (C) Top, Manhattan plot of SNPs (with ∼12.9 million SNPs obtained from 1001 Genomes) and DELs genome-wide association studies for flowering time under 16°C. The red line represents the candidate gene AT1G11520 on Chromosome 1. Bottom, A 182-bp deletion that present in 227 Arabidopsis thaliana accessions and not present in 820 Arabidopsis thaliana accessions. (D) The boxplots that show the flowering time of accessions with different AT1G11520 alleles. (E) The boxplots that show the flowering time of accessions with different AT4G00650 (FRI) alleles (*** P< 0.001, P values were determined using two-tailed Student's t-tests). (F) The distribution of individuals with deletions in AT1G11520 and AT4G00650 (FRI). Different geographic groups are represented by different color. The numbers below the red bars indicate the number of accessions with the corresponding deletions.
Figure 6.
Figure 6.
Neighbor-joining cluster analysis of deletions in 1047 Arabidopsis thaliana. (A) The NJ tree is constructed based on deletions of 1047 Arabidopsis thaliana accessions. Different colors on the NJ tree correspond different groups. The group of north Sweden, south Sweden, Asia, Italy-Balkan-Caucasus and central Europe were shaded. Reference genome Col-0 and 4 accessions used for evaluating the performance of IndelEnsembler were marked. (B) The PCA plot of deletions of 1047 Arabidopsis thaliana. (C) Boxplots that show the number of shared DELs between accessions of north Sweden and accessions of all other groups (differences between north Sweden versus south Sweden relative to north Sweden with other groups were statistically analyzed based on two-tailed Student's t-tests, *** P-value < 0.001). (D) Boxplots that show the number of shared DELs between accessions of south Sweden and accessions of all other groups. (Differences between south Sweden versus north Sweden relative to south Sweden with other groups were statistically analyzed based on two-tailed Student's t-tests, *** P-value < 0.001). (E) Boxplots that show the number of shared DELs between accessions of relict and accessions of all other groups. (Differences between relict versus north Sweden relative to relict with other groups were statistically analyzed based on two-tailed Student's t-tests; Differences between relict versus spain relative to relict with other groups were statistically analyzed based on two-tailed Student's t-tests, *** P-value < 0.001).

Similar articles

Cited by

References

    1. Zmienko A., Marszalek-Zenczak M., Wojciechowski P., Samelak-Czajka A., Luczak M., Kozlowski P., Karlowski W.M., Figlerowicz M.. AthCNV: a map of DNA copy number variations in the Arabidopsis genome. Plant Cell. 2020; 32:1797–1819. - PMC - PubMed
    1. Fang L., Wang Q., Hu Y., Jia Y., Chen J., Liu B., Zhang Z., Guan X., Chen S., Zhou B.et al. .. Genomic analyses in cotton identify signatures of selection and loci associated with fiber quality and yield traits. Nat. Genet. 2017; 49:1089–1098. - PubMed
    1. Wu D., Liang Z., Yan T., Xu Y., Xuan L., Tang J., Zhou G., Lohwasser U., Hua S., Wang H.et al. .. Whole-genome resequencing of a worldwide collection of rapeseed accessions reveals the genetic basis of ecotype divergence. Molecular plant. 2019; 12:30–43. - PubMed
    1. Springer N.M., Ying K., Fu Y., Ji T., Yeh C.T., Jia Y., Wu W., Richmond T., Kitzman J., Rosenbaum H.et al. .. Maize inbreds exhibit high levels of copy number variation (CNV) and presence/absence variation (PAV) in genome content. PLoS Genet. 2009; 5:e1000734. - PMC - PubMed
    1. Saxena R.K., Edwards D., Varshney R.K.. Structural variations in plant genomes. Brief. Funct. Genomics. 2014; 13:296–307. - PMC - PubMed

Publication types

MeSH terms

Substances