. 2021 Oct 12;12(1):5929.
doi: 10.1038/s41467-021-25287-y.

Thousands of Qatari genomes inform human migration history and improve imputation of Arab haplotypes

Collaborators, Affiliations

Thousands of Qatari genomes inform human migration history and improve imputation of Arab haplotypes

Rozaimi Mohamad Razali et al. Nat Commun. .

Abstract

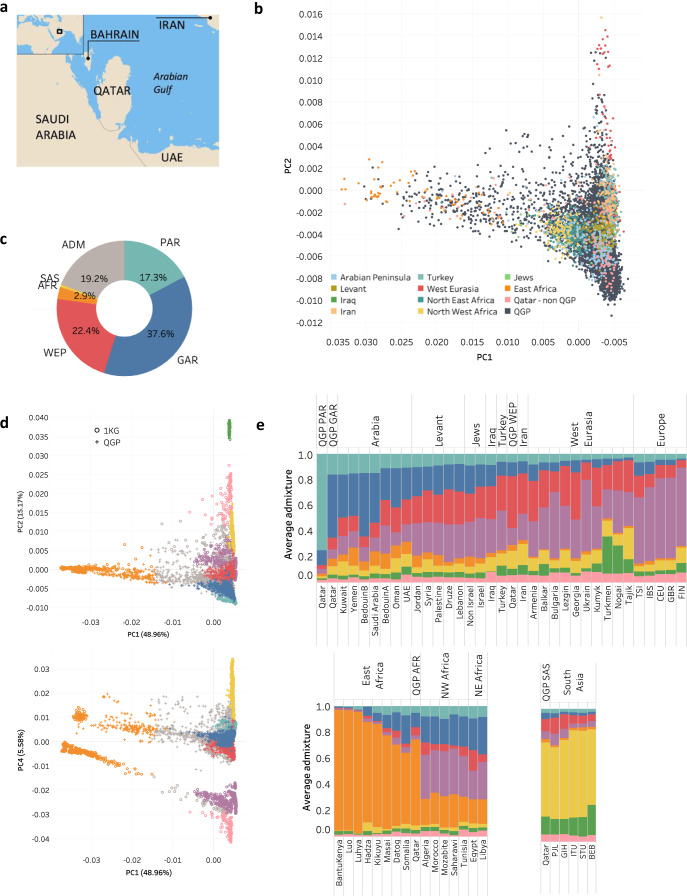
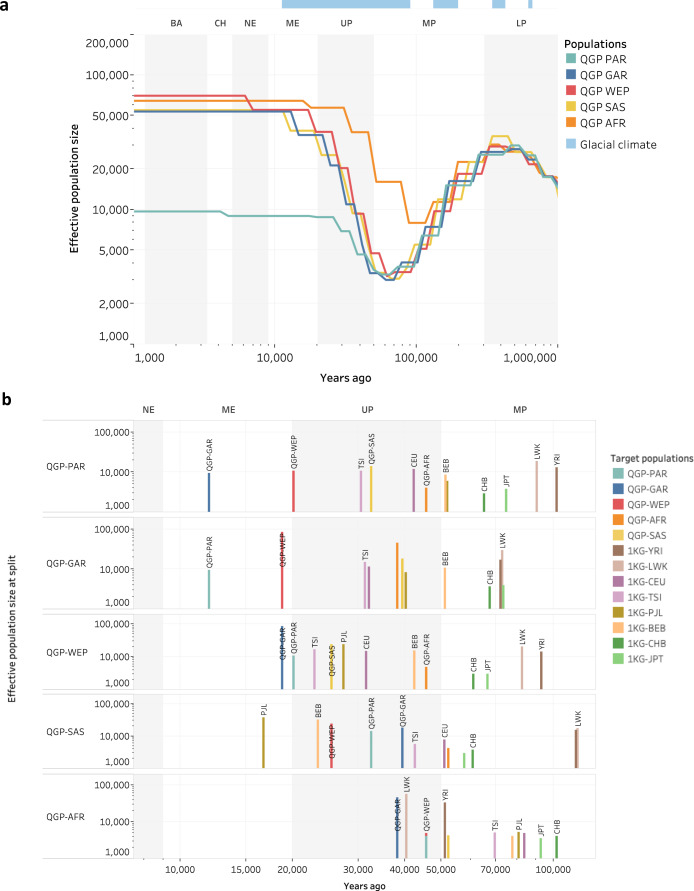
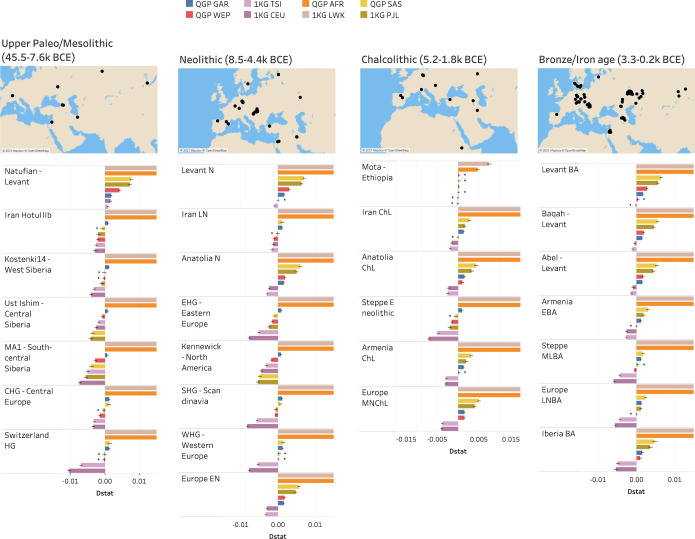
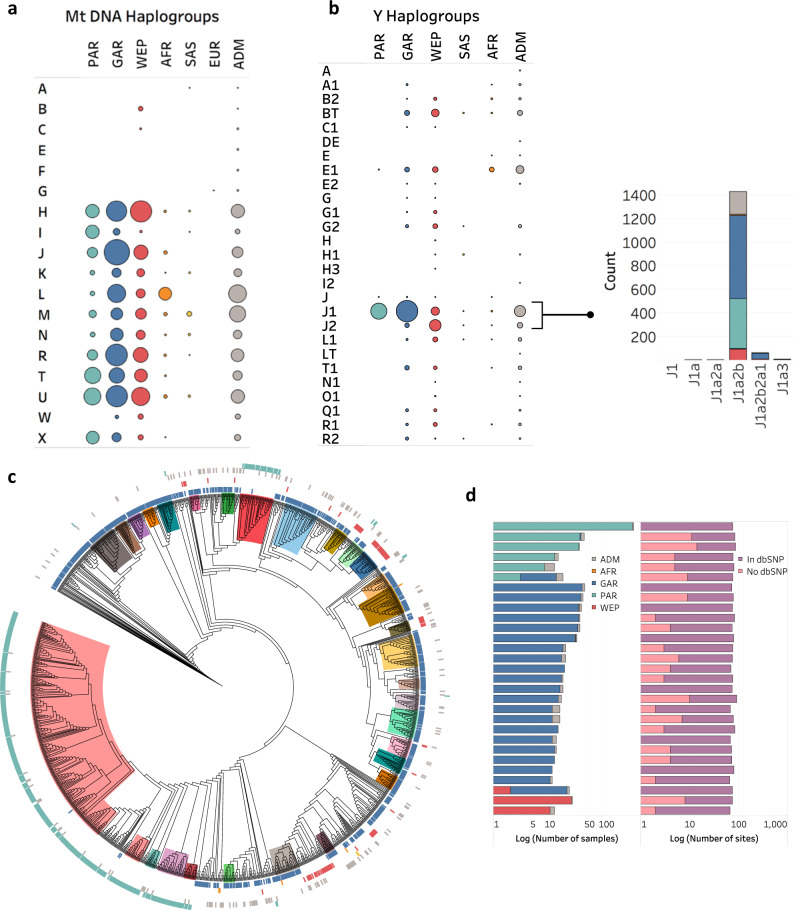
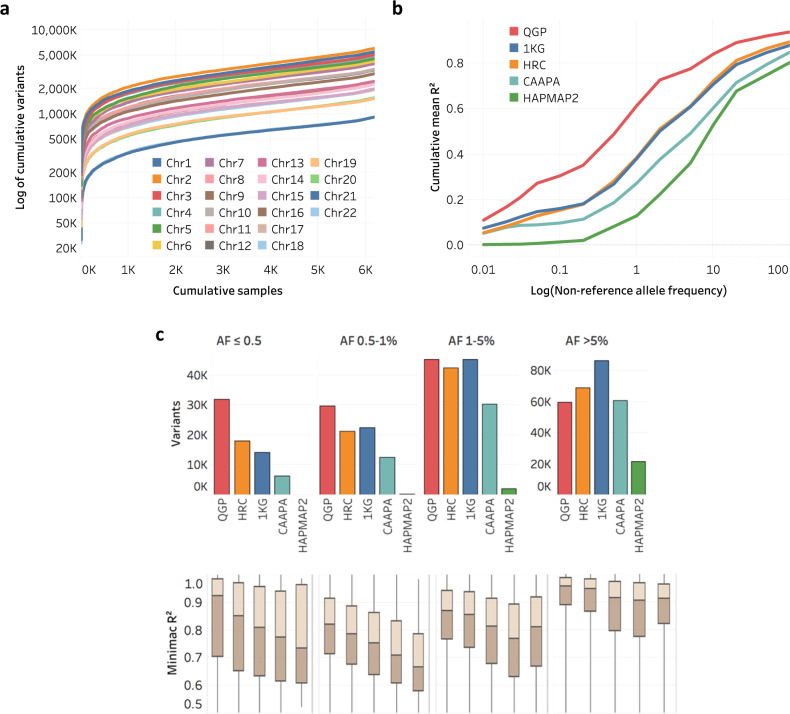
Arab populations are largely understudied, notably their genetic structure and history. Here we present an in-depth analysis of 6,218 whole genomes from Qatar, revealing extensive diversity as well as genetic ancestries representing the main founding Arab genealogical lineages of Qahtanite (Peninsular Arabs) and Adnanite (General Arabs and West Eurasian Arabs). We find that Peninsular Arabs are the closest relatives of ancient hunter-gatherers and Neolithic farmers from the Levant, and that founder Arab populations experienced multiple splitting events 12-20 kya, consistent with the aridification of Arabia and farming in the Levant, giving rise to settler and nomadic communities. In terms of recent genetic flow, we show that these ancestries contributed significantly to European, South Asian as well as South American populations, likely as a result of Islamic expansion over the past 1400 years. Notably, we characterize a large cohort of men with the ChrY J1a2b haplogroup (n = 1,491), identifying 29 unique sub-haplogroups. Finally, we leverage genotype novelty to build a reference panel of 12,432 haplotypes, demonstrating improved genotype imputation for both rare and common alleles in Arabs and the wider Middle East.


Conflict of interest statement

The authors declare no competing interests.

Figures

Fig. 1
Fig. 1. Genetic structure of the QGP population.
a Map showing the geographical location of Qatar, source of the study population. b Principal Component Analysis plot showing overlap of Qatar Genome Program (QGP) subjects with populations from the wider Middle Eastern region found in the Human Origin, Greater Middle East and other public datasets. QGP samples are shown in black and other reference populations in various colors. c Genetic sub-groups of the Qatari population based on dominant ancestral fraction (≥0.5) and k = 8. The abbreviations refer to Peninsular Arabs (PAR), General Arabs (GAR), Arabs of West Eurasia and Persia (WEP), South Asian Arabs (SAS), African Arabs (AFR), Admixed Arabs (ADM). d PCA showing QGP sub-groups in the context of continental populations form Africa, Europe, South Asia, East Asia and America. e Average ancestry fractions for QGP and other world populations (k = 8). The three sub-panels highlight various reference populations as relevant to the QGP subpopulations. Colors in panels (ce) are the same as those used to delineate the distinct ancestral fractions in ADMIXTURE. Abbreviations of the 1KG subpopulations are: BEB Bengali from Bangladesh, CEU Utah Residents (CEPH) with Northern and Western European Ancestry, FIN Finnish in Finland, GBR British in England and Scotland, GIH Gujarati Indian from Houston, Texas, IBS Iberian Population in Spain, ITU Indian Telugu from the UK, PJL Punjabi from Lahore, STU Sri Lankan Tamil from the UK, TSI Toscani in Italy. Source data are provided as a Source Data file.
Fig. 2
Fig. 2. Contribution of Arab populations to various modern continental populations and vice versa.
Large headers show populations from QGP (top) and 1KG (bottom) which are a significant target for admixture by other populations from the combined datasets. For each target population, a network is depicted for the underlying pairs of donor populations with a significant F3 statistic (Z < -3). Edge thickness is proportional to absolute Z score and circle size is proportional to the number of connecting edges. Edge length is arbitrary. QGP subpopulations are labeled with an underscore. Abbreviations of 1KG populations are explained in Supplementary Table 2. Source data are provided as a Source Data file.
Fig. 3
Fig. 3. Demographic history of the QGP subpopulations.
a Effective population size over time, inferred using SMC++. b Estimated split times for each Qatari subpopulation relative to other Qatari and representative populations from Africa, Europe and South Asia and East Asia, indicating the ancestral population size at the time of split. Archeological periods are highlighted with alternating gray and white backgrounds and labeled as LP (Lower Paleolithic), MP (Middle Paleolithic), UP (Upper Paleolithic), ME (Mesolithic), Neolithic (NE), Chalcolithic (CL), Bronze Age (BA). Glacial periods are indicated horizontally on the top. Abbreviations of 1KG populations are explained in Supplementary Table 2. Source data are provided as a Source Data file.
Fig. 4
Fig. 4. Shared ancestry with ancient human populations from various archeological periods.
Bar plots showing D-statistic for the contribution of various ancient human genomes to PAR ancestry relative to other QGP and world populations, inferred with Patterson’s D-statistic (Dstat). Results are grouped by archeological periods. The maps show the geographical locations of the corresponding ancient genomes. The dates refer to estimated time range of the ancient genomes (Dates for individual genomes are found in Supplementary Material). D-statistics values with low absolute Z score (<3) are highlighted with *. Black lines at the end of bars indicate 95% confidence intervals. Negative D-statistic value imply higher introgression with PAR relative to other tested populations while positive values imply the opposite. For clarity, bars for QGP AFR and 1KG LWK are shown up to 0.01 (They extend to maxima of 0.03 and 0.05 respectively). Numbers of samples used for QGP are AFR n = 179, GAR n = 2338, SAS n = 40, WEP n = 1390 and for 1KG are CEU n = 99, LWK n = 99, PJL n = 96, TSI n = 107. Abbreviations of 1KG populations are explained in Supplementary Table 2. Source data are provided as a Source Data file.
Fig. 5
Fig. 5. Runs of homozygosity and relatedness in QGP in the context of world populations.
a Distribution of inbreeding coefficient (F) in QGP and reference world populations. b Distribution of ROH segments ordered and colored by size class, highlighting a shift in ROH class boundaries towards longer ROH for medium and long classes for the QGP subpopulations in comparison to the 1KG populations. c Cumulative size of short, medium and long ROH segments across individual samples based on Gaussian mixture model clustering highlighting considerably more samples enriched for long ROH in QGP PAR, GAR and WEP subpopulations. Populations are sorted by ascending median of cumulative medium ROH. d Count of OMIM genes that completely overlap with ROH per population. Populations are ordered as in a. Numbers of samples used for QGP are AFR n = 179, GAR n = 2338, PAR n = 1073, SAS n = 40, WEP n = 1390 and for 1KG are BEB n = 86, CEU n = 99, CHB n = 103, JPT n = 104, LWK n = 99, PEL n = 85, PJL n = 96, PUR n = 104, TSI n = 107, YRI n = 108. Boxes indicate median and middle two quartiles of the data. Whiskers indicate data 1.5 times the interquartile range. Abbreviations of 1KG populations are explained in Supplementary Table 2. Source data are provided as a Source Data file.
Fig. 6
Fig. 6. Chr Y and mtDNA haplogroups of QGP samples.
a mtDNA haplogroup and b Chr Y assignments in the various QGP subpopulations. Number of samples is indicated by circle size. Inset shows breakdown for J1 clade. c Maximum likelihood tree for samples assign ed to J1a2b Y haplogroup (bootstrap > 90%). Clusters are defined at genetic distance cutoff 5 × 10−4. Outer circles indicate autosomal ancestries (QGP subpopulations) and are colored accordingly. Clusters inside the tree are colored independently based on the identified 29 unique sub-haplogroups. d Partitioning of the 29 sub-haplogroups amongst autosomal ancestries and numbers of underlying SNVs indicating presence in dbSNP build 151. Source data are provided as a Source Data file.
Fig. 7
Fig. 7. Imputation using QGP versus other publicly available reference panels.
a Cumulative variants (log of SNV count) discovered in the QGP phase 1 dataset as a function of cohort size. b Imputation performance of QGP panel versus panels of HRC, 1KG, CAAPA and HAPMAP2(https://imputationserver.readthedocs.io/en/latest/reference-panels). Shown is imputation accuracy measured by cumulative mean R2 when imputing SNP genotypes into 105 independent Qatari samples as a function of logarithm of non-reference allele frequency of imputed SNPs. The results are based on genotypes on Affymetrix 6 array as a pseudo-array data. c Number of imputed variants using various panels per category of predicted minor allele frequency (top) and respective distribution of high quality Minimac R2 scores (>0.5) (bottom). Number of samples tested is n = 105. Boxes indicate median and middle two quartiles of the data. Whiskers indicate the range of the data. Source data are provided as a Source Data file.

Similar articles

Cited by

References

    1. Hellenthal G. A genetic atlas of human admixture history. Science. 2014;343:747–751. doi: 10.1126/science.1243518. - DOI - PMC - PubMed
    1. Arauna LR, et al. Recent historical migrations have shaped the gene pool of Arabs and Berbers in North Africa. Mol. Biol. Evol. 2017;34:318–329. - PMC - PubMed
    1. Al-Gazali L, Hamamy H, Al-Arrayad S. Genetic disorders in the Arab world. Br. Med. J. 2006;333:831–834. doi: 10.1136/bmj.38982.704931.AE. - DOI - PMC - PubMed
    1. Anwar WA, Khyatti M, Hemminki K. Consanguinity and genetic diseases in North Africa and immigrants to Europe. Eur. J. Public Health. 2014;24:57–63. doi: 10.1093/eurpub/cku104. - DOI - PubMed
    1. Rodriguez-Flores JL, et al. Exome sequencing identifies potential risk variants for Mendelian disorders at high prevalence in Qatar. Hum. Mutat. 2014;35:105–116. doi: 10.1002/humu.22460. - DOI - PMC - PubMed

Publication types

MeSH terms

Substances