. 2021 Oct 8;22(19):10885.
doi: 10.3390/ijms221910885.

Molecular Imaging of Human Skeletal Myoblasts (huSKM) in Mouse Post-Infarction Myocardium

Affiliations

Molecular Imaging of Human Skeletal Myoblasts (huSKM) in Mouse Post-Infarction Myocardium

Katarzyna Fiedorowicz et al. Int J Mol Sci. .

Abstract

Current treatment protocols for myocardial infarction improve the outcome of disease to some extent but do not provide the clue for full regeneration of the heart tissues. An increasing body of evidence has shown that transplantation of cells may lead to some organ recovery. However, the optimal stem cell population has not been yet identified. We would like to propose a novel pro-regenerative treatment for post-infarction heart based on the combination of human skeletal myoblasts (huSkM) and mesenchymal stem cells (MSCs). huSkM native or overexpressing gene coding for Cx43 (huSKMCx43) alone or combined with MSCs were delivered in four cellular therapeutic variants into the healthy and post-infarction heart of mice while using molecular reporter probes. Single-Photon Emission Computed Tomography/Computed Tomography (SPECT/CT) performed right after cell delivery and 24 h later revealed a trend towards an increase in the isotopic uptake in the post-infarction group of animals treated by a combination of huSkMCx43 with MSC. Bioluminescent imaging (BLI) showed the highest increase in firefly luciferase (fluc) signal intensity in post-infarction heart treated with combination of huSkM and MSCs vs. huSkM alone (p < 0.0001). In healthy myocardium, however, nanoluciferase signal (nanoluc) intensity varied markedly between animals treated with stem cell populations either alone or in combinations with the tendency to be simply decreased. Therefore, our observations seem to show that MSCs supported viability, engraftment, and even proliferation of huSkM in the post-infarction heart.

Keywords: Bioluminescent Imaging; Magnetic Resonance Imaging; Single-Photon Emission Computed Tomography/Computed Tomography; human skeletal myoblasts; mesenchymal stem cells; promoter reporter gene; technetium.


Conflict of interest statement

The authors declare no conflict of interest.

Figures
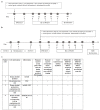
Figure 1
Figure 1
Scheme of experimental design of in vivo animal experiments. (a). Procedure 1 was performed in NOD/SCID mice with the healthy heart. On day 0, immunocompromised mice were divided into 4 subgroups based on the cell intervention. Four different combinations of cells were transplanted into the healthy mouse heart at day 1. 1. huSkM- human skeletal myoblasts, 2. MSC- mesenchymal stem cells 3. huSkM + MSC- human skeletal myoblasts in combination with mesenchymal stem cells, 4. huSkMCx43+MSC- human skeletal myoblasts overexpressing Cx43 in combination with mesenchymal stem cells. SPECT/CT was performed immediately after the transplantation and 24 h later Then, the biodistribution of transplanted cells was observed using a bioluminescent imaging system (BLI) for 6 weeks (day 14,21,28,35,42). On day 49, the animals were terminated. (b). According to Procedure 2, initial control echocardiography (ECHO I) was performed prior to the in vivo experimental series, and myocardial infarction (MI) was induced by left coronary artery ligation on day 0. Seventeen days later, a second echocardiography (ECHO II) confirming successful MI induction was performed. On day 23, cell intervention was performed in the same four combinations as described for Procedure 1. SPECT/CT was performed immediately after the transplantation and 24 h later. The retention of the cells in the myocardium was observed using a BLI system up to 10 weeks (day 37, 44,51,58,65). On day 70, MRI imaging was performed, and the animals were terminated. Untreated animals (infarction) were used as the controls, and PET/CT and MRI were performed in this group for comparison. (c). Table indicates stem cells modifications that were introduced prior to their in vivo transplantation. In order to image huSkM and MSCs concomitantly using BLI, each cell type was transduced with different lentiviral promoter reporter systems. huSkM cells were transduced with MSCV-fluc-GFP, where constitutive expression of MSCV promoter controls the expression of firefly luciferase (fluc) and green fluorescent protein (GFP). MSC cells were transduced with EF1-mkate-nanoluc, where constitutive expression of EF1 (Elongation Factor1) controls the expression of red fluorescence (mkate) and nanoluciferase (nanoluc). In one of the transplanted cells combinations (huSkMCx43+MSC), in order to enhance expression of connexin 43, huSkM cells were transfected with pCiNeo plasmid containing sequence for Cx43 by electroporation. Finally, to image huSkM cells (in all transplant variants) and MSC (when transplanted alone) right after delivery (and 24 h later) using SPECT/CT technique, cells were labelled with [99mTc]Tc-HMPAO.
Figure 2
Figure 2
Characteristics of huSkM and evaluation of the efficiency of huSkM transduction with MSCV-fluc-GFP reporter vector. (a). Flow cytometry detected approximately 90% of CD56+ huSkM cells in the isolated skeletal muscle population. (b). Isotype control was performed in parallel (IgG1-PC5). (c). Immunofluorescence of huSkM stained with an anti-desmin antibody (green) and nuclear dye DAPI (blue), scale bar = 50 μm. (d). Immunofluorescence of huSkM stained with an anti-α-MHC (myosin heavy chain) antibody (green) and nuclear dye DAPI (blue), scale bar = 50 μm. (e). Multinuclear tube formation test confirmed the ability of the cells to differentiate in vitro, scale bar = 50 μm. (f). huSkM transduced with MSCV-fluc-GFP-lentiviral reporter vector vs. negative control cells. (g). Firefly luciferase luminescence activity measured in transduced cells (huSkM MSCV-fluc-GFP) vs. negative control cells (huSkM WT) in triplicate, *** p > 0.001. (h). MSCV-GFP-luc insert copy number in huSkM cells (7.5 copies) vs. untransduced control (huSkM WT) relative to albumin, *** p < 0.003. (i). Relative expression of the gene encoding for Cx43 in pCiNeo-CX43-transfected huSkM 48 h after the transfection vs. untransfected cells, *** p < 0.001. (j). Overexpression of Cx43 protein in pCiNeo-CX43-transfected huSkM vs. untransfected cells 48 h after the transfection. ACTB was used as a loading control.
Figure 3
Figure 3
Mesenchymal stem cells characteristics. (a). Cells stained positively for-CD73, (b). CD90 (c). CD 105 and (d). negatively for CD 45, nuclear dye DAPI (blue), scale bar = 100 μm. (e). Staining of MSC with eosin and hematoxylin. Multipotent character of the cells shown as the ability to differentiate into osteoblasts, chondrocytes and adipocytes was confirmed with (f). Alcian red, (g). Alizarin blue and (h). Oil red staining, respectively, scale bar = 50 μm. (i,j). in vitro imaging of mesenchymal cells transduced with EF-1-mkate-nanoluc lentiviral promoter reporter system vs. (k,l). Non transduced cells–WT. (m). Luminescence intensity of EF-1-mkate-nanoluc-transduced mesenchymal stem cells vs. untransduced controls (WT); measurements were performed in triplicate, *** p < 0.001. (n). EF1-mkate-nanoluc insert copy number in MSC cells (6.4 copies) vs. untransduced control (MSC WT) relative to albumin, *** p < 0.0001.
Figure 4
Figure 4
Haemodynamic parameters of cardiac function with respect to induced myocardial infarction (MI). (a) Echocardiography performed 17 days after MI induction revealed a significant decrease in % SAX (area of change in short axis) compared to that in the control mice prior to MI (n = 40, data are presented as the mean ± SD, ** p < 0.01, t-student test); (b) Representative images of [18F]-FDG PET/CT scan of a control normal heart; (c) Representative images of [18F]-FDG PET/CT scan of post-infarction heart; (d) Conversion of PET images to maps of radiotracer activity in the MI heart and their (e) counterparts presented as polar maps.
Figure 5
Figure 5
(a). 3D SPECT/CT images of various cell combinations labelled with [99mTc]Tc-HMPAO administered intramyocardially. Images were acquired at 0 min and after 23 ± 1 h. (b). The efficiency of the colonization of stem cells (huSkM, MSC, huSkM + MSC, huSkMCx43 + MSC) labelled with [99mTc]Tc-HMPAO at 24 h in post-infarction mice (healthy hearts: huSkM n = 7, MSC n = 8, huSkM + MSC n = 4, huSkMCx43+MSC n = 4; post-infarction hearts huSkM n = 8, MSC n = 3, huSkM + MSC n = 8, huSkMCx43+MSC n = 8). Data are presented as the mean ± SD (* p < 0.05, Mann-Whitney U test).
Figure 6
Figure 6
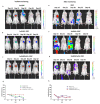
In vivo long-term monitoring of intramyocardially transplanted cells in a healthy mouse model (heart) determined by bioluminescence imaging. Images were taken on days 14, 21, 28, 35 and 42 after their delivery to the normal physiological heart. Each image is displayed on a rainbow scale in units of photon radiance (s–1 cm–2 sr–1) and overlaid onto a greyscale reference image of the corresponding mouse. Representative images of firefly luciferase luminescence intensity of huSkM transduced with MSCV-fluc-GFP reporter vector in (a). huSkM, (b). huSkM + MSC and (c). huSkMCx43 + MSC. (d). The percentage (%) of firefly luciferase luminescence signal intensity in huSkM transduced with MSCV-fluc-GFP reporter vector on days 14, 21, 28, 35 and 42 after the intervention (healthy heart) plotted for huSkM (n = 3), huSkM + MSC (n = 3), and huSkMCx43+MSC (n = 3) (one-way Anova test followed by Tukey’s multiple comparison test). Representative images of nanoluciferase luminescence intensity in MSCs transduced with EF-1-mkate-nanoluc reporter vector in (e). MSC, (f). huSkM + MSC and (g). huSkMCx43 + MSC. (h) The percentage (%) of nanoluciferase signal intensity in MSC EF1-mkate-nanoluc reporter vector on days 14, 21, 28, 35 and 42 after the intervention (healthy heart) plotted for MSC, huSkM + MSC, and huSkMCx43 + MSC (one-way Anova test followed by Tukey’s multiple comparison test).
Figure 7
Figure 7
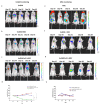
In vivo long-term monitoring of stem cells intramyocardially transplanted into a post-infarction mouse heart determined by bioluminescence imaging. Images were acquired on days 37, 44, 51, 58 and 65 of the experiment. Each image is displayed on a rainbow scale in units of photon radiance (s–1 cm–2 sr–1) and overlaid onto a greyscale reference image of the corresponding mouse. Representative images of firefly luciferase luminescence intensity in (a). huSkM, (b). huSkM + MSC and (c). huSkMCx43 + MSC. (d). The percentage (%) of firefly luciferase luminescence signal intensity in huSkM transduced with MSCV-fluc-GFP reporter vector on days 37, 44, 51, 58 and 65 of the experiment (post-infarction heart) plotted for huSkM (n = 3), huSkM+MSC (n = 8) and huSkMCx43+MSC (n = 4), (**** p < 0.0001, one-way Anova test followed by Tukey’s multiple comparison test). Representative images of nanoluciferase luminescence intensity in MSCs transduced with EF-1-mkate-nanoluc reporter vector in (e). MSCs, (f). huSkM + MSC and (g). huSkMCx43+MSC. (h). The percentage (%) of nanoluciferase signal intensity in MSCs transduced with EF1-mkate-nanoluc reporter vector on days 37, 44, 51, 58 and 65 of the experiment (post-infarction hearts) plotted for MSCs (n = 3), huSkM+MSC (n = 8), and huSkMCx43 + MSC (n = 4) (one-way Anova test followed by Tukey’s multiple comparison test).
Figure 8
Figure 8
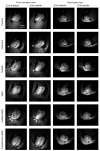
Representative MR images of control hearts (no interventions), post-infarction hearts, and healthy hearts after huSkM, MSCs, huSkM + MSC or huSkMCx43 + MSC cell interventions. The first two columns represent the 4-chamber view (end-diastole is the first column and end-systole is the second column); the next two columns represent the short-axis view (end-diastole is the third column and end-systole is the fourth column). The infarct area is indicated by arrows.
Figure 9
Figure 9
Functional analysis of cardiac haemodynamics after huSkM (n = 4), MSCs (n = 4), huSkM+MSC (n = 8 and huSkMCx43+MSC (n = 8) cells intervention compared to the control-healthy hearts (n = 10) and MI (n = 5). (a). left ventricle ejection fraction (LV ejection fraction), (b). left ventricle mass (LV mass), (c). left ventricle end-diastolic volume (LV EDV), (d). right ventricle ejection fraction (RV ejection fraction) and (e). right ventricle mass (RV mass). Box represents 25th–75th percentile, line represents the median, whiskers are min to max, single values are presented as dots. * p < 0.05, *** p < 0.001, **** p < 0.0001, Kruskal-Wallis test followed by Dunn’s multiple comparisons test.

Similar articles

Cited by

References

    1. Garbern J.C., Lee R.T. Cardiac stem cell therapy and the promise of heart regeneration. Cell Stem Cell. 2013;12:689–698. doi: 10.1016/j.stem.2013.05.008. - DOI - PMC - PubMed
    1. Guan X., Xu W., Zhang H., Wang Q., Yu J., Zhang R., Chen Y., Xia Y., Wang J., Wang D. Transplantation of human induced pluripotent stem cell-derived cardiomyocytes improves myocardial function and reverses ventricular remodeling in infarcted rat hearts. Stem Cell Res. Ther. 2020;11:73. doi: 10.1186/s13287-020-01602-0. - DOI - PMC - PubMed
    1. Li G., Chen J., Zhang X., He G., Ta W., Wu H., Li R., Chen Y., Gu R., Xie J., et al. Cardiac repair in a mouse model of acute myocardial infarction with trophoblast stem cells. Sci. Rep. 2017;7:44376. doi: 10.1038/srep44376. - DOI - PMC - PubMed
    1. He K.L., Yi G.H., Sherman W., Zhou H., Zhang G.P., Gu A., Kao R., Haimes H.B., Harvey J., Roos E., et al. Autologous skeletal myoblast transplantation improved hemodynamics and left ventricular function in chronic heart failure dogs. J. Hear Lung Transplant. 2005;24:1940–1949. doi: 10.1016/j.healun.2005.02.024. - DOI - PubMed
    1. Gavira J.J., Nasarre E., Abizanda G., Pérez-Ilzarbe M., de Martino-Rodriguez A., de Jalón J.A.G., Mazo M., Macias A., García-Bolao I., Pelacho B., et al. Repeated implantation of skeletal myoblast in a swine model of chronic myocardial infarion. Eur. Heart J. 2010;31:1013–1021. doi: 10.1093/eurheartj/ehp342. - DOI - PubMed