. 2021 Oct 5;22(19):10771.
doi: 10.3390/ijms221910771.

Effect of Structural Changes Induced by Deletion of 54FLRAPSWF61 Sequence in αB-crystallin on Chaperone Function and Anti-Apoptotic Activity

Affiliations

Effect of Structural Changes Induced by Deletion of 54FLRAPSWF61 Sequence in αB-crystallin on Chaperone Function and Anti-Apoptotic Activity

Sundararajan Mahalingam et al. Int J Mol Sci. .

Abstract

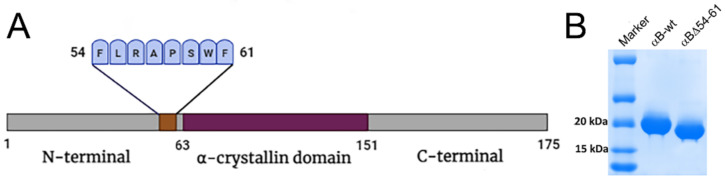
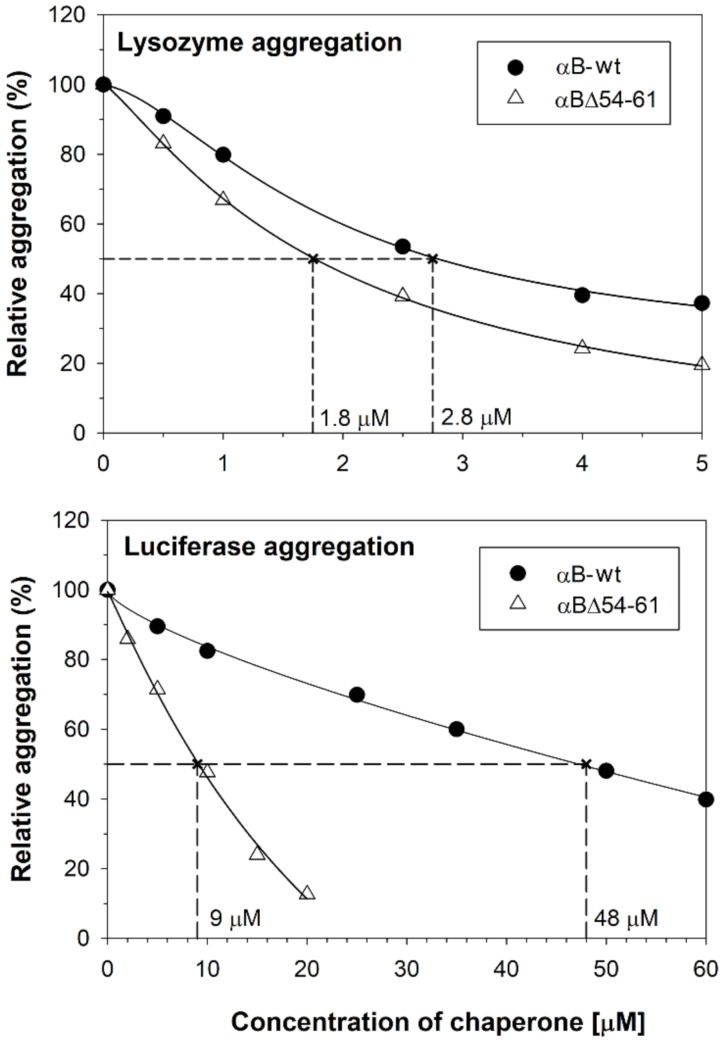
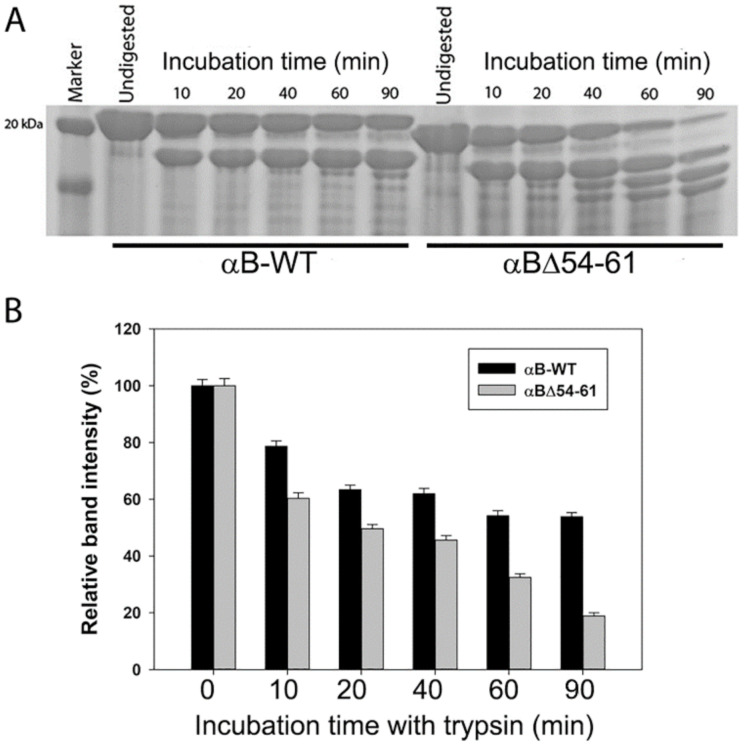
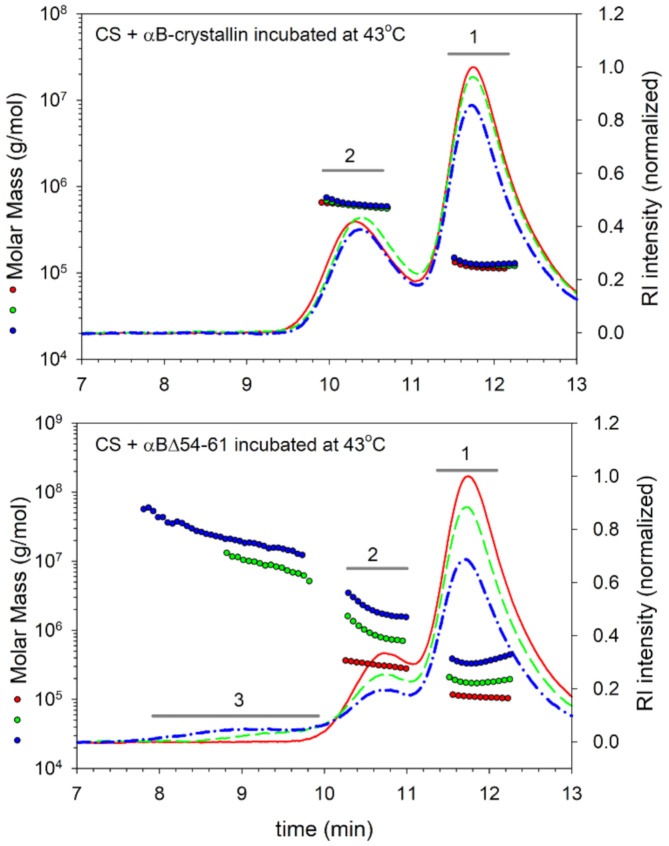
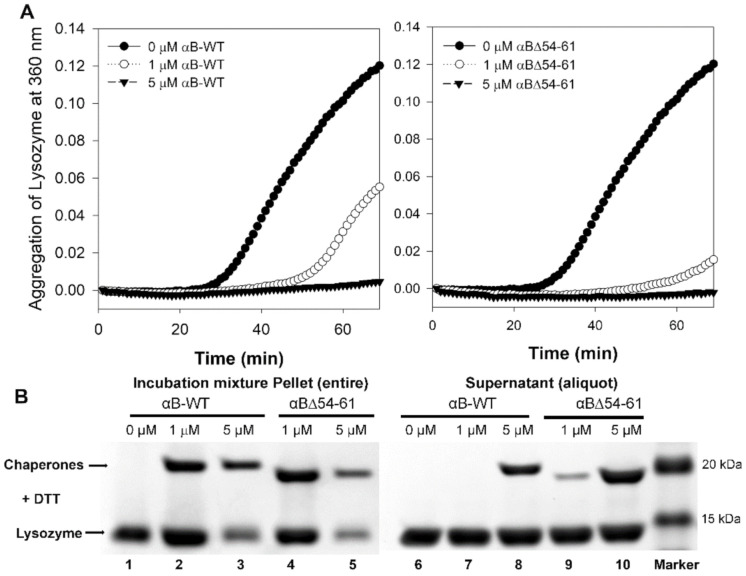
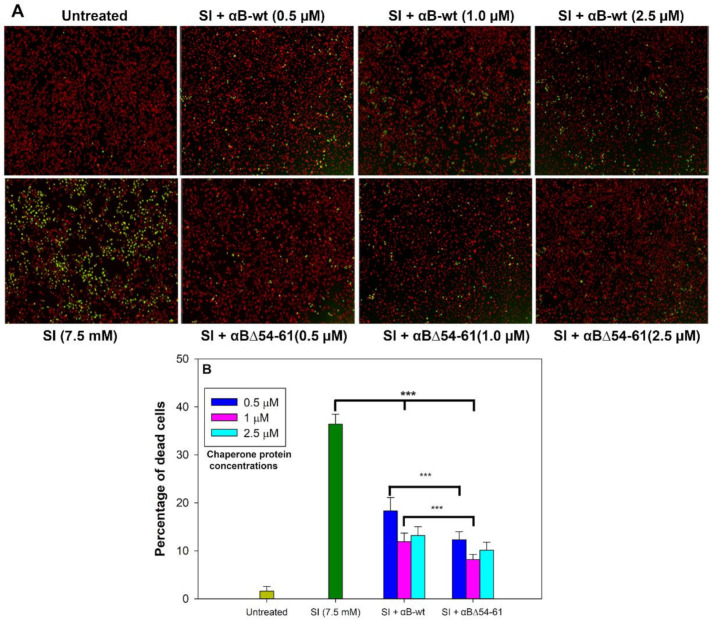
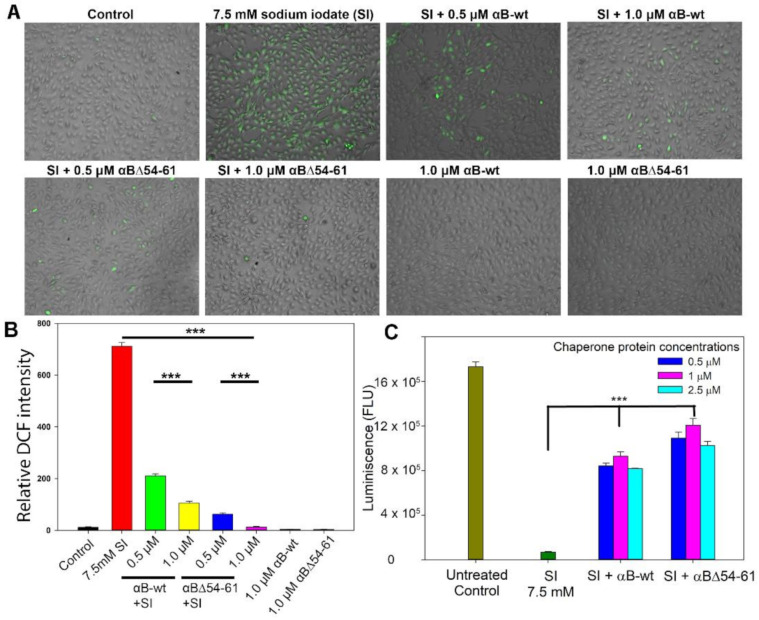
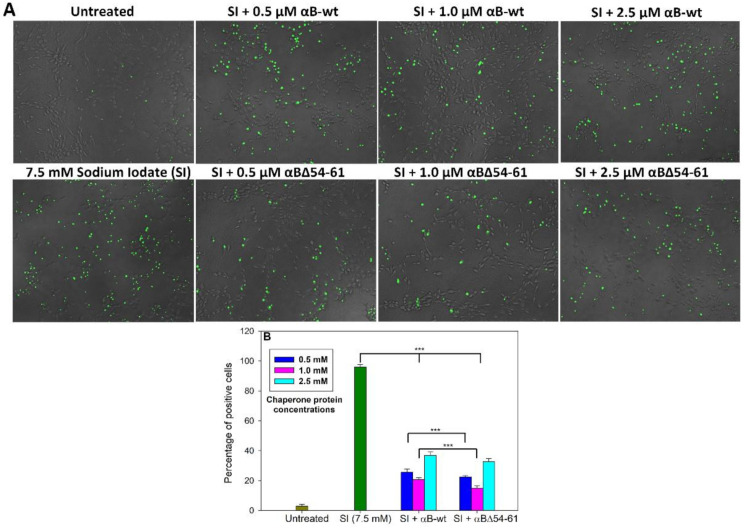
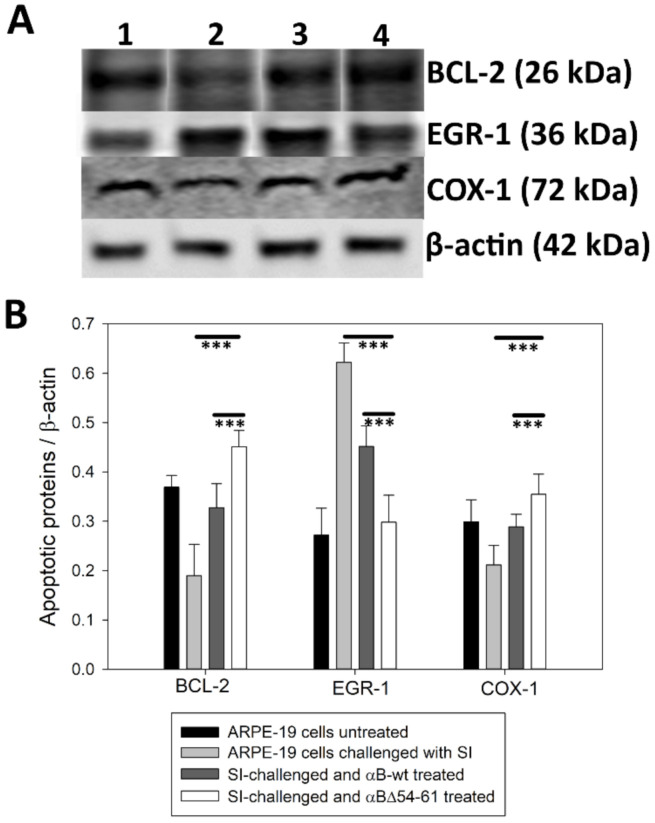
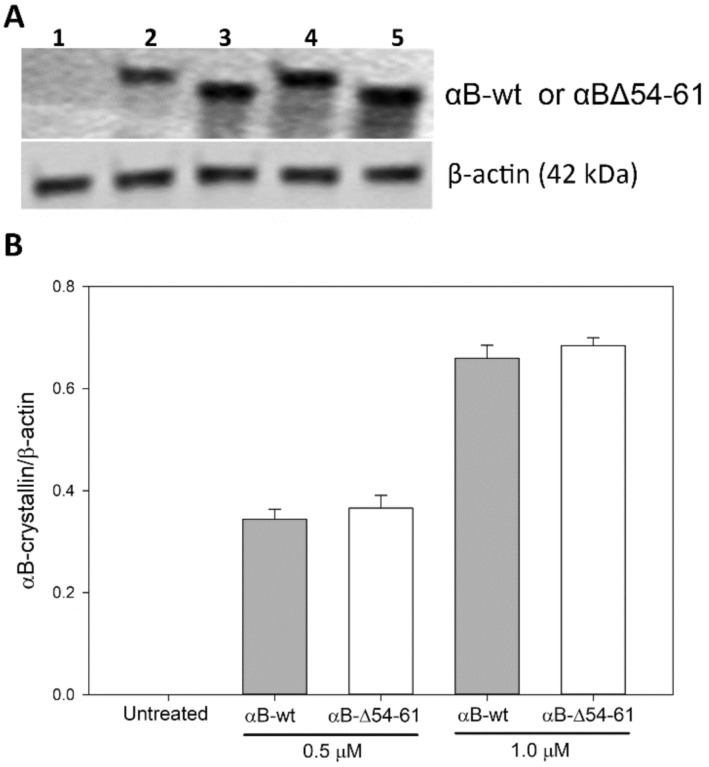
Previously, we showed that the removal of the 54-61 residues from αB-crystallin (αBΔ54-61) results in a fifty percent reduction in the oligomeric mass and a ten-fold increase in chaperone-like activity. In this study, we investigated the oligomeric organization changes in the deletion mutant contributing to the increased chaperone activity and evaluated the cytoprotection properties of the mutant protein using ARPE-19 cells. Trypsin digestion studies revealed that additional tryptic cleavage sites become susceptible in the deletion mutant than in the wild-type protein, suggesting a different subunit organization in the oligomer of the mutant protein. Static and dynamic light scattering analyses of chaperone-substrate complexes showed that the deletion mutant has more significant interaction with the substrates than wild-type protein, resulting in increased binding of the unfolding proteins. Cytotoxicity studies carried out with ARPE-19 cells showed an enhancement in anti-apoptotic activity in αBΔ54-61 as compared with the wild-type protein. The improved anti-apoptotic activity of the mutant is also supported by reduced caspase activation and normalization of the apoptotic cascade components level in cells treated with the deletion mutant. Our study suggests that altered oligomeric assembly with increased substrate affinity could be the basis for the enhanced chaperone function of the αBΔ54-61 protein.

Keywords: aggregation; apoptosis; cataract; chaperone; interactions; mutant; oligomerization; αB-crystallin.


Conflict of interest statement

The authors declare no conflict of interest. The funders had no role in the design of the study; in the collection, analyses, or interpretation of data; in the writing of the manuscript; or in the decision to publish the results.

Figures

Figure 1
Figure 1
(A) Schematic representation of αB-crystallin showing central α-crystallin domain flanked by N-terminal domain and C-terminal domain and deleted 54–61 sequence. (B). SDS-PAGE profile of overexpressed and purified αB-wt and αBΔ54–61.
Figure 2
Figure 2
Chaperone-like activity assays of αB-wt and αBΔ54–61. Relative aggregation of lysozyme (upper panel) and luciferase (lower panel) in PBS in the presence of different concentrations of chaperone proteins was estimated by monitoring the light scattering at 360 nm on a plate reader. The result shown is representative of three independent experiments. The EC50 (effective chaperone protein concentration required to suppress the substrate protein aggregation by 50%) values are shown in the figure. The substrate protein aggregation (scattering at 360 nm) in the absence of chaperone protein is considered 100% aggregation. The aggregation of substrate protein shown at each concentration of chaperone protein tested is relative to the aggregation of substrate protein without the chaperone protein.
Figure 3
Figure 3
(A) SDS-PAGE analysis of incubation mixtures of αB-wt and αBΔ54–61 with trypsin analyzed at different time points. Protein samples were incubated with trypsin (1:200 protease to protein w/w) at 37 °C. (B) Bar graph showing a decrease in full-length protein band intensities against the incubation time. The SDS-PAGE gels were imaged on a BioRad ChemiDoc XRS+ imaging system (Bio-Rad laboratories, Hercules, CA, USA), and the band intensities were analyzed using Image Lab software (Bio-Rad). The data shown are the mean + SD of three independent experiments.
Figure 4
Figure 4
Refractive index profiles of chaperone–substrate complexes showing the molar mass distribution across the peaks. MALS analysis of αB-wt or αBΔ54–61 and CS incubation mixtures at different time points: red line—0 min, green line—40 min, blue line—80 min incubation. The upper panel shows the molar mass distribution in the incubation mixtures of αB-wt and CS. The lower panel shows molar mass analysis of αBΔ54–61 and CS after incubation. Other experimental details are included under the Methods section.
Figure 5
Figure 5
(A) Comparison of chaperone activity of αB-wt and αBΔ54–61 at two equimolar concentrations (1 and 5 µM) using lysozyme (5 µM) as the aggregation substrate. (B) SDS-PAGE of the chaperone assay supernatant and pellet fractions analyzed at the end of the assay. The αBΔ54–61 has a higher substrate binding capacity than that of αB-wt.
Figure 6
Figure 6
Anti-apoptotic activity of αB-wt and αBΔ54–61 against SI-induced apoptosis in ARPE-19 cells. (A) Serum-starved ARPE-19 cells were simultaneously treated with 0.5–2.5 µM proteins and 7.5 mM sodium iodate for 24 h as described under Methods. Cytotoxicity was measured using an EarlyTox cell integrity assay kit from Molecular Devices, San Jose, CA, USA as described under Methods. The cells were imaged on a SpectraMax MiniMax 300 Imaging Cytometer (Molecular Devices) equipped with a single 4X objective. (B) Bar diagram showing the percentage of dead cells calculated after live/dead cell imaging using SoftMax Pro software (Molecular Devices). The data shown are an average of six analyses performed on images captured from different wells. The asterisks (***) indicate a p-value < 0.005 (n = 6).
Figure 7
Figure 7
(A). Anti-oxidative potentials of αB-wt and αBΔ54–61 in SI-treated ARPE-19 cells. ARPE-19 cells cultured on a 96-well plate were treated with SI and/or αB-crystallins for 24 h. The SI-induced reactive oxygen species (ROS) generation was measured by 2′,7′-Dichlorofluorescin diacetate (DCFH-DA) staining. The images were captured in EVOS FL Auto2 Imaging System (Thermo Fisher Scientific, Waltham, MA, USA) with 10× magnification. (B) The relative 2’-7’-dichlorofluorescein (DCF) intensity (green) calculated using EVOS™ image analysis software (version 1.4.998.659). (C) ARPE-19 cells cultured on a 96-well plate were treated with SI and/or αB-wt and αBΔ54–61 for 24 h. CellTiter Glo 2.0 assay was used to measure ATP, an indicator of cell health. ATP is quantified indirectly by measuring the luminescence of the cells after treatment and is expressed as relative light units (RLU/well). The data shown are an average of six analyses performed on images captured from different wells. The asterisks (***) represent a p-value < 0.005.
Figure 8
Figure 8
Effect of αB-crystallin sequence 54–61 deletion on caspase activation. (A) ARPE-19 cells treated with sodium iodate and/or αB-crystallins and the relative amount of caspase activation was determined after 24 h using NucView 488 Caspase-3/7 assay kit as described under Methods. The images were captured using EVOS FL Auto2 Imaging System in 4× magnification. (B) The percentage of positive cells in each sample was calculated from the cell imaging data using EVOS™ image analysis software (version 1.4.998.659) normalized with the total number of cells in each well. The data show an average of six analyses performed on images captured from different wells for caspase activity in cells simultaneously treated with sodium iodate and αB-crystallins. The asterisks (***) represent a p-value < 0.005.
Figure 9
Figure 9
Immunoblot showing the intensity of apoptotic cascade components. (A) Western blotting analysis showing the intracellular expression of apoptotic cascade components in experimental groups of ARPE-19 cells. (1) ARPE-19 cells untreated, (2) ARPE-19 cells treated with 7.5 mM SI, (3) ARPE-19 cells simultaneously treated with 7.5 mM SI and 1µM of αB-wt, (4) ARPE-19 cells simultaneously treated with 7.5 mM SI and 1µM of αBΔ54–61. (B) Bar graphs of proteins of Bcl-2, EGR-1, and COX-1 normalized to cellular β-actin protein levels. The asterisks (***) indicate a p-value < 0.005.
Figure 10
Figure 10
(A) Western blotting analysis showing the crystallin proteins transduced into the ARPE-19 cells. Lanes—(1) ARPE-19 cells untreated, (2) 0.5 μM of αB-wt, (3) 0.5 μM of αBΔ54–61, (4) 1 μM of αB-wt, and (5) 1μM of αBΔ54–61. (B) Bar graphs of normalized Western blot band intensities.

Similar articles

Cited by

References

    1. Narberhaus F. α-Crystallin-type heat shock proteins: Socializing minichaperones in the context of a multichaperone network. Microbiol. Mol. Biol. Rev. 2002;66:64–93. doi: 10.1128/MMBR.66.1.64-93.2002. - DOI - PMC - PubMed
    1. Horwitz J. Alpha-crystallin. Exp. Eye Res. 2003;76:145–153. doi: 10.1016/S0014-4835(02)00278-6. - DOI - PubMed
    1. Bhat S.P., Nagineni C.N. αB subunit of lens-specific protein α crystallin is present in other ocular and non-ocular tissues. Biochem. Biophys. Res. Commun. 1989;158:319–325. doi: 10.1016/S0006-291X(89)80215-3. - DOI - PubMed
    1. Nagaraj R.H., Nahomi R.B., Mueller N.H., Raghavan C.T., Ammar D.A., Petrash J.M. Therapeutic potential of α-crystallin. Biochim. Biophys. Acta. 2016;1860:252–257. doi: 10.1016/j.bbagen.2015.03.012. - DOI - PMC - PubMed
    1. Iwaki T., Wisniewski T., Iwaki A., Corbin E., Tomokane N., Tateishi J., Goldman J. Accumulation of alpha B-crystallin in central nervous system glia and neurons in pathologic conditions. Am. J. Pathol. 1992;140:345–356. - PMC - PubMed

MeSH terms

LinkOut - more resources