

Heterogeneity of Melanoma Cell Responses to Sleep Apnea-Derived Plasma Exosomes and to Intermittent Hypoxia
- PMID: 34638272
- PMCID: PMC8508428
- DOI: 10.3390/cancers13194781
Heterogeneity of Melanoma Cell Responses to Sleep Apnea-Derived Plasma Exosomes and to Intermittent Hypoxia
Abstract
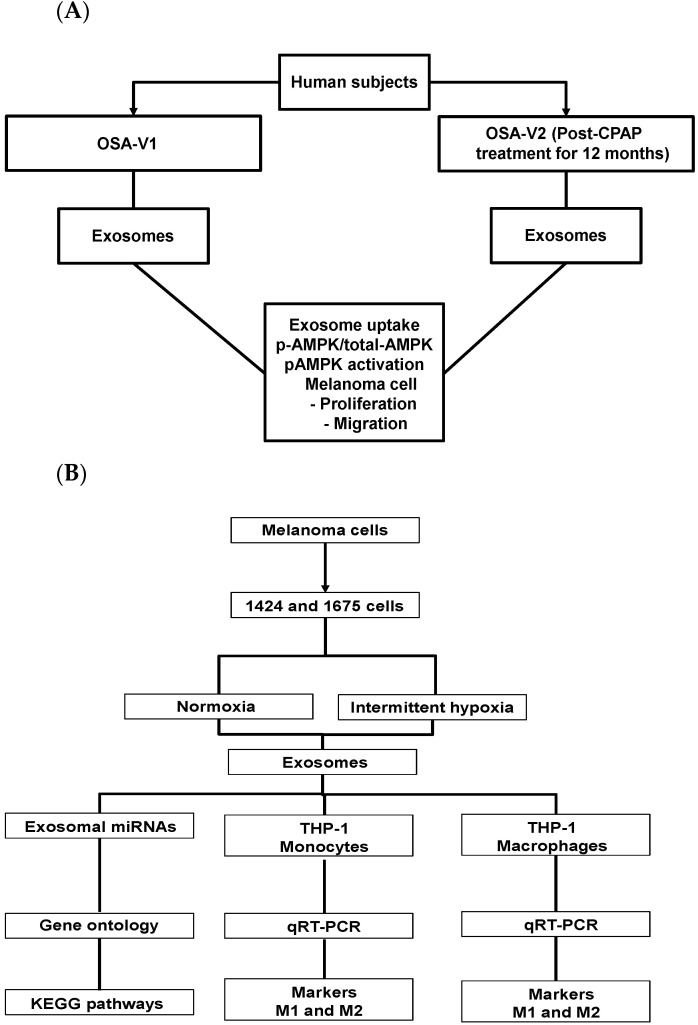
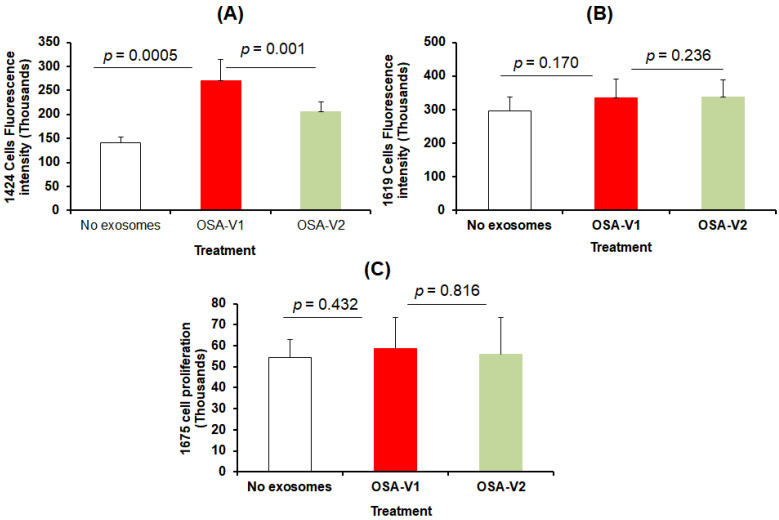
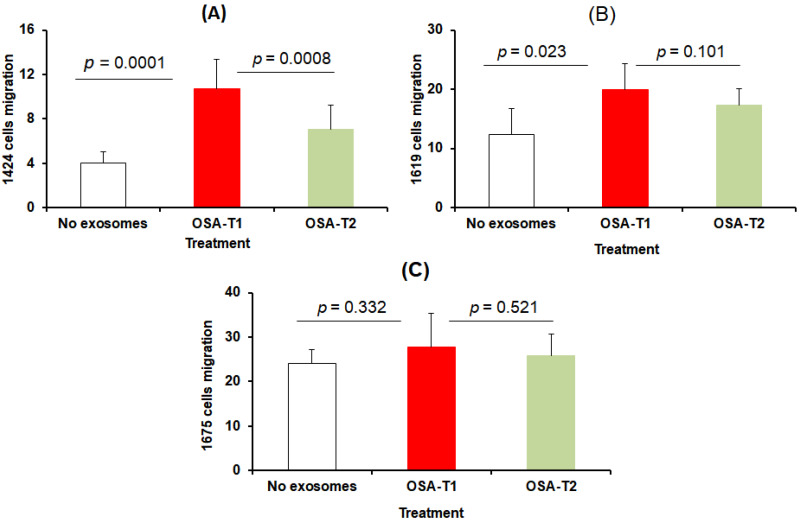
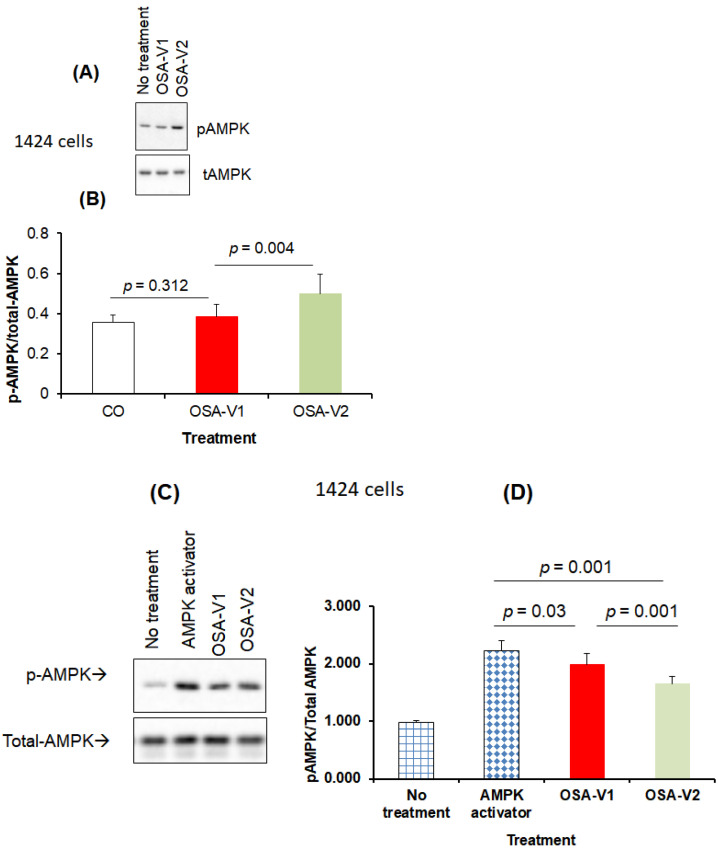
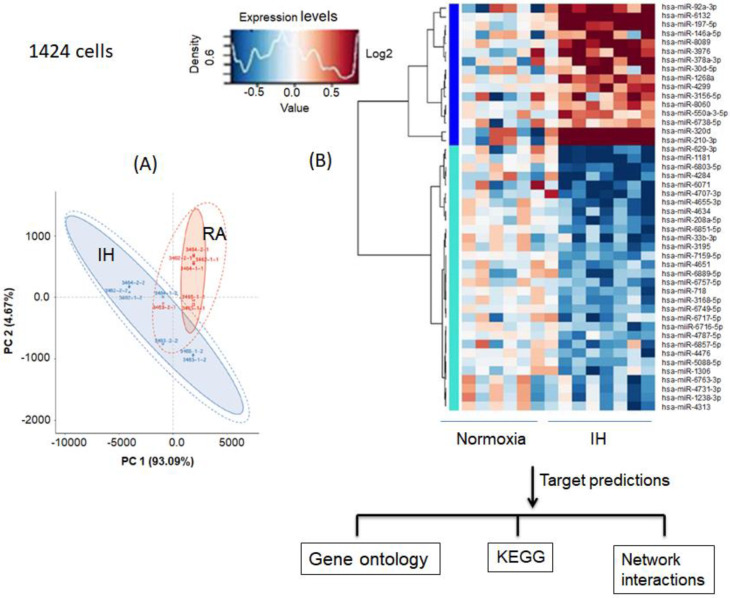
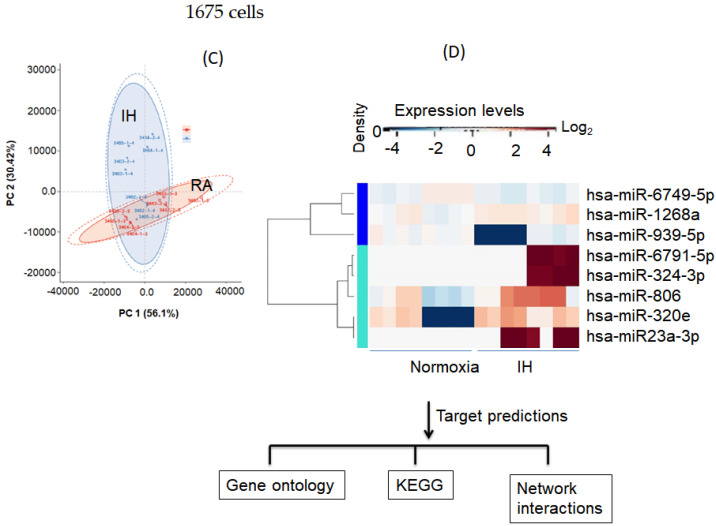
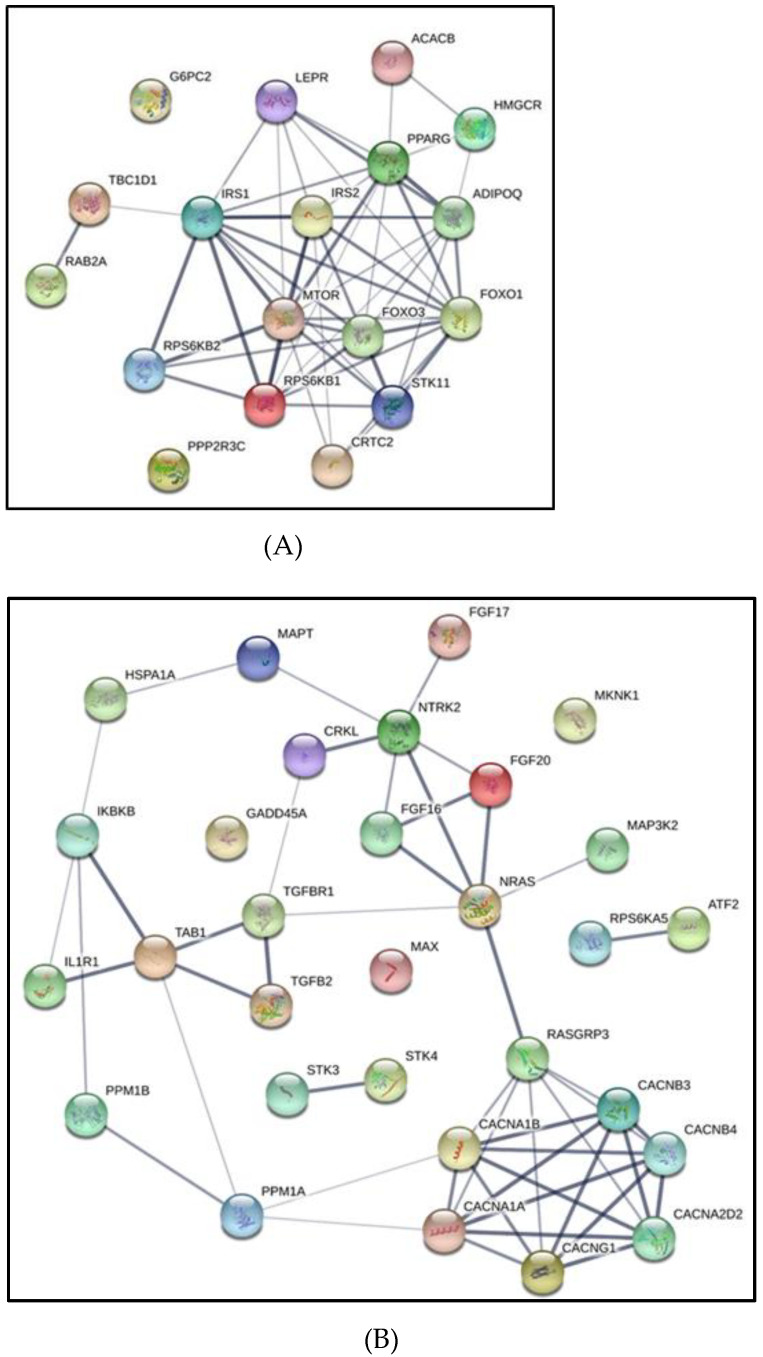
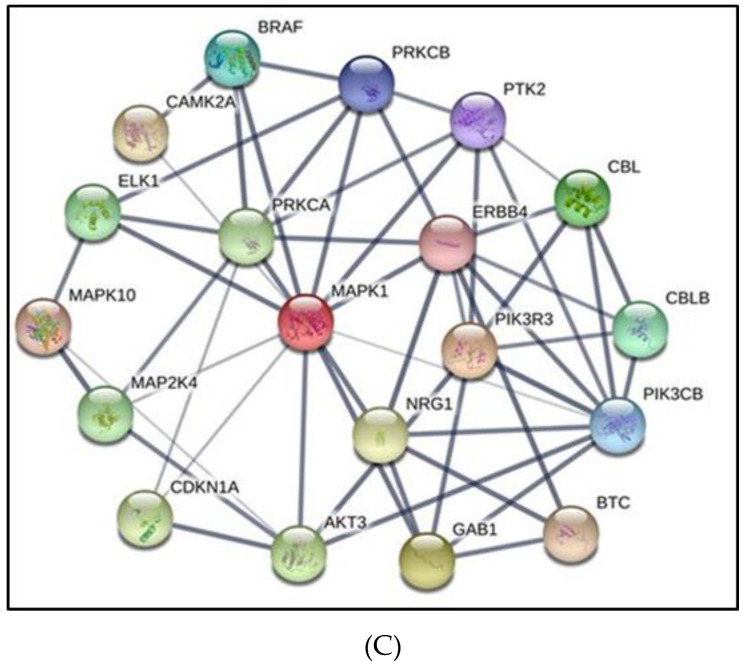
Obstructive sleep apnea (OSA) is associated with increased cutaneous melanoma incidence and adverse outcomes. Exosomes are secreted by most cells, and play a role in OSA-associated tumor progression and metastasis. We aimed to study the effects of plasma exosomes from OSA patients before and after adherent treatment with continuous positive airway pressure (CPAP) on melanoma cells lines, and also to identify exosomal miRNAs from melanoma cells exposed to intermittent hypoxia (IH) or normoxia. Plasma-derived exosomes were isolated from moderate-to-severe OSA patients before (V1) and after (V2) adherent CPAP treatment for one year. Exosomes were co-incubated with three3 different melanoma cell lines (CRL 1424; CRL 1619; CRL 1675) that are characterized by genotypes involving different mutations in BRAF, STK11, CDKN2A, and PTEN genes to assess the effect of exosomes on cell proliferation and migration, as well as on pAMK activity in the presence or absence of a chemical activator. Subsequently, CRL-1424 and CRL-1675 cells were exposed to intermittent hypoxia (IH) and normoxia, and exosomal miRNAs were identified followed by GO and KEG pathways and gene networks. The exosomes from these IH-exposed melanoma cells were also administered to THP1 macrophages to examine changes in M1 and M2 polarity markers. Plasma exosomes from V1 increased CRL-1424 melanoma cell proliferation and migration compared to V2, but not the other two cell lines. Exposure to CRL-1424 exosomes reduced pAMPK/tAMPK in V1 compared to V2, and treatment with AMPK activator reversed the effects. Unique exosomal miRNAs profiles were identified for CRL-1424 and CRL-1675 in IH compared to normoxia, with six miRNAs being regulated and several KEGG pathways were identified. Two M1 markers (CXCL10 and IL6) were significantly increased in monocytes when treated with exosomes from IH-exposed CRL-1424 and CRL-1625 cells. Our findings suggest that exosomes from untreated OSA patients increase CRL-1424 melanoma malignant properties, an effect that is not observed in two other melanoma cell lines. Exosomal cargo from CRL-1424 cells showed a unique miRNA signature compared to CRL-1675 cells after IH exposures, suggesting that melanoma cells are differentially susceptible to IH, even if they retain similar effects on immune cell polarity. It is postulated that mutations in STK-11 gene encoding for the serine/threonine kinase family that acts as a tumor suppressor may underlie susceptibility to IH-induced metabolic dysfunction, as illustrated by CRL-1424 cells.
Keywords: AMPK; CPAP; CRL-1424; CRL-1619; CRL-1675; exosomes; intermittent hypoxia; melanoma; miRNAs; positive airway pressure; sleep apnea.
Conflict of interest statement
The authors declare no conflict of interest.
Figures
Similar articles
-
Tumor Cell Malignant Properties Are Enhanced by Circulating Exosomes in Sleep Apnea.Chest. 2016 Nov;150(5):1030-1041. doi: 10.1016/j.chest.2016.08.1438. Epub 2016 Aug 26. Chest. 2016. PMID: 27568581
-
Plasma exosomes in OSA patients promote endothelial senescence: effect of long-term adherent continuous positive airway pressure.Sleep. 2020 Feb 13;43(2):zsz217. doi: 10.1093/sleep/zsz217. Sleep. 2020. PMID: 31552414 Free PMC article.
-
Effect on Intermittent Hypoxia on Plasma Exosomal Micro RNA Signature and Endothelial Function in Healthy Adults.Sleep. 2016 Dec 1;39(12):2077-2090. doi: 10.5665/sleep.6302. Sleep. 2016. PMID: 27634792 Free PMC article.
-
Circulating exosomes in obstructive sleep apnea as phenotypic biomarkers and mechanistic messengers of end-organ morbidity.Respir Physiol Neurobiol. 2018 Oct;256:143-156. doi: 10.1016/j.resp.2017.06.004. Epub 2017 Jul 1. Respir Physiol Neurobiol. 2018. PMID: 28676332 Free PMC article. Review.
-
Intermittent hypoxia initiated plasticity in humans: A multipronged therapeutic approach to treat sleep apnea and overlapping co-morbidities.Exp Neurol. 2017 Jan;287(Pt 2):113-129. doi: 10.1016/j.expneurol.2016.05.011. Epub 2016 May 8. Exp Neurol. 2017. PMID: 27170208 Review.
Cited by
-
Hypoxia Induced Changes of Exosome Cargo and Subsequent Biological Effects.Front Immunol. 2022 Apr 4;13:824188. doi: 10.3389/fimmu.2022.824188. eCollection 2022. Front Immunol. 2022. PMID: 35444652 Free PMC article. Review.
-
Small Extracellular Vesicles Harboring PD-L1 in Obstructive Sleep Apnea.Int J Mol Sci. 2024 Mar 11;25(6):3208. doi: 10.3390/ijms25063208. Int J Mol Sci. 2024. PMID: 38542182 Free PMC article.
-
Potential Pathophysiological Pathways in the Complex Relationships between OSA and Cancer.Cancers (Basel). 2023 Feb 7;15(4):1061. doi: 10.3390/cancers15041061. Cancers (Basel). 2023. PMID: 36831404 Free PMC article. Review.
-
Metastatic Progression of Human Melanoma.Cancers (Basel). 2023 Feb 15;15(4):1225. doi: 10.3390/cancers15041225. Cancers (Basel). 2023. PMID: 36831566 Free PMC article.
References
-
- Perez-Warnisher M.T., Cabezas E., Troncoso M.F., Gomez T., Melchor R., Pinillos E.J., El Hachem A., Gotera C., Rodriguez P., Mahillo I., et al. Sleep disordered breathing and nocturnal hypoxemia are very prevalent in a lung cancer screening population and may condition lung cancer screening findings: Results of the prospective Sleep Apnea in Lung Cancer Screening (SAILS) study. Sleep Med. 2019;54:181–186. doi: 10.1016/j.sleep.2018.10.020. - DOI - PubMed
-
- Campos-Rodriguez F., Martinez-Garcia M.A., Martinez M., Duran-Cantolla J., Pena Mde L., Masdeu M.J., Gonzalez M., Campo F., Gallego I., Marin J.M., et al. Association between obstructive sleep apnea and cancer incidence in a large multicenter Spanish cohort. Am. J. Respir. Crit. Care Med. 2013;187:99–105. doi: 10.1164/rccm.201209-1671OC. - DOI - PubMed
LinkOut - more resources
Full Text Sources
Research Materials
Miscellaneous
