. 2021 Dec;20(12):2398-2409.
doi: 10.1158/1535-7163.MCT-21-0396. Epub 2021 Oct 8.

A Benzenesulfonamide-Based Mitochondrial Uncoupler Induces Endoplasmic Reticulum Stress and Immunogenic Cell Death in Epithelial Ovarian Cancer

Affiliations

A Benzenesulfonamide-Based Mitochondrial Uncoupler Induces Endoplasmic Reticulum Stress and Immunogenic Cell Death in Epithelial Ovarian Cancer

Fangfang Bi et al. Mol Cancer Ther. 2021 Dec.

Abstract

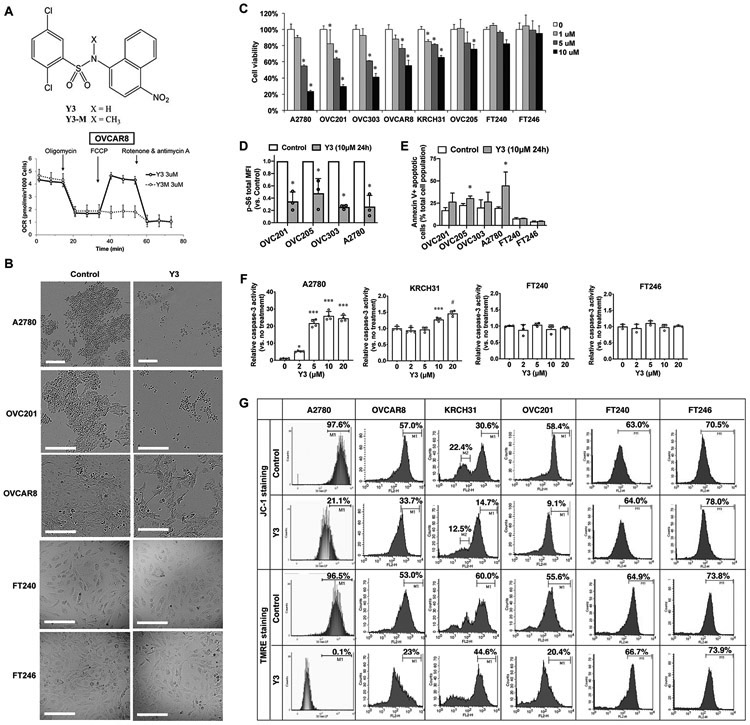
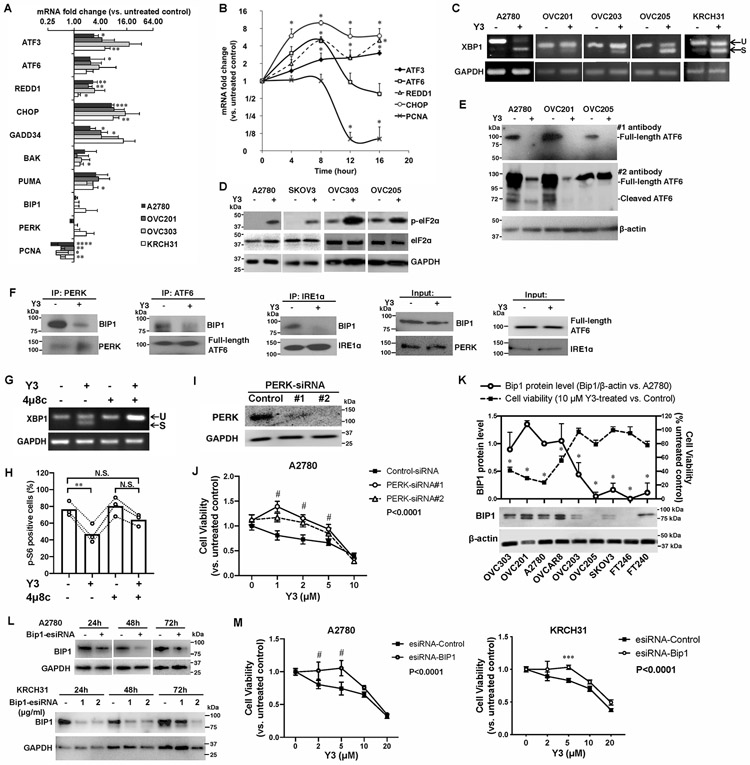
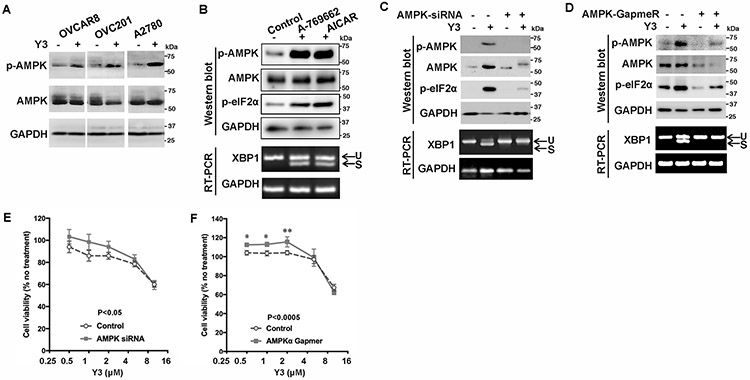
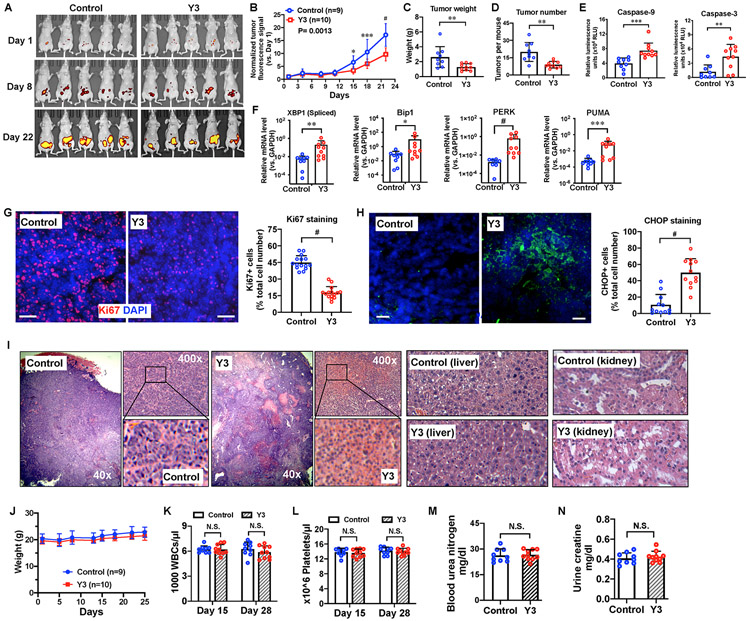
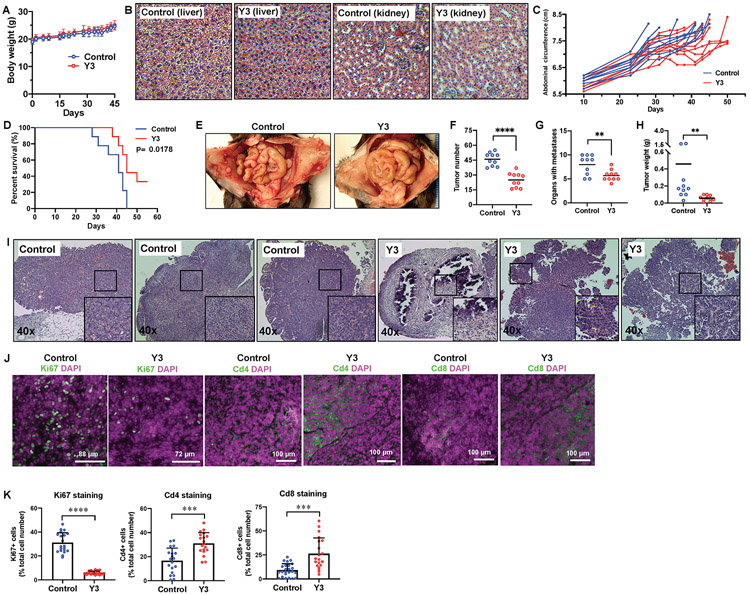
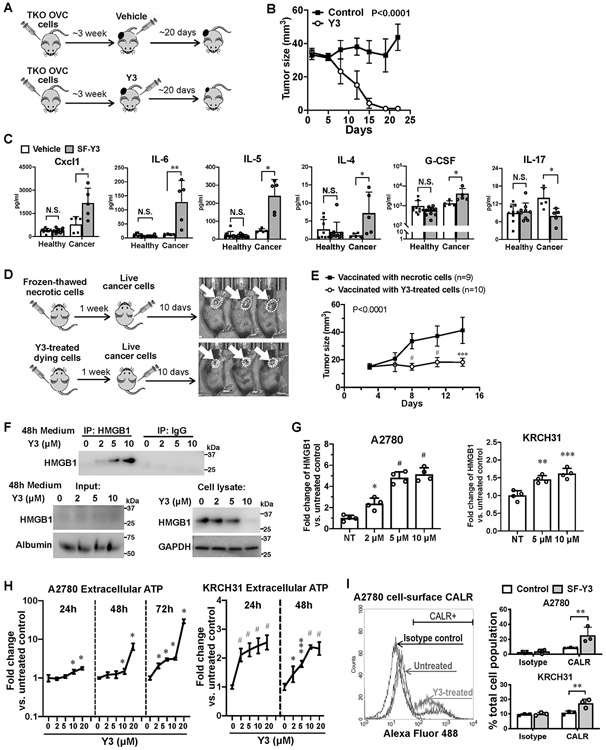
Epithelial ovarian cancer (EOC) is the leading cause of death from gynecologic malignancies and requires new therapeutic strategies to improve clinical outcomes. EOC metastasizes in the abdominal cavity through dissemination in the peritoneal fluid and ascites, efficiently adapt to the nutrient-deprived microenvironment, and resist current chemotherapeutic agents. Accumulating evidence suggests that mitochondrial oxidative phosphorylation is critical for the adaptation of EOC cells to this otherwise hostile microenvironment. Although chemical mitochondrial uncouplers can impair mitochondrial functions and thereby target multiple, essential pathways for cancer cell proliferation, traditional mitochondria uncouplers often cause toxicity that precludes their clinical application. In this study, we demonstrated that a mitochondrial uncoupler, specifically 2,5-dichloro-N-(4-nitronaphthalen-1-yl)benzenesulfonamide, hereinafter named Y3, was an antineoplastic agent in ovarian cancer models. Y3 treatment activated AMP-activated protein kinase and resulted in the activation of endoplasmic reticulum stress sensors as well as growth inhibition and apoptosis in ovarian cancer cells in vitro Y3 was well tolerated in vivo and effectively suppressed tumor progression in three mouse models of EOC, and Y3 also induced immunogenic cell death of cancer cells that involved the release of damage-associated molecular patterns and the activation of antitumor adaptive immune responses. These findings suggest that mitochondrial uncouplers hold promise in developing new anticancer therapies that delay tumor progression and protect patients with ovarian cancer against relapse.


Conflict of interest statement

Competing interests

The authors declare no potential conflicts of interest.

Figures

Figure. 1.
Figure. 1.. Y3 induces apoptosis and inhibits proliferation of EOC cells.
A, Chemical structure of Y3/Y3-M and the oxygen consumption rate (OCR) of OVCAR8 cells. The final concentration of Y3 or Y3-M was 3μM. B, Morphology of 10 μM Y3-treated and untreated EOC cell lines. Scale bar = 200 μm. C, Cell viability of Y3 treated cells. Two-way ANOVA followed by Sidak HSD test, n=5, *P<0.005. D, p-S6 flow cytometry analysis. Cancer cells were treated with 10 μM Y3 for 24 hs. MFI, median fluorescence intensity. Two-way ANOVA followed by Sidak HSD test, n=3, *P<0.05. E, AnnexinV-FITC/PI flow cytometry analysis. Cancer cells were treated with 10 μM Y3 for 24 h. Two-way ANOVA followed by Sidak HSD test, n=3, * P<0.05. The connecting lines indicate the paired data points that were generated from one experiment. F, Caspase-3 activity of EOC cell lines treated with 10 μM Y3 for 48 h. One-way ANOVA followed by Tukey’s HSD test, n=4, *P<0.05, ***p<0.0005, and #p<0.0001. G, Histograms of flow cytometry analysis in EOC cell lines stained with JC-1 or TMRE. The staining-positive cell populations were labeled with marker 1 (M1).
Figure 2.
Figure 2.. Y3 treatment induces UPR in EOC cells.
A, RT-QPCR of UPR genes in EOC cell lines. Cells were treated with 10 μM Y3 for 24 h. GAPDH was used as a house-keeping gene. Two-way ANOVA followed by Sidak HSD test, n=3, *P<0.05, **P<0.005, ***P<0.0005, ****P<0.0001. B, RT-QPCR of UPR target genes in A2780 cells at different time points of Y3 treatment. A2780 cells were treated with 10 μM Y3. Two-way ANOVA followed by Sidak HSD test, n=3, *P<0.05. C, XBP1 mRNA splicing analyzed by RT-PCR and agarose gel. EOC cells were treated by 10 μM Y3 for 24 h. U, unspliced. S, spliced. D, Y3 treatment (10 μM, 24h) induces eIF2a phosphorylation. GAPDH was used as a loading control. E, Y3 treatment (10 μM, 24h) induces ATF6 cleavage. β-actin was used as a loading control. F, Co-IP of BIP1, PERK, ATF6, and IRE1α. A2780 cells were treated with 10 μM Y3 for 6 h. G, XBP1 mRNA splicing analyzed by RT-PCR and agarose gel. 4μ8c inhibits Y3-induced XBP1 mRNA splicing. A2780 cells are treated by 10 μM Y3 and/or 10 μM 4μ8c for 24 h. H, Flow cytometry analysis of p-S6. A2780 cells are treated by 10 μM Y3 and/or 10 μM 4μ8c for 24 h. Two-way ANOVA followed by Sidak HSD test, n=3, **P<0.005. I, Western blot images of PERK protein knocked down by two siRNAs (#1 and #2). GAPDH was used as a loading control. J, PERK siRNAs inhibit the response of A2780 cells to Y3. Two-way ANOVA followed by Sidak HSD test, n=6, #P<0.0001. K, BIP1 protein level is associated with sensitivity to Y3. Student’s t-test, *P<0.05. β-actin was used as a loading control. L, BIP1-targeting esiRNAs inhibit the expression of BIP1 in A2780 and KRCH31 cells. The negative control esiRNAs target GFP. GAPDH was used as a loading control. M, BIP1-targeting esiRNA inhibits the response of A2780 and KRCH31 cells to Y3. Two-way ANOVA followed by Sidak HSD test, n=6, ***P<0.0005 and #P<0.0001 for comparisons between Y3-treated and untreated groups at the indicated concentrations. P values for the comparisons between the entire control and knockdown groups were indicated in the legend.
Figure 3.
Figure 3.. Y3 induces UPR through activating AMPK in EOC cells.
A, Representative images of western blot. Y3 induced AMPK phosphorylation in ovarian cancer cells. p-AMPK, phosphorylated AMPK. AMPK, total AMPK. GAPDH was used as a loading control. B, Representative images of western blot and agarose gel electrophoresis. A2780 cells were treated with AMPK activators A-769662 (10 μM) or AICAR (1 mM) for 24 h. Whole cell lysate was analyzed with western blot. The splicing of XBP1 mRNA was analyzed by RT-PCR and agarose gel electrophoresis. U, unspliced. S, spliced. GAPDH was used as a loading control. C, AMPK siRNA knocks down AMPK expression and inhibits Y3-induced eIF2α phosphorylation and XBP1 mRNA splicing. U, unspliced. S, spliced. GAPDH was used as a loading control. D, AMPK GapmeR knocks down AMPK expression and inhibits Y3-induced eIF2α phosphorylation and XBP1 mRNA splicing. U, unspliced. S, spliced. GAPDH was used as a loading control. E and F, AMPK siRNA (E) and GapmeR (F) partially inhibit the response of A2780 cells to Y3. Two-way ANOVA followed by Sidak HSD test, n=5, p values for the comparisons between the entire control and knockdown groups as indicated in the graph. *P<0.05 and **P<0.005 for comparisons between control and knockdown groups at the indicated concentrations.
Figure 4.
Figure 4.. Y3 suppresses EOC progression in nude mice.
A, Live imaging of red fluorescence protein (RFP) of tumors in nude mice. B, Tumor growth curves based on RFP signals. Normalized tumor fluorescence signal was calculated as the fluorescence signal relative to signal of the tumor on the first day of imaging. Two-way ANOVA followed by Sidak HSD test, *P<0.05, ***P<0.0005, #P<0.0001. C, Tumor weight. Student’s t-test, **P<0.005. D, Numbers of tumors in each mouse. Student’s t-test, **P<0.005. E, Caspase-9 and caspase-3 activity in tumor protein lysate. Student’s t-test, **P<0.005, ***P<0.0005. F, Expression of spliced XBP1 mRNA, PERK, BIP1 and PUMA in mouse ovarian cancer xenografts. The levels of mRNA are assessed with RT-QPCR. GAPDH is used as a housekeeping gene. Student’s t-test, *P<0.05, **P<0.005, ***P<0.0005, #P<0.0001. G, Ki67 staining and quantification of fluorescence positive cells in tumors from nude mice. DAPI was used to stain nuclear DNA. Scale bar = 40 μm. Student’s t-test, #P<0.0001. H, CHOP staining and quantification of fluorescence positive cells in tumors from nude mice. Scale bar = 35 μm. Student’s t-test, #P<0.0001. I, H&E staining of tumor, kidney, and liver tissues from the untreated control and Y3-treated nude mice. J, Y3 does not affect body weight of nude mice. K, White blood cell (WBC) count of control and Y3-treated nude mice. L, Platelet count of control and Y3-treated mice. M, Blood urea nitrogen of control and Y3-treated mice assessed by ELISA. N, Urine creatinine of control and Y3-treated mice. N.S., not significant for student’s t-test.
Figure 5.
Figure 5.. Y3 inhibits tumor development in ID8 syngeneic mouse EOC model.
A, Y3 does not affect body weight of wild type C57/BL6 mice. B, H&E staining of kidneys and livers from C57/BL6 mice. C, Y3 delayed abdominal distension in mice, a sign of accumulation of ascites. D, Y3 improved the survival of mice injected with ID8 mouse ovarian cancer cells. E, Representative images of peritoneal tumors in control and Y3-treated mice. F, Total tumor numbers. Student’s t-test, ****P<0.0001. G, Numbers of organs with tumor implants. Student’s t-test, **P<0.005. H, Total tumor weight. Student’s t-test, **P<0.005. I, H&E staining of intraperitoneal tumor tissues from untreated control and Y3-treated C57/BL6 mice. J, Immunofluorescence staining of Ki67, Cd4, and Cd8 in tumor tissues. DAPI was used to stain nuclear DNA. K, Quantification of fluorescence positive cells. Student’s t-test, ***P<0.005, ****P<0.0005.
Figure 6.
Figure 6.. Y3 induces immunogenic cell death in TKO syngeneic mouse EOC model.
A, Flowchart of TKO tumor formation and Y3 treatment. B, Growth curves of tumors formed by TKO mouse ovarian cancer cells in C57BL/6 mice. Two-way ANOVA analysis, n=5. C, Levels of cytokine in mouse plasma samples. Healthy and tumor-bearing mice are both injected with Y3 (5mg/kg, IP once per week) or vehicle. Two-way ANOVA followed by Sidak HSD test, *P<0.05, **P<0.005. D, Flowchart of vaccination assay. Mice in the control group were injected with necrotic TKO cells that were frozen and thawed in liquid nitrogen and at 37°C. The same numbers of TKO cells were treated with 10μM Y3 in vitro for 24 h before they were injected to the left flank of C57BL/6 mice in the test group. One week later, normal live TKO cells were injected to the contralateral flank of all the mice. E, Growth curves of tumors in the right flank of mice. Two-way ANOVA followed by Sidak HSD test, ***P<0.0005, #P<0.0001. F, Immunoprecipitation of HMGB and western blot. A2780 cells are treated with 10 μM Y3 for 48 h. HMGB is precipitated from the culture medium of A2780 cells and detected using anti-HMGB antibody. Albumin was used as a loading control for medium samples. GAPDH was used as a loading control for cell lysate samples. G, HMGB in the culture medium of A2780 cells assessed using ELISA. One-way ANOVA followed by Tukey’s HSD test, *p<0.05, **p<0.005, and #p<0.0001. H, Levels of ATP in cell culture medium of A2780 and KRCH31 cells. Two-way ANOVA followed by Sidak HSD test, n=5, *P<0.05, ***p<0.0005, #p<0.0001. I, Flow cytometry analysis of cell-surface CALR. Cells are treated with 10 μM Y3 for 24 h. Two-way ANOVA followed by Sidak HSD test, n=3, **P<0.005.

Similar articles

Cited by

References

    1. McGee J, Bookman M, Harter P, Marth C, McNeish I, Moore KN, et al. Fifth Ovarian Cancer Consensus Conference: individualized therapy and patient factors. Ann Oncol 2017;28(4):702–10 doi 10.1093/annonc/mdx010. - DOI - PubMed
    1. Hamanishi J, Mandai M, Ikeda T, Minami M, Kawaguchi A, Murayama T, et al. Safety and Antitumor Activity of Anti-PD-1 Antibody, Nivolumab, in Patients With Platinum-Resistant Ovarian Cancer. J Clin Oncol 2015;33(34):4015–22 doi 10.1200/JCO.2015.62.3397. - DOI - PubMed
    1. Matulonis UA, Shapira-Frommer R, Santin AD, Lisyanskaya AS, Pignata S, Vergote I, et al. Antitumor activity and safety of pembrolizumab in patients with advanced recurrent ovarian cancer: results from the phase II KEYNOTE-100 study. Ann Oncol 2019;30(7):1080–7 doi 10.1093/annonc/mdz135. - DOI - PubMed
    1. Zhang W, Sviripa VM, Kril LM, Yu T, Xie Y, Hubbard WB, et al. An Underlying Mechanism of Dual Wnt Inhibition and AMPK Activation: Mitochondrial Uncouplers Masquerading as Wnt Inhibitors. J Med Chem 2019;62(24):11348–58 doi 10.1021/acs.jmedchem.9b01685. - DOI - PMC - PubMed
    1. To MS, Aromataris EC, Castro J, Roberts ML, Barritt GJ, Rychkov GY. Mitochondrial uncoupler FCCP activates proton conductance but does not block store-operated Ca(2+) current in liver cells. Arch Biochem Biophys 2010;495(2):152–8 doi 10.1016/j.abb.2010.01.004. - DOI - PubMed

Publication types