

Mitochondrial carbonic anhydrases are needed for optimal photosynthesis at low CO2 levels in Chlamydomonas
- PMID: 34618049
- PMCID: PMC8566214
- DOI: 10.1093/plphys/kiab351
Mitochondrial carbonic anhydrases are needed for optimal photosynthesis at low CO2 levels in Chlamydomonas
Abstract
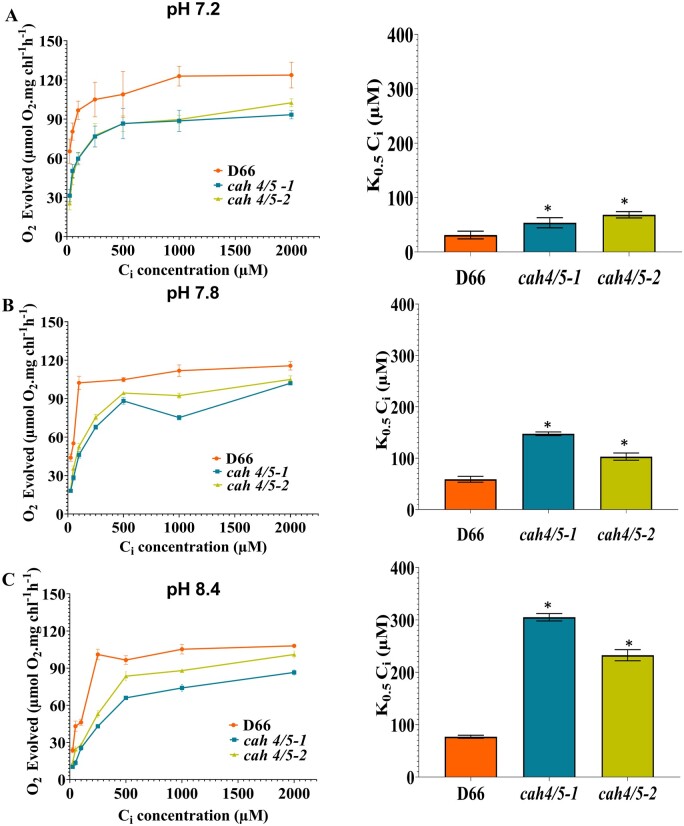
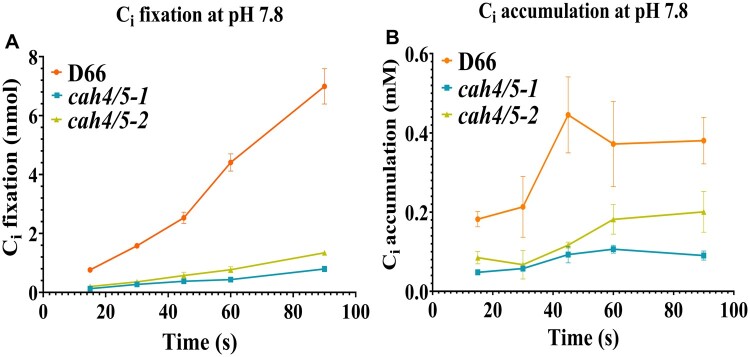
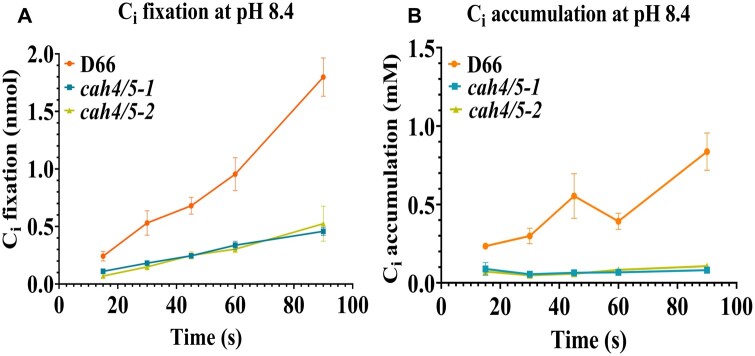
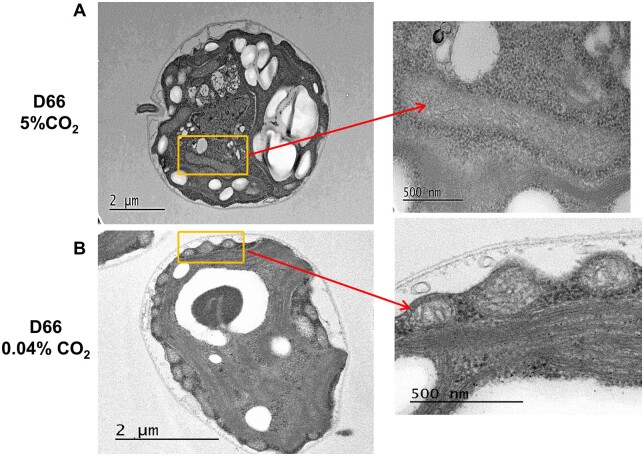
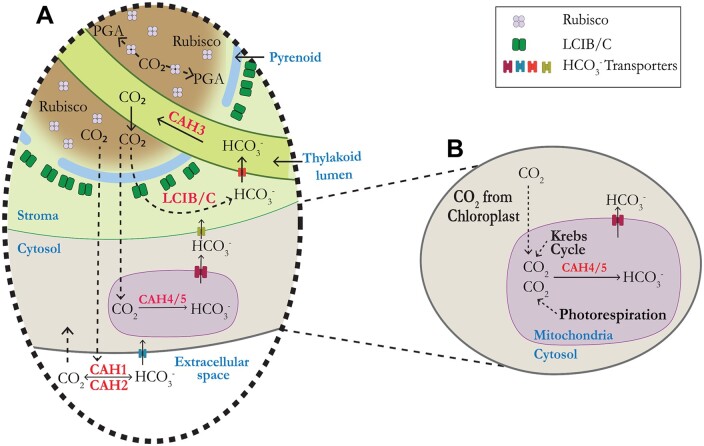
Chlamydomonas reinhardtii can grow photosynthetically using CO2 or in the dark using acetate as the carbon source. In the light in air, the CO2 concentrating mechanism (CCM) of C. reinhardtii accumulates CO2, enhancing photosynthesis. A combination of carbonic anhydrases (CAs) and bicarbonate transporters in the CCM of C. reinhardtii increases the CO2 concentration at Ribulose 1,5-bisphosphate carboxylase oxygenase (Rubisco) in the chloroplast pyrenoid. Previously, CAs important to the CCM have been found in the periplasmic space, surrounding the pyrenoid and inside the thylakoid lumen. Two almost identical mitochondrial CAs, CAH4 and CAH5, are also highly expressed when the CCM is made, but their role in the CCM is not understood. Here, we adopted an RNAi approach to reduce the expression of CAH4 and CAH5 to study their possible physiological functions. RNAi mutants with low expression of CAH4 and CAH5 had impaired rates of photosynthesis under ambient levels of CO2 (0.04% CO2 [v/v] in air). These strains were not able to grow at very low CO2 (<0.02% CO2 [v/v] in air), and their ability to accumulate inorganic carbon (Ci = CO2 + HCO3-) was reduced. At low CO2 concentrations, the CCM is needed to both deliver Ci to Rubisco and to minimize the leak of CO2 generated by respiration and photorespiration. We hypothesize that CAH4 and CAH5 in the mitochondria convert the CO2 released from respiration and photorespiration as well as the CO2 leaked from the chloroplast to HCO3- thus "recapturing" this potentially lost CO2.
© American Society of Plant Biologists 2021. All rights reserved. For permissions, please email: journals.permissions@oup.com.
Figures
Similar articles
-
Thylakoid localized bestrophin-like proteins are essential for the CO2 concentrating mechanism of Chlamydomonas reinhardtii.Proc Natl Acad Sci U S A. 2019 Aug 20;116(34):16915-16920. doi: 10.1073/pnas.1909706116. Epub 2019 Aug 7. Proc Natl Acad Sci U S A. 2019. PMID: 31391312 Free PMC article.
-
Light and low-CO2-dependent LCIB-LCIC complex localization in the chloroplast supports the carbon-concentrating mechanism in Chlamydomonas reinhardtii.Plant Cell Physiol. 2010 Sep;51(9):1453-68. doi: 10.1093/pcp/pcq105. Epub 2010 Jul 21. Plant Cell Physiol. 2010. PMID: 20660228
-
Chloroplast-mediated regulation of CO2-concentrating mechanism by Ca2+-binding protein CAS in the green alga Chlamydomonas reinhardtii.Proc Natl Acad Sci U S A. 2016 Nov 1;113(44):12586-12591. doi: 10.1073/pnas.1606519113. Epub 2016 Oct 17. Proc Natl Acad Sci U S A. 2016. PMID: 27791081 Free PMC article.
-
Orchestral manoeuvres in the light: crosstalk needed for regulation of the Chlamydomonas carbon concentration mechanism.J Exp Bot. 2021 Jun 22;72(13):4604-4624. doi: 10.1093/jxb/erab169. J Exp Bot. 2021. PMID: 33893473 Free PMC article. Review.
-
The CO2 concentrating mechanism and photosynthetic carbon assimilation in limiting CO2 : how Chlamydomonas works against the gradient.Plant J. 2015 May;82(3):429-448. doi: 10.1111/tpj.12829. Plant J. 2015. PMID: 25765072 Review.
Cited by
-
Adapting from Low to High: An Update to CO2-Concentrating Mechanisms of Cyanobacteria and Microalgae.Plants (Basel). 2023 Apr 6;12(7):1569. doi: 10.3390/plants12071569. Plants (Basel). 2023. PMID: 37050194 Free PMC article. Review.
-
A Rapid Method for Detecting Normal or Modified Plant and Algal Carbonic Anhydrase Activity Using Saccharomyces cerevisiae.Plants (Basel). 2022 Jul 20;11(14):1882. doi: 10.3390/plants11141882. Plants (Basel). 2022. PMID: 35890517 Free PMC article.
-
Dramatic Changes in Mitochondrial Subcellular Location and Morphology Accompany Activation of the CO2 Concentrating Mechanism.bioRxiv [Preprint]. 2024 Mar 27:2024.03.25.586705. doi: 10.1101/2024.03.25.586705. bioRxiv. 2024. Update in: Proc Natl Acad Sci U S A. 2024 Oct 22;121(43):e2407548121. doi: 10.1073/pnas.2407548121. PMID: 38585955 Free PMC article. Updated. Preprint.
-
A pyrenoid-localized protein SAGA1 is necessary for Ca2+-binding protein CAS-dependent expression of nuclear genes encoding inorganic carbon transporters in Chlamydomonas reinhardtii.Photosynth Res. 2023 May;156(2):181-192. doi: 10.1007/s11120-022-00996-7. Epub 2023 Jan 19. Photosynth Res. 2023. PMID: 36656499
-
Visualizing the dynamics of plant energy organelles.Biochem Soc Trans. 2023 Dec 20;51(6):2029-2040. doi: 10.1042/BST20221093. Biochem Soc Trans. 2023. PMID: 37975429 Free PMC article.
References
Publication types
MeSH terms
Substances
LinkOut - more resources
Full Text Sources
