Integrated analysis of patients with KEAP1/NFE2L2/CUL3 mutations in lung adenocarcinomas
- PMID: 34617407
- PMCID: PMC8633244
- DOI: 10.1002/cam4.4338
Integrated analysis of patients with KEAP1/NFE2L2/CUL3 mutations in lung adenocarcinomas
Abstract
Objectives: To explore the clinical features, molecular characteristics, and immune landscape of lung adenocarcinoma patients with KEAP1/NFE2L2/CUL3 mutations.
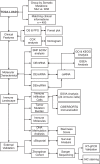
Methods: The multi-omics data from the GDC-TCGA LUAD project of The Cancer Genome Atlas (TCGA) database were downloaded from the Xena browser. The estimate of the immune infiltration was implemented by using the GSVA analysis and CIBERSORT. The status of KEAP1/NFE2L2/CUL3 mutation in 50 LUAD samples of our department was detected by using Sanger sequencing, following the relative expression level of differentially expressed genes (DEGs), miRNAs (DEmiRNAs), and lncRNAs (DElncRNAs) was validated by IHC and real-time quantitative polymerase chain reaction (RT-qPCR).
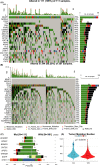
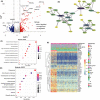
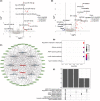
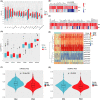
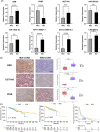
Results: The Kaplan-Meier and multivariable Cox regression analyses demonstrated that KEAP1/NFE2L2/CUL3 mutations had independent prognostic value for OS and PFS in LUAD patients. The differential analysis detected 207 upregulated genes (like GSR/UGT1A6) and 447 downregulated genes (such as PIGR). GO, KEGG, and GSEA analyses demonstrated that DEGs were enriched in glutamate metabolism and the immune response. The constructed ceRNA network shows the linkage of differential lncRNAs and mRNAs. Three hundred and nine somatic mutations were detected, alterations in immune infiltration DNA methylations and stemness scores were also founded between the two groups. Eight mutated LUAD patients were detected by Sanger DNA sequencing in 50 surgical patients. GSR and UGT1A6 were validated to express higher in the Mut group, whereas the expression of PIGR was restrained. Furthermore, the IHC staining conducted on paraffin-embedded tissue emphasizes the consistency of our result.
Conclusion: This research implemented the comprehensive analysis of KEAP1/NFE2L2/CUL3 somatic mutations in the LUAD patients. Compared with the wild type of LUAD patients, the Mut group shows a large difference in clinical features, RNA sequence, DNA methylation, and immune infiltrations, indicating complex mechanism oncogenesis and also reveals potential therapeutic targets.
Keywords: cullin 3 (CUL3); kelch-like ECH-associated protein 1 (KEAP1); lung adenocarcinoma (LUAD); mutation; nuclear factor erythroid 2-like 2 (NFE2L2).
© 2021 The Authors. Cancer Medicine published by John Wiley & Sons Ltd.
Conflict of interest statement
The authors declare no competing interests in this work.
Figures

Similar articles
-
A comparative analysis indicates SLC7A11 expression regulate the prognostic value of KEAP1-NFE2L2-CUL3 mutations in human uterine corpus endometrial carcinoma.Free Radic Biol Med. 2024 Sep;222:223-228. doi: 10.1016/j.freeradbiomed.2024.06.008. Epub 2024 Jun 13. Free Radic Biol Med. 2024. PMID: 38876457
-
Impact of KEAP1/NFE2L2/CUL3 mutations on duration of response to EGFR tyrosine kinase inhibitors in EGFR mutated non-small cell lung cancer.Lung Cancer. 2019 Aug;134:42-45. doi: 10.1016/j.lungcan.2019.05.002. Epub 2019 May 3. Lung Cancer. 2019. PMID: 31319993
-
Gene-expression signature regulated by the KEAP1-NRF2-CUL3 axis is associated with a poor prognosis in head and neck squamous cell cancer.BMC Cancer. 2018 Jan 6;18(1):46. doi: 10.1186/s12885-017-3907-z. BMC Cancer. 2018. PMID: 29306329 Free PMC article.
-
Clinical Implications of KEAP1-NFE2L2 Mutations in NSCLC.J Thorac Oncol. 2021 Mar;16(3):395-403. doi: 10.1016/j.jtho.2020.11.015. Epub 2020 Dec 8. J Thorac Oncol. 2021. PMID: 33307193 Review.
-
CRL3s: The BTB-CUL3-RING E3 Ubiquitin Ligases.Adv Exp Med Biol. 2020;1217:211-223. doi: 10.1007/978-981-15-1025-0_13. Adv Exp Med Biol. 2020. PMID: 31898230 Review.
Cited by
-
Dissection of the cell communication interactions in lung adenocarcinoma identified a prognostic model with immunotherapy efficacy assessment and a potential therapeutic candidate gene ITGB1.Heliyon. 2024 Aug 22;10(17):e36599. doi: 10.1016/j.heliyon.2024.e36599. eCollection 2024 Sep 15. Heliyon. 2024. PMID: 39263115 Free PMC article.
-
A Novel Prognostic Signature Revealed the Interaction of Immune Cells in Tumor Microenvironment Based on Single-Cell RNA Sequencing for Lung Adenocarcinoma.J Immunol Res. 2022 Jul 1;2022:6555810. doi: 10.1155/2022/6555810. eCollection 2022. J Immunol Res. 2022. PMID: 35812244 Free PMC article.
-
Molecular classification reveals the sensitivity of lung adenocarcinoma to radiotherapy and immunotherapy: multi-omics clustering based on similarity network fusion.Cancer Immunol Immunother. 2024 Mar 2;73(4):71. doi: 10.1007/s00262-024-03657-x. Cancer Immunol Immunother. 2024. PMID: 38430394 Free PMC article.
-
Multi-omics consensus portfolio to refine the classification of lung adenocarcinoma with prognostic stratification, tumor microenvironment, and unique sensitivity to first-line therapies.Transl Lung Cancer Res. 2022 Nov;11(11):2243-2260. doi: 10.21037/tlcr-22-775. Transl Lung Cancer Res. 2022. PMID: 36519025 Free PMC article.
-
Identification of Two Subtypes and Prognostic Characteristics of Lung Adenocarcinoma Based on Pentose Phosphate Metabolic Pathway-Related Long Non-coding RNAs.Front Public Health. 2022 Jun 21;10:902445. doi: 10.3389/fpubh.2022.902445. eCollection 2022. Front Public Health. 2022. PMID: 35801241 Free PMC article.
References
Publication types
MeSH terms
Substances
LinkOut - more resources
Full Text Sources
Other Literature Sources
Research Materials
Miscellaneous

