

Opposite Outcomes of the Within-Host Competition between High- and Low-Pathogenic H5N8 Avian Influenza Viruses in Chickens Compared to Ducks
- PMID: 34613804
- PMCID: PMC8754203
- DOI: 10.1128/JVI.01366-21
Opposite Outcomes of the Within-Host Competition between High- and Low-Pathogenic H5N8 Avian Influenza Viruses in Chickens Compared to Ducks
Abstract
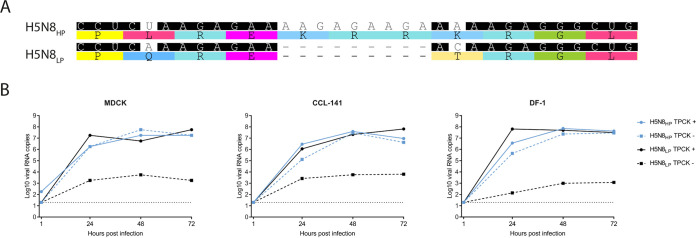
Highly pathogenic avian influenza viruses (HPAIV) emerge from low-pathogenic avian influenza viruses (LPAIV) through the introduction of basic amino acids at the hemagglutinin (HA) cleavage site. Following viral evolution, the newly formed HPAIV likely represents a minority variant within the index host, predominantly infected with the LPAIV precursor. Using reverse genetics-engineered H5N8 viruses differing solely at the HA cleavage, we tested the hypothesis that the interaction between the minority HPAIV and the majority LPAIV could modulate the risk of HPAIV emergence and that the nature of the interaction could depend on the host species. In chickens, we observed that the H5N8LP increased H5N8HP replication and pathogenesis. In contrast, the H5N8LP antagonized H5N8HP replication and pathogenesis in ducks. Ducks mounted a more potent antiviral innate immune response than chickens against the H5N8LP, which correlated with H5N8HP inhibition. These data provide experimental evidence that HPAIV may be more likely to emerge in chickens than in ducks and underscore the importance of within-host viral variant interactions in viral evolution. IMPORTANCE Highly pathogenic avian influenza viruses represent a threat to poultry production systems and to human health because of their impact on food security and because of their zoonotic potential. It is therefore crucial to better understand how these viruses emerge. Using a within-host competition model between high- and low-pathogenic avian influenza viruses, we provide evidence that highly pathogenic avian influenza viruses could be more likely to emerge in chickens than in ducks. These results have important implications for highly pathogenic avian influenza virus emergence prevention, and they underscore the importance of within-host viral variant interactions in virus evolution.
Keywords: avian viruses; emergence; evolution; highly pathogenic; influenza; low pathogenic.
Figures

Similar articles
-
In Vitro and In Vivo Characterization of H5N8 High-Pathogenicity Avian Influenza Virus Neurotropism in Ducks and Chickens.Microbiol Spectr. 2023 Feb 14;11(1):e0422922. doi: 10.1128/spectrum.04229-22. Epub 2023 Jan 10. Microbiol Spectr. 2023. PMID: 36625654 Free PMC article.
-
Preferential Selection and Contribution of Non-Structural Protein 1 (NS1) to the Efficient Transmission of Panzootic Avian Influenza H5N8 Virus Clades 2.3.4.4A and B in Chickens and Ducks.J Virol. 2021 Aug 25;95(18):e0044521. doi: 10.1128/JVI.00445-21. Epub 2021 Aug 25. J Virol. 2021. PMID: 34160261 Free PMC article.
-
Respiratory disease due to mixed viral infections in poultry flocks in Egypt between 2017 and 2018: Upsurge of highly pathogenic avian influenza virus subtype H5N8 since 2018.Transbound Emerg Dis. 2021 Jan;68(1):21-36. doi: 10.1111/tbed.13281. Epub 2019 Jul 11. Transbound Emerg Dis. 2021. PMID: 31297991
-
The genetics of highly pathogenic avian influenza viruses of subtype H5 in Germany, 2006-2020.Transbound Emerg Dis. 2021 May;68(3):1136-1150. doi: 10.1111/tbed.13843. Epub 2020 Sep 29. Transbound Emerg Dis. 2021. PMID: 32964686 Review.
-
Hemagglutinin Subtype Specificity and Mechanisms of Highly Pathogenic Avian Influenza Virus Genesis.Viruses. 2022 Jul 19;14(7):1566. doi: 10.3390/v14071566. Viruses. 2022. PMID: 35891546 Free PMC article. Review.
Cited by
-
In Vitro and In Vivo Characterization of H5N8 High-Pathogenicity Avian Influenza Virus Neurotropism in Ducks and Chickens.Microbiol Spectr. 2023 Feb 14;11(1):e0422922. doi: 10.1128/spectrum.04229-22. Epub 2023 Jan 10. Microbiol Spectr. 2023. PMID: 36625654 Free PMC article.
-
The feather epithelium contributes to the dissemination and ecology of clade 2.3.4.4b H5 high pathogenicity avian influenza viruses in ducks.Emerg Microbes Infect. 2023 Dec;12(2):2272644. doi: 10.1080/22221751.2023.2272644. Epub 2023 Nov 3. Emerg Microbes Infect. 2023. PMID: 37847060 Free PMC article.
-
Viral shedding and environmental dispersion of two clade 2.3.4.4b H5 high pathogenicity avian influenza viruses in experimentally infected mule ducks: implications for environmental sampling.Vet Res. 2024 Aug 12;55(1):100. doi: 10.1186/s13567-024-01357-z. Vet Res. 2024. PMID: 39135123 Free PMC article.
-
High and low pathogenicity avian influenza virus discrimination and prediction based on volatile organic compounds signature by SIFT-MS: a proof-of-concept study.Sci Rep. 2024 Jul 24;14(1):17051. doi: 10.1038/s41598-024-67219-y. Sci Rep. 2024. PMID: 39048690 Free PMC article.
-
High pathogenicity avian influenza virus emergence: Blame it on chickens or on humans raising chickens?PLoS Pathog. 2024 Oct 16;20(10):e1012608. doi: 10.1371/journal.ppat.1012608. eCollection 2024 Oct. PLoS Pathog. 2024. PMID: 39413054 Free PMC article. No abstract available.
References
-
- More S, Bicout D, Bøtner A, Butterworth A, Calistri P, Depner K, Edwards S, Garin-Bastuji B, Good M, Gortázar Schmidt C, Michel V, Miranda MA, Nielsen SS, Raj M, Sihvonen L, Spoolder H, Thulke H-H, Velarde A, Willeberg P, Winckler C, Breed A, Brouwer A, Guillemain M, Harder T, Monne I, Roberts H, Baldinelli F, Barrucci F, Fabris C, Martino L, Mosbach-Schulz O, Verdonck F, Morgado J, Stegeman JA, EFSA Panel on Animal Health and Welfare (AHAW) . 2017. Avian influenza. EFSA J 15:e04991. 10.2903/j.efsa.2017.4991. - DOI - PMC - PubMed
-
- Böttcher-Friebertshäuser E, Garten W, Matrosovich M, Klenk HD. 2014. The hemagglutinin: a determinant of pathogenicity, p 3–34. In Compans RW, Oldstone MBA (ed), Influenza pathogenesis and control, vol I. Springer International Publishing, Cham, Switzerland. - PubMed
-
- Richard M, Fouchier R, Monne I, Kuiken T. 2017. Mechanisms and risk factors for mutation from low to highly pathogenic avian influenza virus. EFSA Supporting Publications 14:1287E. 10.2903/sp.efsa.2017.EN-1287. - DOI
Publication types
MeSH terms
Substances
LinkOut - more resources
Full Text Sources
Medical
Research Materials
Miscellaneous
