

Correlation of Histomorphometric Changes with Diffusion Tensor Imaging for Evaluation of Blast-Induced Auditory Neurodegeneration in Chinchilla
- PMID: 34605670
- PMCID: PMC8917894
- DOI: 10.1089/neu.2020.7556
Correlation of Histomorphometric Changes with Diffusion Tensor Imaging for Evaluation of Blast-Induced Auditory Neurodegeneration in Chinchilla
Abstract
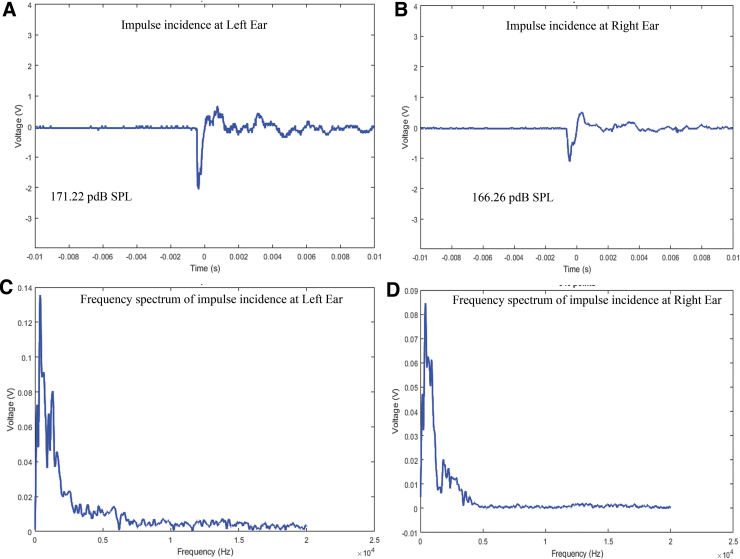
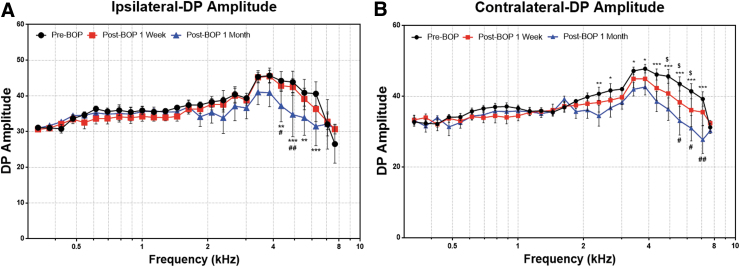
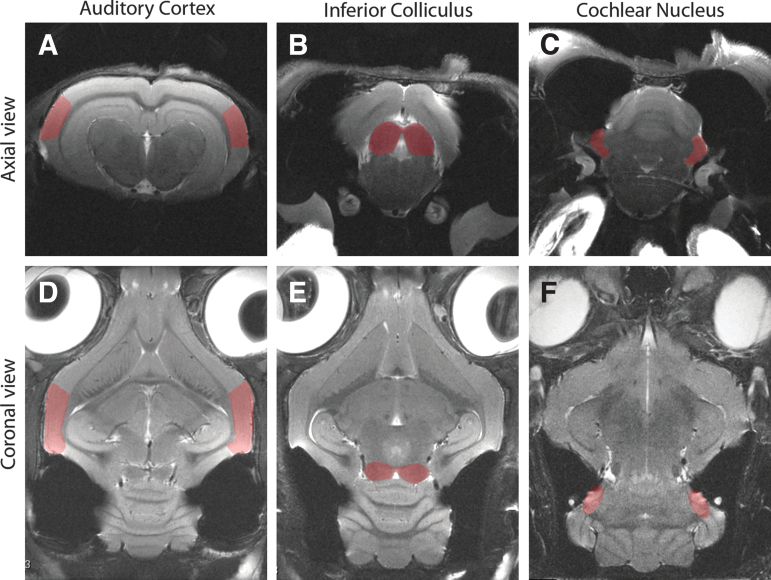
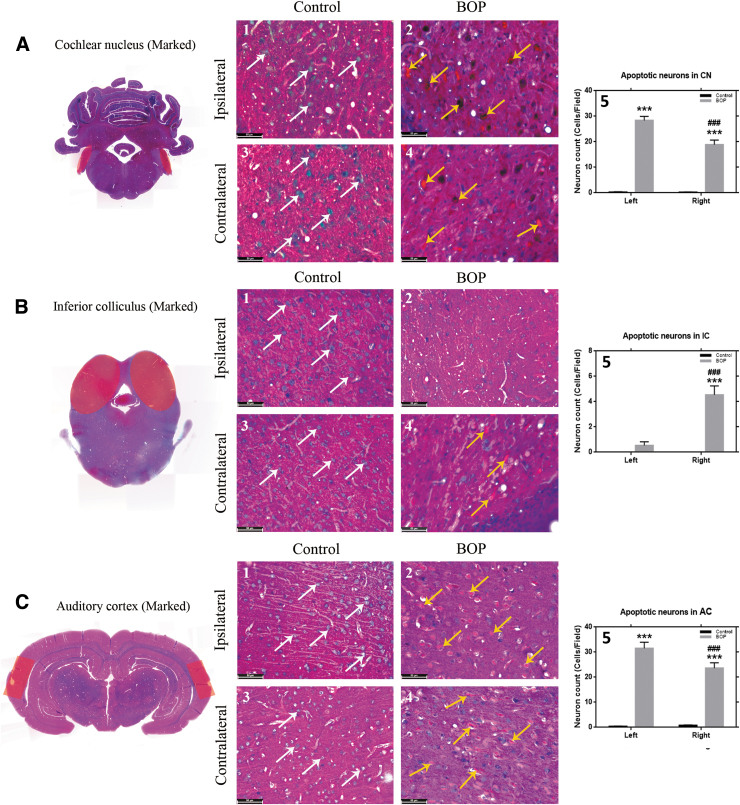
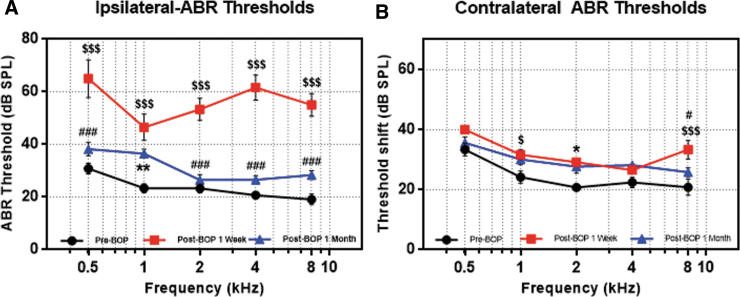
In the present study, we have evaluated the blast-induced auditory neurodegeneration in chinchilla by correlating the histomorphometric changes with diffusion tensor imaging. The chinchillas were exposed to single unilateral blast-overpressure (BOP) at ∼172dB peak sound pressure level (SPL) and the pathological changes were compared at 1 week and 1 month after BOP. The functional integrity of the auditory system was assessed by auditory brainstem response (ABR) and distortion product otoacoustic emissions (DPOAE). The axonal integrity was assessed using diffusion tensor imaging at regions of interests (ROIs) of the central auditory neuraxis (CAN) including the cochlear nucleus (CN), inferior colliculus (IC), and auditory cortex (AC). Post-BOP, cyto-architecture metrics such as viable cells, degenerating neurons, and apoptotic cells were quantified at the CAN ROIs using light microscopic studies using cresyl fast violet, hematoxylin and eosin, and modified Crossmon's trichrome stains. We observed mean ABR threshold shifts of 30- and 10-dB SPL at 1 week and 1 month after BOP, respectively. A similar pattern was observed in DPAOE amplitudes shift. In the CAN ROIs, diffusion tensor imaging studies showed a decreased axial diffusivity in CN 1 month after BOP and a decreased mean diffusivity and radial diffusivity at 1 week after BOP. However, morphometric measures such as decreased viable cells and increased degenerating neurons and apoptotic cells were observed at CN, IC, and AC. Specifically, increased degenerating neurons and reduced viable cells were high on the ipsilateral side when compared with the contralateral side. These results indicate that a single blast significantly damages structural and functional integrity at all levels of CAN ROIs.
Keywords: auditory cortex; auditory neurodegeneration; blast-overpressure; chinchilla; cochlear nucleus; impulse noise exposure; inferior colliculus.
Conflict of interest statement
No competing financial interests exist.
Figures


Similar articles
-
Central and peripheral auditory abnormalities in chinchilla animal model of blast-injury.Hear Res. 2021 Aug;407:108273. doi: 10.1016/j.heares.2021.108273. Epub 2021 May 15. Hear Res. 2021. PMID: 34139381
-
Hearing Damage Induced by Blast Overpressure at Mild TBI Level in a Chinchilla Model.Mil Med. 2020 Jan 7;185(Suppl 1):248-255. doi: 10.1093/milmed/usz309. Mil Med. 2020. PMID: 32074377
-
Differential impact of temporary and permanent noise-induced hearing loss on neuronal cell density in the mouse central auditory pathway.J Neurotrauma. 2010 Aug;27(8):1499-507. doi: 10.1089/neu.2009.1246. J Neurotrauma. 2010. PMID: 20504154
-
Hearing protection and damage mitigation in Chinchillas exposed to repeated low-intensity blasts.Hear Res. 2023 Mar 1;429:108703. doi: 10.1016/j.heares.2023.108703. Epub 2023 Jan 16. Hear Res. 2023. PMID: 36680874 Review.
-
Damage of the auditory system associated with acute blast trauma.Ann Otol Rhinol Laryngol Suppl. 1989 May;140:23-34. doi: 10.1177/00034894890980s506. Ann Otol Rhinol Laryngol Suppl. 1989. PMID: 2497695 Review.
Cited by
-
Poly ADP-Ribose Polymerase-1 inhibition by 3-aminobenzamide recuperates HEI-OC1 auditory hair cells from blast overpressure-induced cell death.Front Cell Dev Biol. 2023 Mar 6;11:1047308. doi: 10.3389/fcell.2023.1047308. eCollection 2023. Front Cell Dev Biol. 2023. PMID: 36949771 Free PMC article.
References
-
- Agoston, D., Arun, P., Bellgowan, P., Broglio, S., Cantu, R., Cook, D., da Silva, U.O., Dickstein, D., Elder, G., Fudge, E., Gandy, S., Gill, J., Glenn, J.F., Gupta, R.K., Hinds, S., Hoffman, S., Lattimore, T., Lin, A., Lu, K.P., Maroon, J., Okonkwo, D., Perl, D., Robinson, M., Rosen, C., and Smith, D. (2017). Military blast injury and chronic neurodegeneration: research presentations from the 2015 International State-of-the-Science Meeting. J. Neurotrauma 34, S6–S17. - PMC - PubMed
-
- Chen, C., Zhou, C., Cavanaugh, J.M., Kallakuri, S., Desai, A., Zhang, L., and King, A.I. (2017). Quantitative electroencephalography in a swine model of blast-induced brain injury. Brain Inj. 31, 120-126. - PubMed
-
- Chen, T., Smith, K., Jiang, S., Zhang, T., and Gan, R.Z. (2019). Progressive hearing damage after exposure to repeated low-intensity blasts in chinchillas. Hear. Res. 378, 33–42. - PubMed
Publication types
MeSH terms
Grants and funding
LinkOut - more resources
Full Text Sources
Medical
Research Materials
Miscellaneous
