. 2021 Sep 16:12:705646.
doi: 10.3389/fimmu.2021.705646. eCollection 2021.

On Deep Landscape Exploration of COVID-19 Patients Cells and Severity Markers

Affiliations

On Deep Landscape Exploration of COVID-19 Patients Cells and Severity Markers

Aarón Vázquez-Jiménez et al. Front Immunol. .

Abstract

COVID-19 is a disease with a spectrum of clinical responses ranging from moderate to critical. To study and control its effects, a large number of researchers are focused on two substantial aims. On the one hand, the discovery of diverse biomarkers to classify and potentially anticipate the disease severity of patients. These biomarkers could serve as a medical criterion to prioritize attention to those patients with higher prone to severe responses. On the other hand, understanding how the immune system orchestrates its responses in this spectrum of disease severities is a fundamental issue required to design new and optimized therapeutic strategies. In this work, using single-cell RNAseq of bronchoalveolar lavage fluid of nine patients with COVID-19 and three healthy controls, we contribute to both aspects. First, we presented computational supervised machine-learning models with high accuracy in classifying the disease severity (moderate and severe) in patients with COVID-19 starting from single-cell data from bronchoalveolar lavage fluid. Second, we identified regulatory mechanisms from the heterogeneous cell populations in the lungs microenvironment that correlated with different clinical responses. Given the results, patients with moderate COVID-19 symptoms showed an activation/inactivation profile for their analyzed cells leading to a sequential and innocuous immune response. In comparison, severe patients might be promoting cytotoxic and pro-inflammatory responses in a systemic fashion involving epithelial and immune cells without the possibility to develop viral clearance and immune memory. Consequently, we present an in-depth landscape analysis of how transcriptional factors and pathways from these heterogeneous populations can regulate their expression to promote or restrain an effective immune response directly linked to the patients prognosis.

Keywords: COVID-19; cell heterogeneity; immune landscape; immune system; machine-learning; single-cell analysis.


Conflict of interest statement

The authors declare that the research was conducted in the absence of any commercial or financial relationships that could be construed as a potential conflict of interest.

Figures

Figure 1
Figure 1
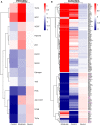
Differences in cell types among patients with diverse infection severity. (A) Umap projection of single cell data showing diverse cell types identified based on biomarkers (Table S1). The inset shows the uMAP projection and separation for the T & NK group. (B) Heatmap showing differentially expressed genes of clusters (columns) used to identify the cell types (rows): EPI, Epithelial cells; MON, monocytes; MP, macrophages; NK, natural killers cells; DC, dendritic cells; T, T cells; B, B cells; NEU, neutrophils. Rows dividers are related to each cell type, and the column groups set the cluster associated to each cell type. Colorbar shows the genes normalized expression values. (C) Boxplot for every cell-type identified, proportions of each cell type among healthy controls, moderate and severe patients.
Figure 2
Figure 2
Gene signature able to classify single-cell data from moderate and severe patients. Gene signature able to classify single-cell data from moderate and severe patients. (A) Confusion matrix of a realization. Each section shows the number of cells classified in each category. Dark blue sections indicate the number of cells correctly categorized. (B) Venn diagram of the relevant genes found on the five realizations in the resampling process, numbers stand for genes shared across realizations. Eight genes were found in cross-validation analysis. (C) SHAP plot of one realization. In the figure, we depicted the first twenty genes with higher contribution to the classification of moderate and severe patients. We have ordered the genes from high to low relevance from top to bottom. Blue and red colors represent low and higher gene expression, respectively. Larger positive values in the SHAP axis set the gene relevance to classify severe patients, whereas negative values set the gene relevance for moderate patients. (D) Validation confusion matrix. Each section shows the number of cells classified in each category. Dark blue sections indicate the number of cells correctly categorized.
Figure 3
Figure 3
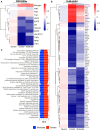
Pathways and transcription factors dysregulated on epithelial cells among patients. (A) Changes in the pathways activation/inactivation identified by PROGENY analysis. White boxes indicate no change of the pathways in the group of patients respectively. (B) Transcription factors inferred by DoRothEA algorithm. Colorbar is related to activation/inactivation values. (C) Pathway Enrichment Analysis, the normalized enrichment score (NES) value represents the activity status within the disease severity conditions. Blue and red bars relate NES values for the moderate and severe patients, respectively.
Figure 4
Figure 4
Epithelial cells diversity analysis. (A) Umap projection of epithelial cells data showing the five cell subtypes identified based on biomarkers: ciliated, secretory, squamous, alveolar type I (AT1), and alveolar type II (AT2) (Table S2). (B) Proportions of the epithelial subtypes among healthy controls, moderate and severe patients. (C) Pathways activation/inactivation analysis with PROGENY for the epithelial cells subtypes considering health status. (D) Activation/inactivation analysis considering health status for the TFs discussed on the whole-epithelial analysis (TFs denoted in purple along with Figure 3B). Colorbar is related to activation (red) and inactivation (blue) values. Ctr, Mod, and Svr stand for healthy control, moderate and severe patients.
Figure 5
Figure 5
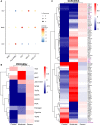
Gene expression and inferred transcriptional factor activities of monocytes among patients. (A) Expression of several marker genes across patients, the point size and colorbar are related to the percentage of cells that express a gene and the average expression, respectively. (B) Predicted pathway activity among patients. (C) Transcriptional factor activity of monocytes inferred using single cell data. Colorbar is related to activation (red) and inactivation (blue) values.
Figure 6
Figure 6
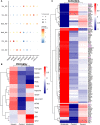
Differential macrophage activity among patients. (A) Expression levels of inflammatory and fibrotic related genes, point size and colorbar represent the percentage of cells that express a gene and the average expression, respectively. (B) Pathway differential analysis among patients. (C) Transcription factors altered on macrophages among disease severity. Colorbar is related to activation/inactivation values. M1 stands for macrophage type I and M2 for macrophages type II.
Figure 7
Figure 7
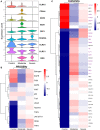
TFs associated with the disease severity in NK cells. (A) Violin plots for several markers for the healthy controls, moderate and severe patients. (B) Resulting Heatmap from PROGENy analysis. Colorbar sets the activation (red) and inactivation (blue) values. (C) Resulting Heatmap from DoROthEA analysis.
Figure 8
Figure 8
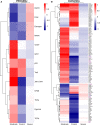
TFs associated with the disease severity in Dendritic cells. (A) Resulting Heatmap from DoROthEA analysis. (B) Resulting Heatmap from PROGENy analysis. Colorbar sets the activation (red) and inactivation (blue) values.
Figure 9
Figure 9
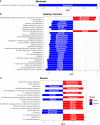
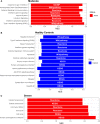
Pathway Enrichment Analysis across various databases. Activity status of the TFs in a particular pathway found by DoROthEA across the disease severity in Dendritic Cells. (A) GSEA in moderate patients. (B) GSEA in healthy controls. (C) GSEA in severe patients. The normalized enrichment score (NES) value represents the activity status within the disease severity conditions, a positive value for active pathways (red), and a negative value for inactive pathways (blue). The dataset for every pathway (rows) is indicated inside the colored bar.
Figure 10
Figure 10
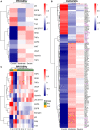
Dysregulated pathways and TFs in T cells. (A) Pathways activations results (PROGENy) according to health status. (B) TF results (DoROthEA) according to health status. Green square highlights those genes only activated on T-NK cells from severe patients. (C) Progeny analysis using mixing data of T and NK cells, green and orange groups are related to a pro and anti-distress response, respectively. Colorbar is related to activation (red) and inactivation (blue) values.
Figure 11
Figure 11
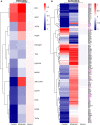
TFs associated with the disease severity in B cells. (A) Resulting Heatmap from DoROthEA analysis. (B) Resulting Heatmap from PROGENy analysis. Colorbar sets the activation (red) and inactivation (blue) values.
Figure 12
Figure 12
Pathway Enrichment Analysis across various databases. Activity status of the TFs in a particular pathway found by DoROthEA across the disease severity in B-cells. (A) GSEA in moderate patients. (B) GSEA in healthy controls. (C) GSEA in severe patients. The normalized enrichment score (NES) value represents the activity status within the disease severity conditions, a positive value for active pathways (red), and a negative value for inactive pathways (blue). The dataset for every pathway (rows) is indicated inside the colored bar.
Figure 13
Figure 13
TFs associated with the disease severity in neutrophils. (A) Resulting Heatmap from DoROthEA analysis. (B) Resulting Heatmap from PROGENy analysis. Colorbar sets the activation (red) and inactivation (blue) values.
Figure 14
Figure 14
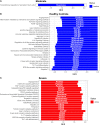
Pathway Enrichment Analysis across various databases. Activity status of the TFs in a particular pathway found by DoROthEA across the disease severity in Neutrophils. (A) GSEA in moderate patients. (B) GSEA in healthy controls. (C) GSEA in severe patients. The normalized enrichment score (NES) value represents the activity status within the disease severity conditions, a positive value for active pathways (red), and a negative value for inactive pathways (blue). The dataset for every pathway (rows) is indicated inside the colored bar.

Similar articles

Cited by

References

    1. Liao M, Liu Y, Yuan J, Wen Y, Xu G, Zhao J, et al. . Single-Cell Landscape of Bronchoalveolar Immune Cells in Patients With COVID-19. Nat Med (2020) 26:842–4. doi: 10.1038/s41591-020-0901-9 - DOI - PubMed
    1. Gautier EL, Shay T, Miller J, Greter M, Jakubzick C, Ivanov S, et al. . Gene-Expression Profiles and Transcriptional Regulatory Pathways That Underlie the Identity and Diversity of Mouse Tissue Macrophages. Nat Immunol (2012) 13:1118–28. doi: 10.1038/ni.2419 - DOI - PMC - PubMed
    1. Bost P, Giladi A, Liu Y, Bendjelal Y, Xu G, David E, et al. . Host-Viral Infection Maps Reveal Signatures of Severe COVID-19 Patients. Cell (2020) 181:1475–88.e12. doi: 10.1016/j.cell.2020.05.006 - DOI - PMC - PubMed
    1. Valyaeva AA, Zharikova AA, Kasianov AS, Vassetzky YS, Sheval EV. Expression of SARS-CoV-2 Entry Factors in Lung Epithelial Stem Cells and its Potential Implications for COVID-19. Sci Rep (2020) 10:17772. doi: 10.1038/s41598-020-74598-5 - DOI - PMC - PubMed
    1. Zhu L, Yang P, Zhao Y, Zhuang Z, Wang Z, Song R, et al. . Single-Cell Sequencing of Peripheral Mononuclear Cells Reveals Distinct Immune Response Landscapes of COVID-19 and Influenza Patients. Immunity (2020) 53:685–96.e3. doi: 10.1016/j.immuni.2020.07.009 - DOI - PMC - PubMed

MeSH terms