Tissue clearing and 3D imaging in developmental biology
- PMID: 34596666
- PMCID: PMC8497915
- DOI: 10.1242/dev.199369
Tissue clearing and 3D imaging in developmental biology
Abstract
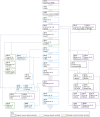
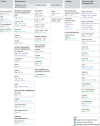
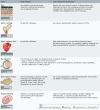
Tissue clearing increases the transparency of late developmental stages and enables deep imaging in fixed organisms. Successful implementation of these methodologies requires a good grasp of sample processing, imaging and the possibilities offered by image analysis. In this Primer, we highlight how tissue clearing can revolutionize the histological analysis of developmental processes and we advise on how to implement effective clearing protocols, imaging strategies and analysis methods for developmental biology.
Keywords: 3D imaging; Light-sheet microscopy; Tissue clearing.
© 2021. Published by The Company of Biologists Ltd.
Conflict of interest statement
Competing interests The authors declare no competing or financial interests.
Figures


Similar articles
-
Successful 3D imaging of cleared biological samples with light sheet fluorescence microscopy.J Cell Biol. 2023 Nov 6;222(11):e202307143. doi: 10.1083/jcb.202307143. Epub 2023 Oct 17. J Cell Biol. 2023. PMID: 37847528 Free PMC article. Review.
-
Whole-Brain Single-Cell Imaging and Analysis of Intact Neonatal Mouse Brains Using MRI, Tissue Clearing, and Light-Sheet Microscopy.J Vis Exp. 2022 Aug 1;(186):10.3791/64096. doi: 10.3791/64096. J Vis Exp. 2022. PMID: 35969091 Free PMC article.
-
A survey of clearing techniques for 3D imaging of tissues with special reference to connective tissue.Prog Histochem Cytochem. 2016 Aug;51(2):9-23. doi: 10.1016/j.proghi.2016.04.001. Epub 2016 Apr 14. Prog Histochem Cytochem. 2016. PMID: 27142295 Review.
-
Imaging the mammary gland and mammary tumours in 3D: optical tissue clearing and immunofluorescence methods.Breast Cancer Res. 2016 Dec 13;18(1):127. doi: 10.1186/s13058-016-0754-9. Breast Cancer Res. 2016. PMID: 27964754 Free PMC article.
-
Selective plane illumination microscopy techniques in developmental biology.Development. 2009 Jun;136(12):1963-75. doi: 10.1242/dev.022426. Development. 2009. PMID: 19465594 Free PMC article. Review.
Cited by
-
T-CLEARE: a pilot community-driven tissue clearing protocol repository.Front Bioeng Biotechnol. 2024 Sep 16;12:1304622. doi: 10.3389/fbioe.2024.1304622. eCollection 2024. Front Bioeng Biotechnol. 2024. PMID: 39351064 Free PMC article.
-
Comparative Analyses of Clearing Efficacies of Tissue Clearing Protocols by Using a Punching Assisted Clarity Analysis.Front Bioeng Biotechnol. 2022 Jan 28;9:784626. doi: 10.3389/fbioe.2021.784626. eCollection 2021. Front Bioeng Biotechnol. 2022. PMID: 35155401 Free PMC article.
-
Increased Multiplexity in Optical Tissue Clearing-Based Three-Dimensional Immunofluorescence Microscopy of the Tumor Microenvironment by Light-Emitting Diode Photobleaching.Lab Invest. 2024 Jun;104(6):102072. doi: 10.1016/j.labinv.2024.102072. Epub 2024 Apr 26. Lab Invest. 2024. PMID: 38679160 Free PMC article.
-
Combining tissue clearing and Fluoro-Jade C labeling for neurotoxicity assessments.Exp Biol Med (Maywood). 2023 Apr;248(7):605-611. doi: 10.1177/15353702231165009. Epub 2023 May 19. Exp Biol Med (Maywood). 2023. PMID: 37208909 Free PMC article.
-
High-resolution confocal and light-sheet imaging of collagen 3D network architecture in very large samples.iScience. 2023 Mar 20;26(4):106452. doi: 10.1016/j.isci.2023.106452. eCollection 2023 Apr 21. iScience. 2023. PMID: 37020961 Free PMC article.
References
-
- Ariel, P. (2018). UltraMicroscope II – A User Guide [Internet]. Chapel Hill, NC: University of North Carolina at Chapel Hill. 10.17615/C69M15 - PubMed
Publication types
MeSH terms
LinkOut - more resources
Full Text Sources

