. 2021 Sep 27;12(10):882.
doi: 10.1038/s41419-021-04166-w.

TCF4 enhances hepatic metastasis of colorectal cancer by regulating tumor-associated macrophage via CCL2/CCR2 signaling

Affiliations

TCF4 enhances hepatic metastasis of colorectal cancer by regulating tumor-associated macrophage via CCL2/CCR2 signaling

Wei Tu et al. Cell Death Dis. .

Abstract

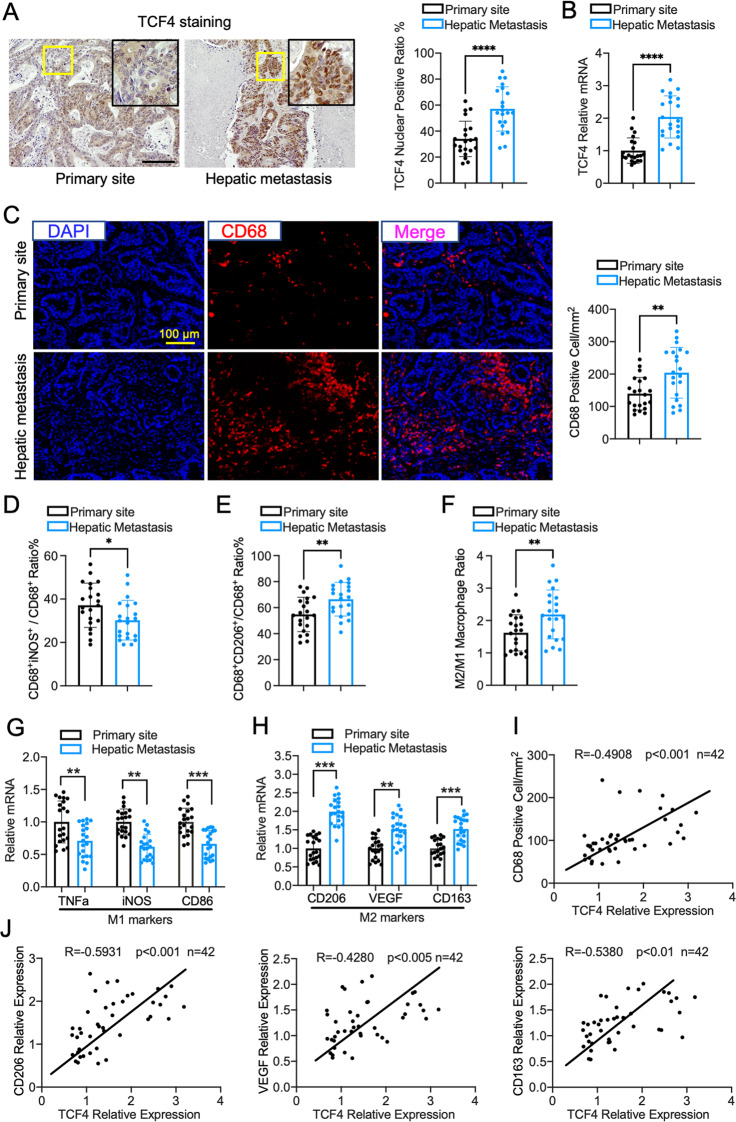
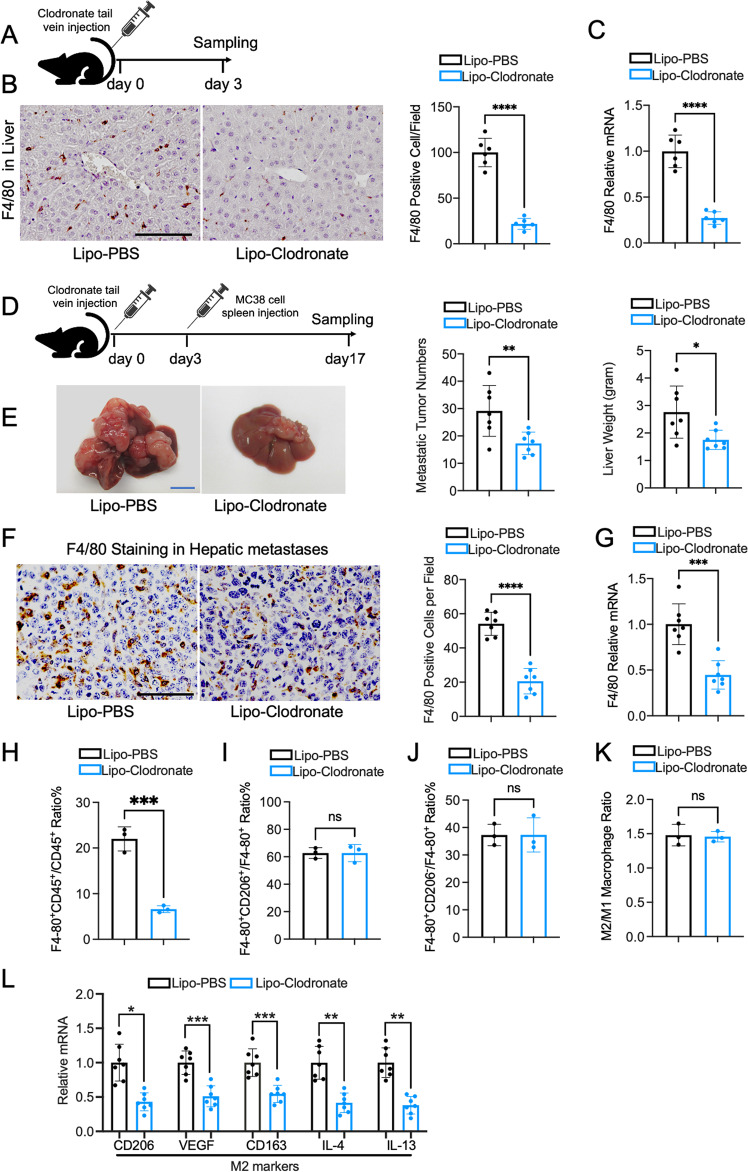
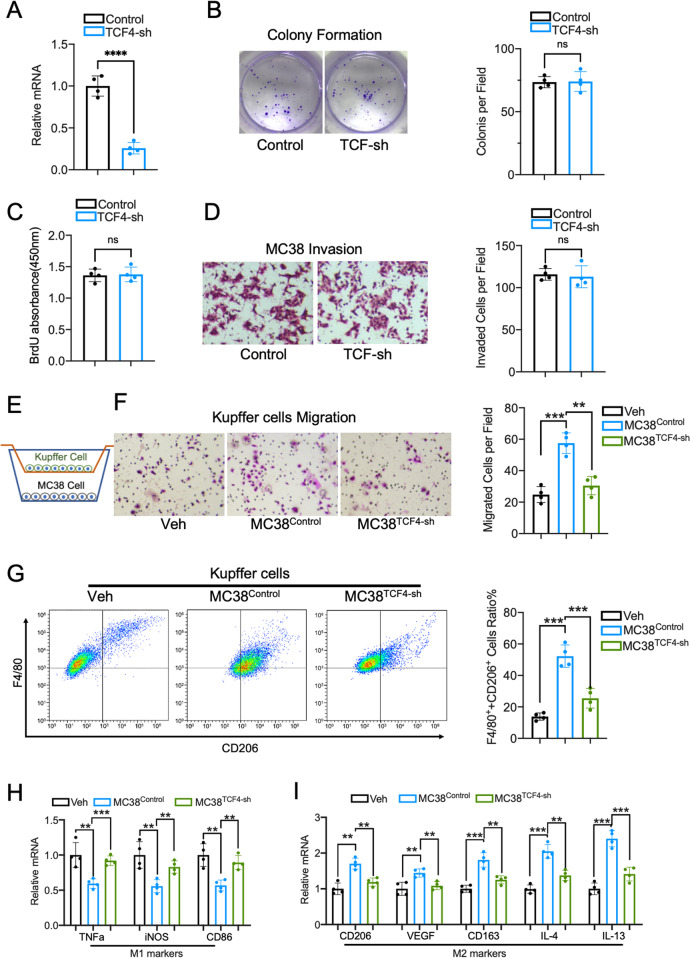
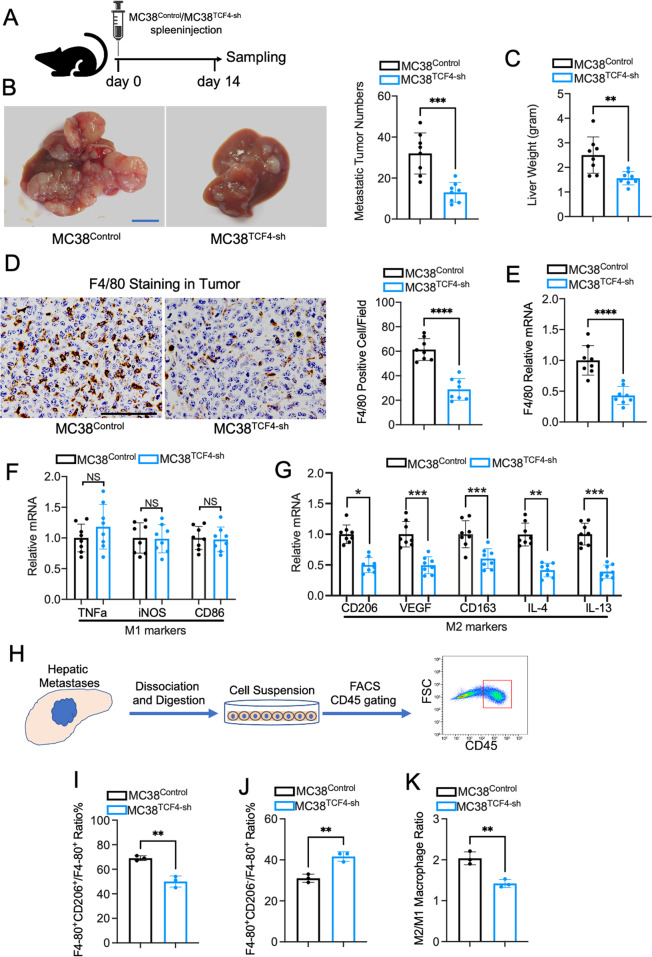
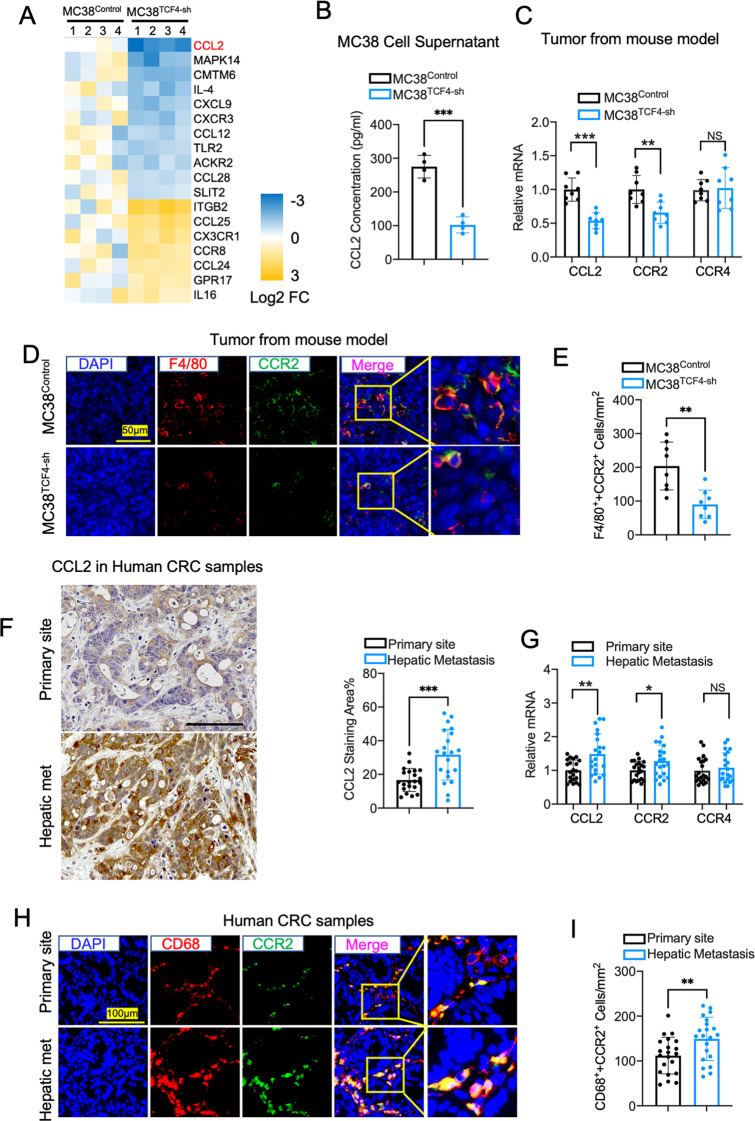
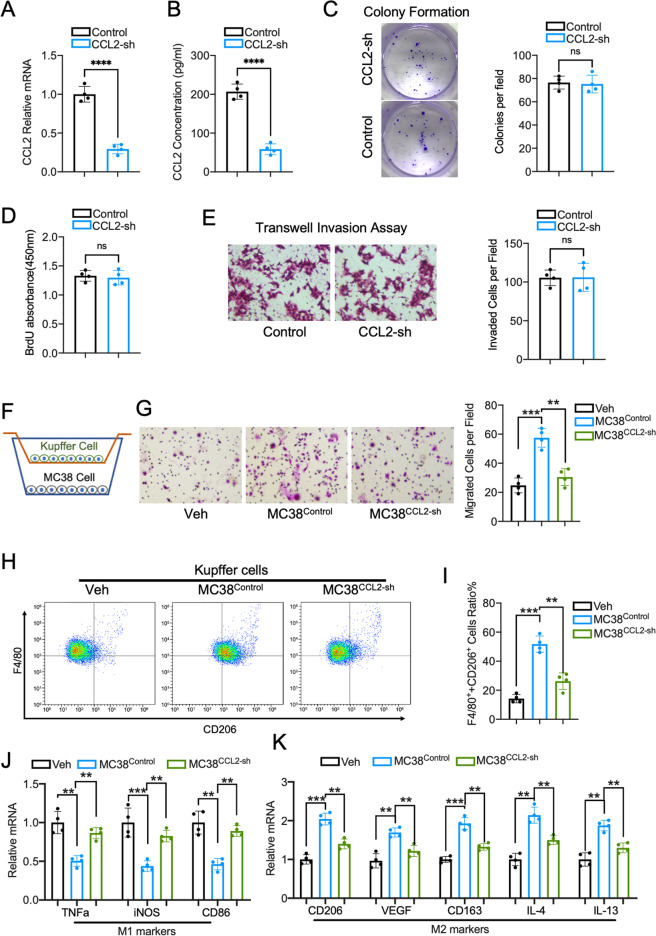
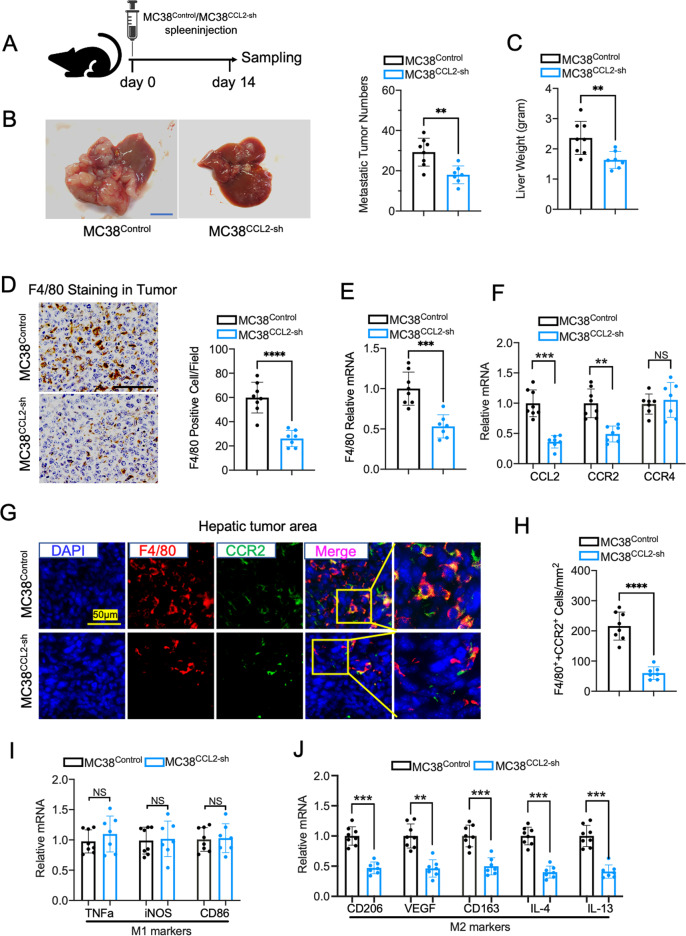
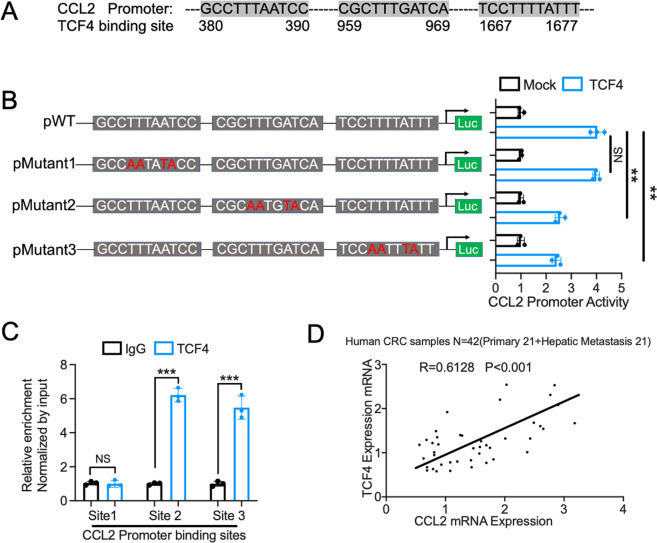
Colorectal cancer (CRC) liver metastasis is a significant clinical problem for which better therapies are urgently needed. Tumor-associated macrophage, a major cell population in the tumor microenvironment, is a known contributor to primary cancer progression and cancer metastasis. Here, we found TAM recruitment and M2 polarization were increased in the hepatic metastatic lesion compared with the primary site of human CRC tissues. Moreover, Pearson correlation analysis showed that TAM recruitment and polarization were closely correlated with the elevated TCF4 expression in the metastatic site. To investigate the role of TCF4 in CRC liver metastasis, we generated a syngeneic mouse model using MC38 cells splenic injection. Results from in vivo experiments and mouse models revealed that TCF4 deficiency in MC38 cells does not affect their proliferation and invasion; however, it reduces TAM infiltration and M2 polarization in the metastasis site. Further studies indicated that these effects are mediated by the TCF4 regulated CCL2 and CCR2 expression. TCF4 or CCL2 silencing in the tumor cells prevent CRC liver metastasis in the mouse model. Altogether, these findings suggest that the TCF4-CCL2-CCR2 axis plays an essential role in CRC liver metastasis by enhancing TAMs recruitment and M2 polarization.


Conflict of interest statement

The authors declare no competing interests.

Figures

Fig. 1
Fig. 1. TCF4 expression is elevated in colorectal cancer hepatic metastasis compared with the primary site and is correlated with tumor-associated macrophage recruitment in the tumor area.
A Representative images and quantification of TCF4 immunohistochemistry staining in human primary colorectal cancer sample and hepatic metastatic sample. n = 21 each group; Scale bar, 100 μm; five fields were counted per sample. B TCF4 mRNA expression in human samples. C Representative immunofluorescence staining and quantification of CD68 expression in human colorectal cancer tissue collected from the primary site and hepatic metastasis. Scale bar, 100 μm; five fields were counted per sample. D Quantification of M1 macrophage(CD68+iNOS+ staining cells)/total TAMs(CD68+ staining cells) ratio in human colorectal cancer primary site and hepatic metastases. E Quantification of M2 macrophage(CD68+CD206+ staining cells)/total TAMs(CD68+ staining cells) ratio in human colorectal cancer primary site and hepatic metastases. F M2/M1 macrophage ratio in human samples. G Relative mRNA expression of TNFa, iNOS, CD86 in human colorectal cancer samples. H Quantitative PCR results of CD206, VEGF, and CD163 expression in human colorectal cancer samples. I Pearson correlation coefficient and p-value between TCF4 mRNA expression and CD68 positive cells density in colorectal cancer samples. (Total n = 42; Primary site, n = 21; hepatic metastasis, n = 21). J Pearson correlation coefficient and p-value between TCF4 mRNA expression and CD206, VEGF, CD163 mRNA expression. (Total n = 42, Primary site, n = 21; hepatic metastasis, n = 21). Data are means ± SEM. *P < 0.05, **P < 0.01, ***P < 0.005, ****P < 0.001.
Fig. 2
Fig. 2. Depletion of macrophage in the liver attenuated colorectal cancer liver metastasis in the mouse model.
A Schematic protocol of macrophage depletion in the mouse liver using Lipo-Clodronate tail vein injection. B F4/80 Immunohistochemistry staining and quantification of Lipo-PBS and Lipo-Clodronate treated mice liver. n = 6 each group; Scale bar, 100 μm; five fields were counted per sample. C F4/80 mRNA expression in mouse liver. D Schematic diagram of colorectal cancer liver metastasis model using liver-macrophage depletion mice. E Visible hepatic metastatic tumor nodules and liver weight in mice model. n = 7 per group; Scale bar, 10 mm. F Representative images and quantification of F4/80 staining in the metastatic tumor area. n = 6 each group; Scale bar, 100 μm; five fields were counted per sample. G Relative F4/80 mRNA expression in the tumor. H Flow cytometry analysis of F4-80+CD45+/CD45+ cell ratio in hepatic metastases of mouse model. I Flow cytometry analysis of F4-80+CD206+/ F4-80+ cell ratio in hepatic metastases of mouse model. J Flow cytometry analysis of F4-80+CD206-/ F4-80+ cell ratio in hepatic metastases of mouse model. K Quantification of F4-80+CD206+/ F4-80+CD206- cell ratio in hepatic metastases of mouse model. L M2 macrophage markers(CD206, VEGF, CD163, IL-4, IL-13) mRNA expression level in the tumor. Data are means ± SEM. *P < 0.05, **P < 0.01, ***P < 0.005, ****P < 0.001.
Fig. 3
Fig. 3. TCF4 is required for the MC38 cells induced Kupffer cell migration and M2 polarization.
A TCF4 mRNA expression was evaluated in MC38 cells with TCF4-shRNA stable transfection. B Representative images and quantification of colony numbers in MC38Control and MC38TCF4-sh cells. n = 4 per group. C BrdU incorporation assay of MC38 cells. D Representative Images and quantification of Matrigel-transwell invasion assay using MC38Control and MC38TCF4-sh cells. n = 4 per group; five fields were counted per sample. E Schematic diagram of the Kupffer cell and MC38 cell coculture system. F Transwell migration assay of Kupffer cells cocultured with indicated MC38 cells or control. n = 4 per group; five fields were counted per sample. G FACS analysis for F4/80 and CD206 of Kupffer cells co-cultured with indicated cells or control. Quantification of F4/80+CD206+ cell ratio. n = 4 per group. H Quantitative PCR results of M1 macrophage markers expression in Kupffer cells. I M2 macrophage markers mRNA expression in Kupffer cells cocultured with MC38 cells. Data are means ± SEM. *P < 0.05, **P < 0.01, ***P < 0.005, ****P < 0.001.
Fig. 4
Fig. 4. Deficiency of TCF4 expression in MC38 cells significantly reduces TAM recruitment and M2 polarization in the hepatic metastatic tumor of the mouse model.
A The schematic protocol of the mouse model received MC38 spleen injection. B Representative images and quantification of tumor numbers of mouse liver with colorectal cancer metastases. n = 8 per group; Scale bar, 10 mm. C The liver weight of the mice was evaluated. D F4/80 Immunohistochemistry staining and quantification in the metastatic tumor region. n = 4 per group; Scale bar, 100 μm; five fields were counted per sample. E F4/80 mRNA expression in the tumor was analyzed by Q-PCR. F Q-PCR analysis of M1 macrophage marker expression in the tumors. G M2 macrophage markers CD206, VEGF, CD163, IL-4, IL-13 mRNA expression in tumors. H Illustration of flow cytometry analysis using hepatic metastases tissue of mouse model. I M2 macrophage(F4-80+CD206+)/total TAM(F4-80+) ratio in tumors. J M1 macrophage (F4-80+CD206-)/total TAM(F4-80+) ratio in tumors. K Quantification of M2/M1 ratio in hepatic metastatic tumor of mouse model. Data are means ± SEM. *P < 0.05, **P < 0.01, ***P < 0.005, ****P < 0.001.
Fig. 5
Fig. 5. TCF4 enhances TAM recruitment and M2 polarization in the tumor through regulating the CCL2-CCR2 axis.
A A heatmap of differential expression genes between MC38TCF4-sh cells compared with MC38Control cells using a chemokine PCR array. n = 4, per group. B CCL2 protein concentrations in the culture medium of MC38Control and MC38TCF4-sh cells were evaluated by ELISA. n = 4, per group. C CCL2, CCR2 and CCR4 mRNA expression in metastatic hepatic tumors of mice model received MC38Control and MC38TCF4-sh cells spleen injection. n = 8 per group. D Representative images of Immunofluorescence staining for F4/80(red), CCR2 (green) and DAPI (blue) in mouse hepatic metastases. Scale bar, 50 μm. E Quantification of F4/80 and CCR2 double positive cells per mm2 tumor area. n = 8 per group; five fields were counted per sample. F CCL2 Immunohistochemistry staining and quantification in the human primary colorectal cancer and hepatic metastatses. Scale bar, 100 μm. Primary cancer, n = 21; hepatic metastases, n = 21; five fields were counted per sample. G Q-PCR results of CCL2, CCR2, and CCR4 mRNA expression in human primary colorectal cancer and hepatic metastatses. H Representative images of Immunofluorescence staining for CD68(red), CCR2(green) and DAPI(blue) in human primary colorectal cancer and hepatic metastatses. Scale bar, 100 μm. I Quantification of CD68 + CCR2 + cells per mm2 tumor area. Primary cancer, n = 21; hepatic metastases, n = 21; five fields were counted per sample. Data are means ± SEM. *P < 0.05, **P < 0.01, ***P < 0.005, ****P < 0.001.
Fig. 6
Fig. 6. Loss of CCL2 impairs MC38 induced Kupffer cell migration and M2 polarization.
A TCF4 mRNA expression was evaluated in MC38 cells with TCF4-shRNA stable transfection. B CCL2 protein concentrations in the culture medium of MC38Control and MC38CCL2-sh cells were evaluated by ELISA. n = 4, per group. C Representative images and quantification of colony numbers in MC38Control and MC38TCF4-sh cells. n = 4, per group. D BrdU incorporation assay of MC38 cells. n = 4, per group. E Representative Images and quantification of Matrigel-transwell invasion assay for MC38Control and MC38TCF4-sh cells. n = 4, per group; five fields were counted per sample. F Schematic diagram of the Kupffer cell and MC38 cell coculture system. G Transwell migration assay and quantification of the migrated Kupffer cells cocultured with indicated MC38 cells or control. n = 4, per group; five fields were counted per sample. H FACS analysis for F4/80 and CD206 of Kupffer cells cocultured with indicated cells or control. I Quantification of F4/80 + CD206 + cells ratio from three groups. n = 4 per group. J Q-PCR results of M1 macrophage markers expression in Kupffer cells. K. M2 macrophage markers mRNA expression in Kupffer cells cocultured with MC38 cells. Data are means ± SEM. *P < 0.05, **P < 0.01, ***P < 0.005, ****P < 0.001.
Fig. 7
Fig. 7. Silencing of CCL2 in MC38 cells inhibits hepatic tumor growth through regulation of TAM recruitment and polarization in mouse model.
A The schematic protocol of the mouse model received MC38 spleen injection. B Representative images and tumor nodule numbers of mouse liver with colorectal cancer metastases. MC38Control group, n = 8; MC38CCL2-sh group n = 7; Scale bar, 10 mm. C The liver weight of the mice was evaluated. D F4/80 Immunohistochemistry staining and quantification in the metastatic tumor region. MC38Control group, n = 8; MC38CCL2-sh group n = 7; Scale bar, 100 μm; five fields were counted per sample. E F4/80 mRNA expression in the tumor was analyzed by Q-PCR. F Q-PCR analysis of CCL2, CCR2, and CCR4 mRNA expression in the tumors. G Representative images of Immunofluorescence staining for F4/80(red), CCR2(green) and DAPI(blue) in mouse hepatic metastases. Scale bar, 50 μm. H Quantification of F4/80 and CCR2 double positive cells per mm2 tumor area. MC38Control group, n = 8; MC38CCL2-sh group n = 7; five fields were counted per sample. I mRNA expression of M1 macrophage markers in tumors. J M2 macrophage markers CD206, VEGF, CD163, IL-4, IL-13 mRNA expression in tumors. Data are means ± SEM. *P < 0.05, **P < 0.01, ***P < 0.005, ****P < 0.001.
Fig. 8
Fig. 8. TCF4 regulates CCL2 expression through binding to the promoter region.
A The promoter sequence of CCL2 contains 3 putative TCF4 transcriptional factor binding sites. B Luciferase reporter assays for the activity of wild-type and mutant CCL2 promoters. n = 3 per group. C Quantitative analysis of ChIP experiments performed on DNA samples precipitated with antibodies against TCF4 and IgG using primers detecting putative TCF4 binding sites on CCL2 promoter. n = 3 per group. D Pearson correlation coefficient and p-value between TCF4 and CCL2 mRNA expression in colorectal cancer samples. (Total n = 42; Primary site, n = 21; hepatic metastasis, n = 21). Data are means ± SEM. *P < 0.05, **P < 0.01, ***P < 0.005, ****P < 0.001.

Similar articles

Cited by

References

    1. Siegel RL, Miller KD, Jemal A. Cancer statistics, 2020. CA Cancer J Clin. 2020;70:7–30. - PubMed
    1. Dekker E, Tanis PJ, Vleugels JLA, Kasi PM, Wallace MB. Colorectal cancer. Lancet. 2019;394:1467–80. doi: 10.1016/S0140-6736(19)32319-0. - DOI - PubMed
    1. Jung G, Hernández-Illán E, Moreira L, Balaguer F, Goel A. Epigenetics of colorectal cancer: biomarker and therapeutic potential. Nat Rev Gastroenterol Hepatol. 2020;17:111–30. doi: 10.1038/s41575-019-0230-y. - DOI - PMC - PubMed
    1. Milette S, Sicklick JK, Lowy AM, Brodt P. Molecular pathways: targeting the microenvironment of liver metastases. Clin Cancer Res. 2017;23:6390–9. doi: 10.1158/1078-0432.CCR-15-1636. - DOI - PMC - PubMed
    1. Quail DF, Joyce JA. Microenvironmental regulation of tumor progression and metastasis. Nat Med. 2013;19:1423–37. doi: 10.1038/nm.3394. - DOI - PMC - PubMed

Publication types

MeSH terms