Chronic Occupational Mold Exposure Drives Expansion of Aspergillus-Reactive Type 1 and Type 2 T-Helper Cell Responses
- PMID: 34575736
- PMCID: PMC8471116
- DOI: 10.3390/jof7090698
Chronic Occupational Mold Exposure Drives Expansion of Aspergillus-Reactive Type 1 and Type 2 T-Helper Cell Responses
Abstract
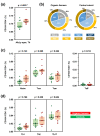
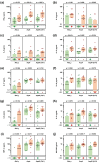
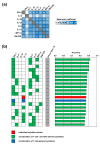
Occupational mold exposure can lead to Aspergillus-associated allergic diseases including asthma and hypersensitivity pneumonitis. Elevated IL-17 levels or disbalanced T-helper (Th) cell expansion were previously linked to Aspergillus-associated allergic diseases, whereas alterations to the Th cell repertoire in healthy occupationally exposed subjects are scarcely studied. Therefore, we employed functional immunoassays to compare Th cell responses to A. fumigatus antigens in organic farmers, a cohort frequently exposed to environmental molds, and non-occupationally exposed controls. Organic farmers harbored significantly higher A. fumigatus-specific Th-cell frequencies than controls, with comparable expansion of Th1- and Th2-cell frequencies but only slightly elevated Th17-cell frequencies. Accordingly, Aspergillus antigen-induced Th1 and Th2 cytokine levels were strongly elevated, whereas induction of IL-17A was minimal. Additionally, increased levels of some innate immune cell-derived cytokines were found in samples from organic farmers. Antigen-induced cytokine release combined with Aspergillus-specific Th-cell frequencies resulted in high classification accuracy between organic farmers and controls. Aspf22, CatB, and CipC elicited the strongest differences in Th1 and Th2 responses between the two cohorts, suggesting these antigens as potential candidates for future bio-effect monitoring approaches. Overall, we found that occupationally exposed agricultural workers display a largely balanced co-expansion of Th1 and Th2 immunity with only minor changes in Th17 responses.
Keywords: Aspergillus; adaptive immunity; biomarker; cytokines; hypersensitivity; immunoassay; inflammation; mold exposure.
Conflict of interest statement
The authors have no conflict of interest related to this study.
Figures


Similar articles
-
Evaluation of Aspergillus and Mucorales specific T-cells and peripheral blood mononuclear cell cytokine signatures as biomarkers of environmental mold exposure.Int J Med Microbiol. 2018 Dec;308(8):1018-1026. doi: 10.1016/j.ijmm.2018.09.002. Epub 2018 Sep 3. Int J Med Microbiol. 2018. PMID: 30201279
-
Aspergillus fumigatus-induced IL-22 is not restricted to a specific Th cell subset and is dependent on complement receptor 3.J Immunol. 2013 Jun 1;190(11):5629-39. doi: 10.4049/jimmunol.1202601. Epub 2013 May 3. J Immunol. 2013. PMID: 23645883
-
Shifted T-cell polarisation after agricultural dust exposure in mice and men.Thorax. 2014 Jul;69(7):630-7. doi: 10.1136/thoraxjnl-2013-204295. Epub 2014 Feb 17. Thorax. 2014. PMID: 24536057
-
Molecular immunological approaches to biotherapy of human cancers--a review, hypothesis and implications.Anticancer Res. 2006 Mar-Apr;26(2A):1113-34. Anticancer Res. 2006. PMID: 16619514 Review.
-
The effector T helper cell triade.Riv Biol. 2009 Jan-Apr;102(1):61-74. Riv Biol. 2009. PMID: 19718623 Review.
Cited by
-
COVID-19 patients share common, corticosteroid-independent features of impaired host immunity to pathogenic molds.Front Immunol. 2022 Aug 16;13:954985. doi: 10.3389/fimmu.2022.954985. eCollection 2022. Front Immunol. 2022. PMID: 36052094 Free PMC article.
-
Characterization of Lung Inflammatory Response to Aspergillus fumigatus Spores.J Fungi (Basel). 2023 Jun 17;9(6):682. doi: 10.3390/jof9060682. J Fungi (Basel). 2023. PMID: 37367618 Free PMC article.
-
Social determinants of health as drivers of fungal disease.EClinicalMedicine. 2023 Nov 18;66:102325. doi: 10.1016/j.eclinm.2023.102325. eCollection 2023 Dec. EClinicalMedicine. 2023. PMID: 38053535 Free PMC article. Review.
-
Checkpoint inhibitors as immunotherapy for fungal infections: Promises, challenges, and unanswered questions.Front Immunol. 2022 Oct 25;13:1018202. doi: 10.3389/fimmu.2022.1018202. eCollection 2022. Front Immunol. 2022. PMID: 36389687 Free PMC article. Review.
-
Comprehensive plasma cytokine and chemokine profiling in prurigo nodularis reveals endotypes in Type 2 inflammation.Sci Rep. 2024 Apr 6;14(1):8098. doi: 10.1038/s41598-024-58013-x. Sci Rep. 2024. PMID: 38582943 Free PMC article.
References
Grants and funding
LinkOut - more resources
Full Text Sources

