

Development of a Robust Control Strategy for Fixed-Dose Combination Bilayer Tablets with Integrated Quality by Design, Statistical, and Process Analytical Technology Approach
- PMID: 34575519
- PMCID: PMC8467219
- DOI: 10.3390/pharmaceutics13091443
Development of a Robust Control Strategy for Fixed-Dose Combination Bilayer Tablets with Integrated Quality by Design, Statistical, and Process Analytical Technology Approach
Abstract
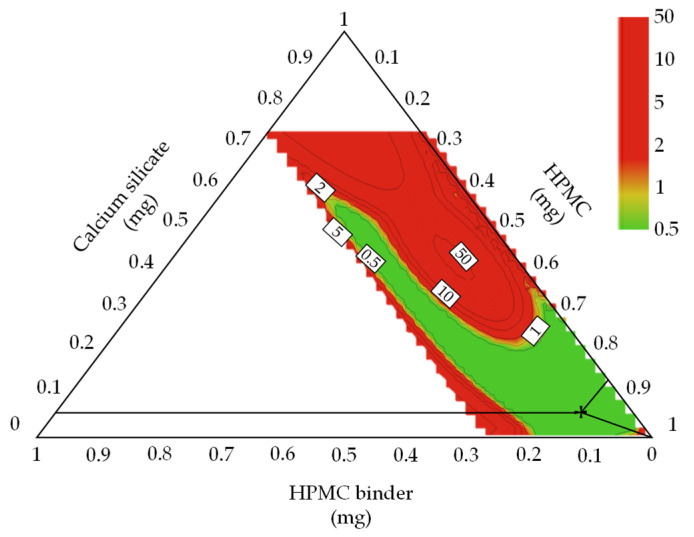
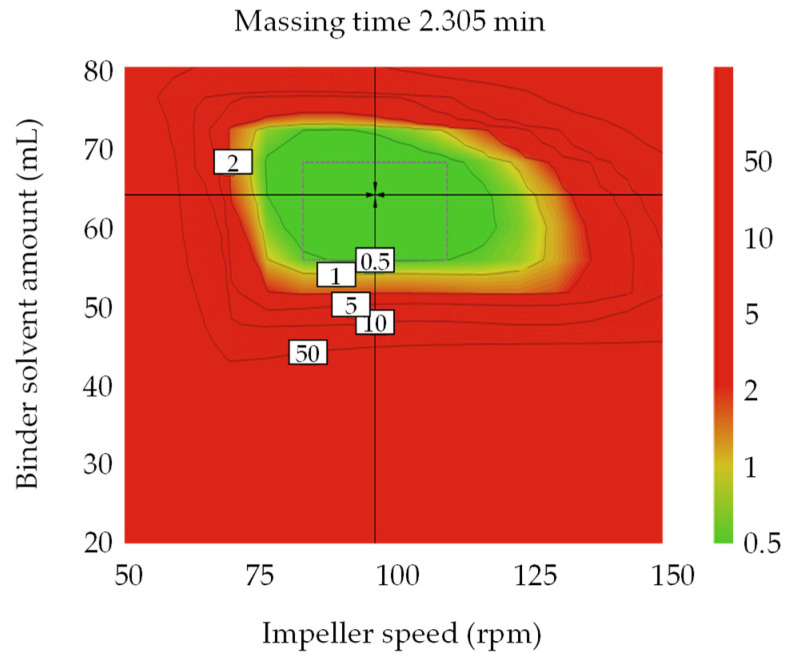
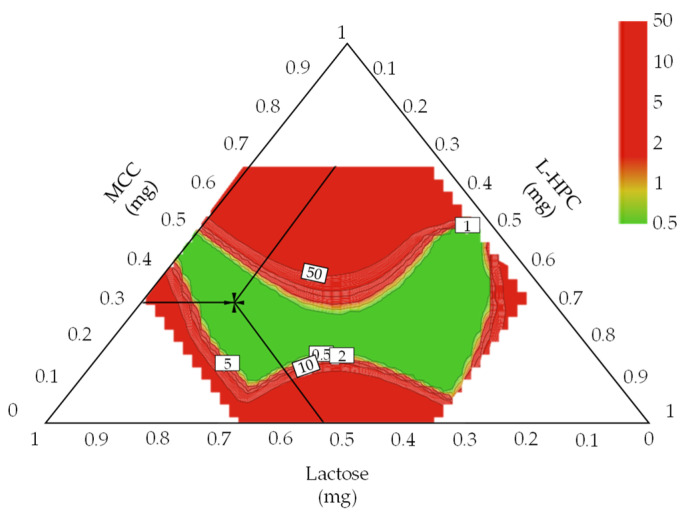
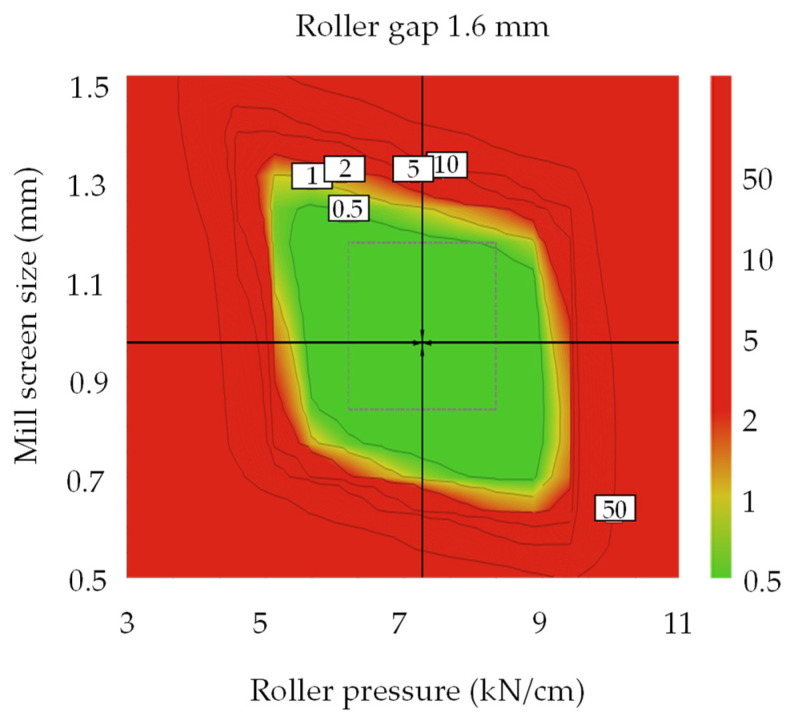
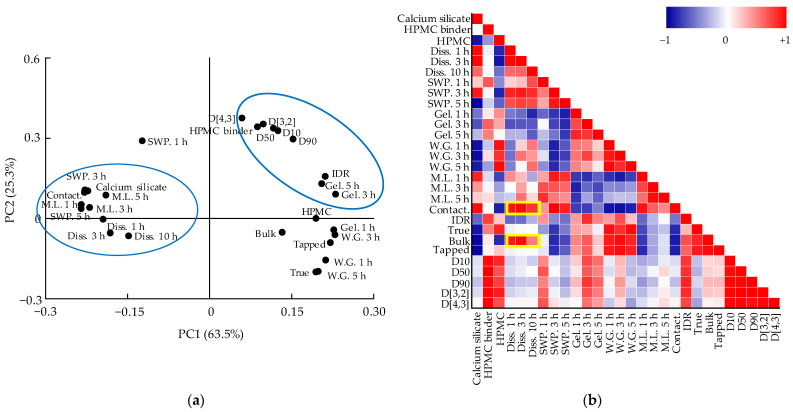
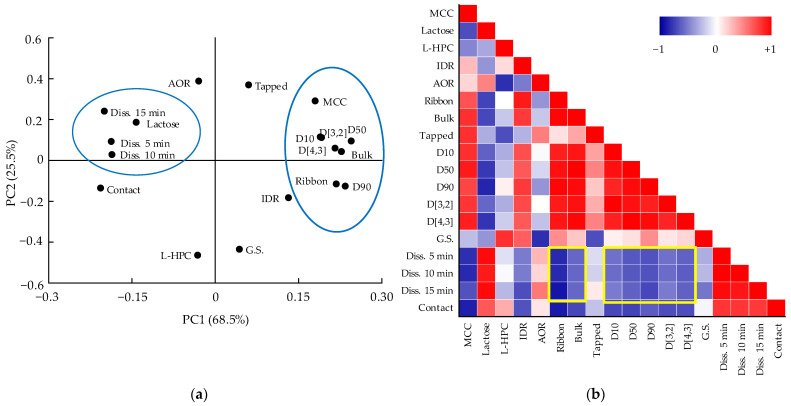
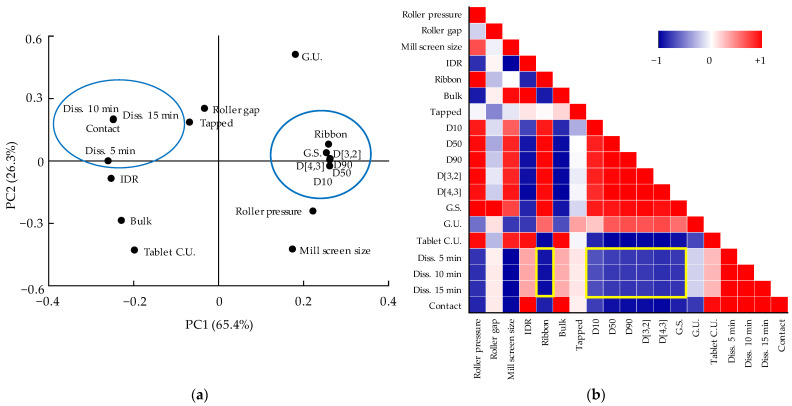
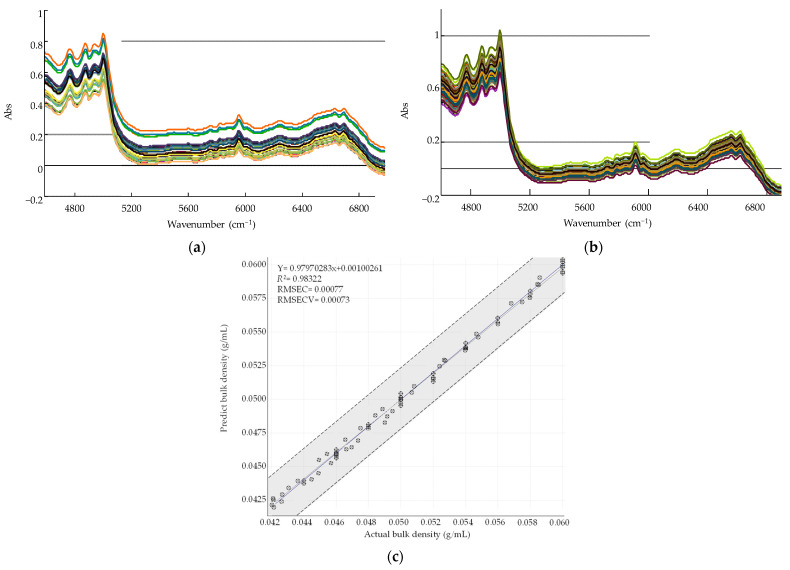
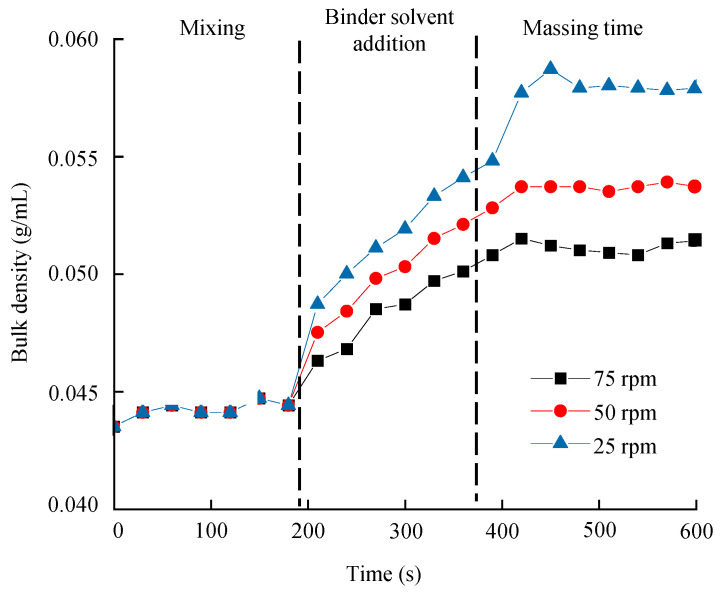
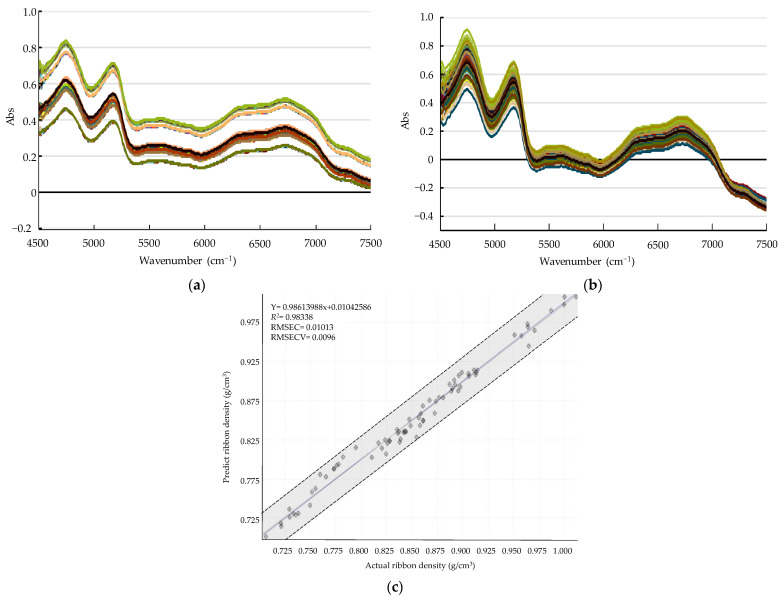
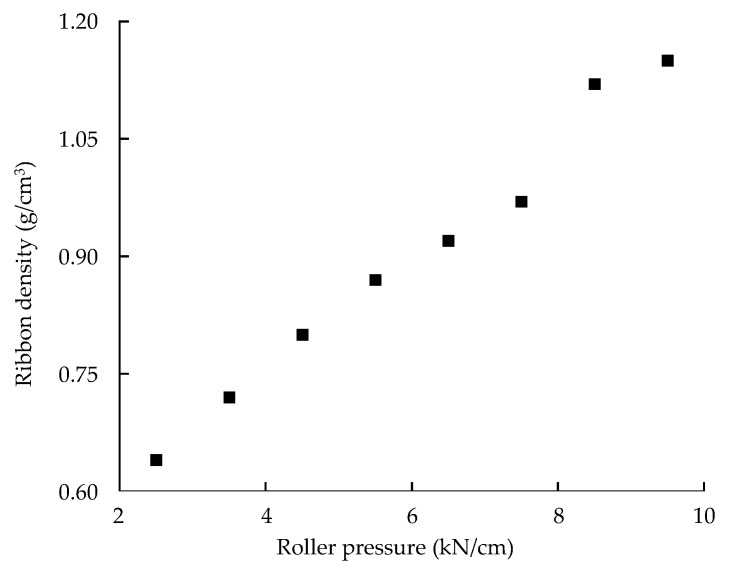
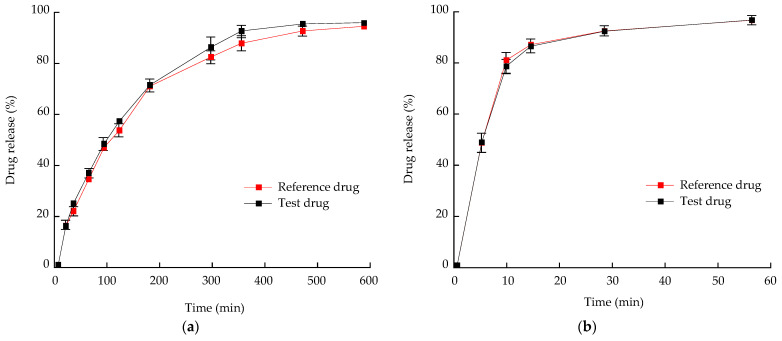
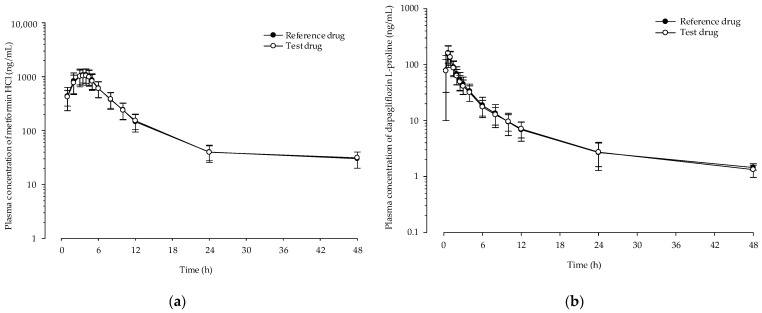
Control strategy and quality by design (QbD) are widely used to develop pharmaceutical products and improve drug quality; however, studies on fixed-dose combination (FDC) bilayer tablets are limited. In this study, the bilayer tablet consisted of high-dose metformin HCl in a sustained-release layer and low-dose dapagliflozin l-proline in an immediate-release layer. The formulation and process of each layer were optimized using the QbD approach. A d-optimal mixture design and response surface design were applied to optimize critical material attributes and critical process parameters, respectively. The robust design space was developed using Monte Carlo simulations by evaluating the risk of uncertainty in the model predictions. Multivariate analysis showed that there were significant correlations among impeller speed, massing time, granule bulk density, and dissolution in the metformin HCl layer, and among roller pressure, ribbon density, and dissolution in the dapagliflozin l-proline layer. Process analytical technology (PAT) was used with in-line transmittance near-infrared spectroscopy to confirm the bulk and ribbon densities of the optimized bilayer tablet. Moreover, the in vitro drug release and in vivo pharmacokinetic studies showed that the optimized test drug was bioequivalent to the reference drug. This study suggested that integrated QbD, statistical, and PAT approaches can develop a robust control strategy for FDC bilayer tablets by implementing real-time release testing based on the relationships among various variables.
Keywords: control strategy; fixed-dose combination drug; manufacturing process; multivariate analysis; process analytical technology; quality by design.
Conflict of interest statement
The authors declare no conflict of interest.
Figures

Similar articles
-
Optimization of bilayer tablet manufacturing process for fixed dose combination of sustained release high-dose drug and immediate release low-dose drug based on quality by design (QbD).Int J Pharm. 2021 Aug 10;605:120838. doi: 10.1016/j.ijpharm.2021.120838. Epub 2021 Jun 28. Int J Pharm. 2021. PMID: 34197909
-
A formulation development strategy for dual-release bilayer tablets: An integrated approach of quality by design and a placebo layer.Int J Pharm. 2022 Apr 25;618:121659. doi: 10.1016/j.ijpharm.2022.121659. Epub 2022 Mar 12. Int J Pharm. 2022. PMID: 35292397
-
Control Strategy for Process Development of High-Shear Wet Granulation and Roller Compaction to Prepare a Combination Drug Using Integrated Quality by Design.Pharmaceutics. 2021 Jan 8;13(1):80. doi: 10.3390/pharmaceutics13010080. Pharmaceutics. 2021. PMID: 33435594 Free PMC article.
-
Implementation of Quality by Design (QbD) for development of bilayer tablets.Eur J Pharm Sci. 2023 May 1;184:106412. doi: 10.1016/j.ejps.2023.106412. Epub 2023 Feb 22. Eur J Pharm Sci. 2023. PMID: 36828037 Review.
-
Process Analytical Technology Tools for Monitoring Pharmaceutical Unit Operations: A Control Strategy for Continuous Process Verification.Pharmaceutics. 2021 Jun 21;13(6):919. doi: 10.3390/pharmaceutics13060919. Pharmaceutics. 2021. PMID: 34205797 Free PMC article. Review.
Cited by
-
Development and Evaluation of Cannabidiol Orodispersible Tablets Using a 23-Factorial Design.Pharmaceutics. 2022 Jul 14;14(7):1467. doi: 10.3390/pharmaceutics14071467. Pharmaceutics. 2022. PMID: 35890362 Free PMC article.
-
The Development of Innovative Dosage Forms of the Fixed-Dose Combination of Active Pharmaceutical Ingredients.Pharmaceutics. 2022 Apr 11;14(4):834. doi: 10.3390/pharmaceutics14040834. Pharmaceutics. 2022. PMID: 35456668 Free PMC article. Review.
-
Fixed-Dose Combination Formulations in Solid Oral Drug Therapy: Advantages, Limitations, and Design Features.Pharmaceutics. 2024 Jan 26;16(2):178. doi: 10.3390/pharmaceutics16020178. Pharmaceutics. 2024. PMID: 38399239 Free PMC article. Review.
References
-
- Del Prato S., Felton A.M., Munro N., Nesto R., Zimmet P., Zinman B. Improving glucose management: Ten steps to get more patients with type 2 diabetes to glycaemic goal: Recommendations from the Global Partnership for Effective Diabetes Management. Int. J. Clin. Pract. 2005;59:1345–1355. doi: 10.1111/j.1742-1241.2005.00674.x. - DOI - PubMed
-
- Khomitskaya Y., Tikhonova N., Gudkov K., Erofeeva S., Holmes V., Dayton B., Davies N., Boulton D.W., Tang W. Bioequivalence of Dapagliflozin/Metformin Extended-release Fixed-combination Drug Product and Single-component Dapagliflozin and Metformin Extended-release Tablets in Healthy Russian Subjects. Clin. Ther. 2018;40:550–561. doi: 10.1016/j.clinthera.2018.02.006. - DOI - PubMed
-
- Wang J.-S., Huang C.-N., Hung Y.-J., Kwok C.-F., Sun J.-H., Pei D., Yang C.-Y., Chen C.-C., Lin C.-L., Sheu W.H.-H. Acarbose plus metformin fixed-dose combination outperforms acarbose monotherapy for type 2 diabetes. Diabetes Res. Clin. Pract. 2013;102:16–24. doi: 10.1016/j.diabres.2013.08.001. - DOI - PubMed
Grants and funding
LinkOut - more resources
Full Text Sources
