Capsid Allosteric Modulators Enhance the Innate Immune Response in Hepatitis B Virus-Infected Hepatocytes During Interferon Administration
- PMID: 34558845
- PMCID: PMC8793994
- DOI: 10.1002/hep4.1804
Capsid Allosteric Modulators Enhance the Innate Immune Response in Hepatitis B Virus-Infected Hepatocytes During Interferon Administration
Abstract
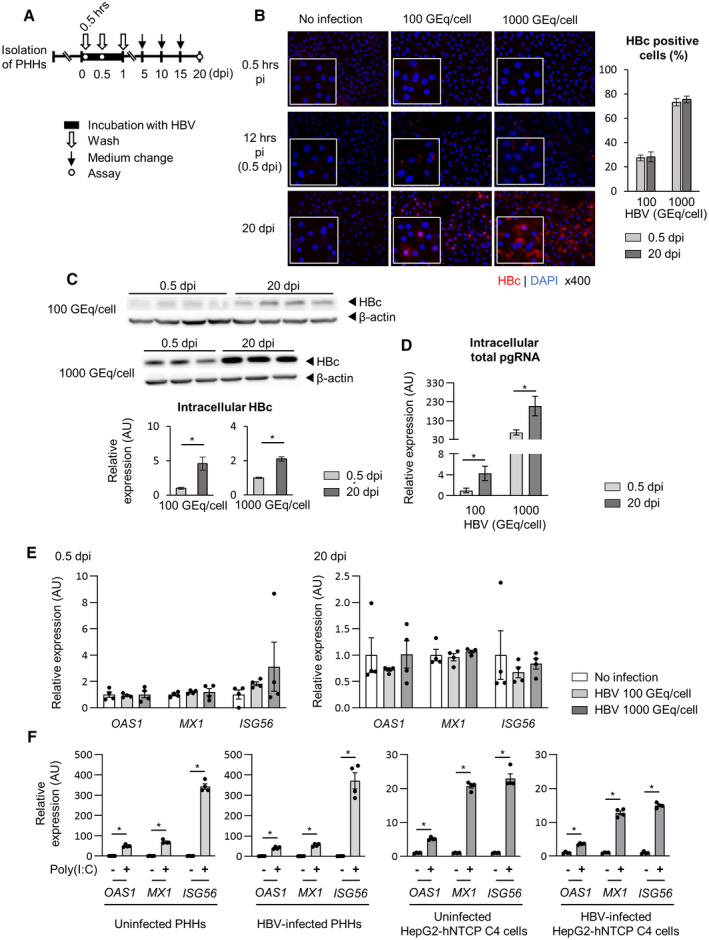
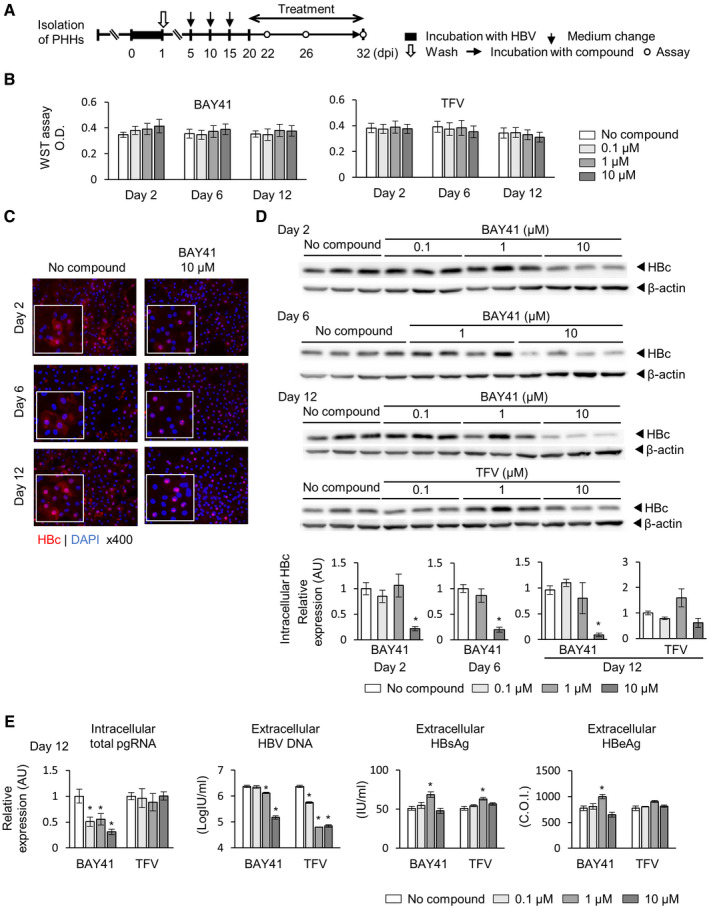
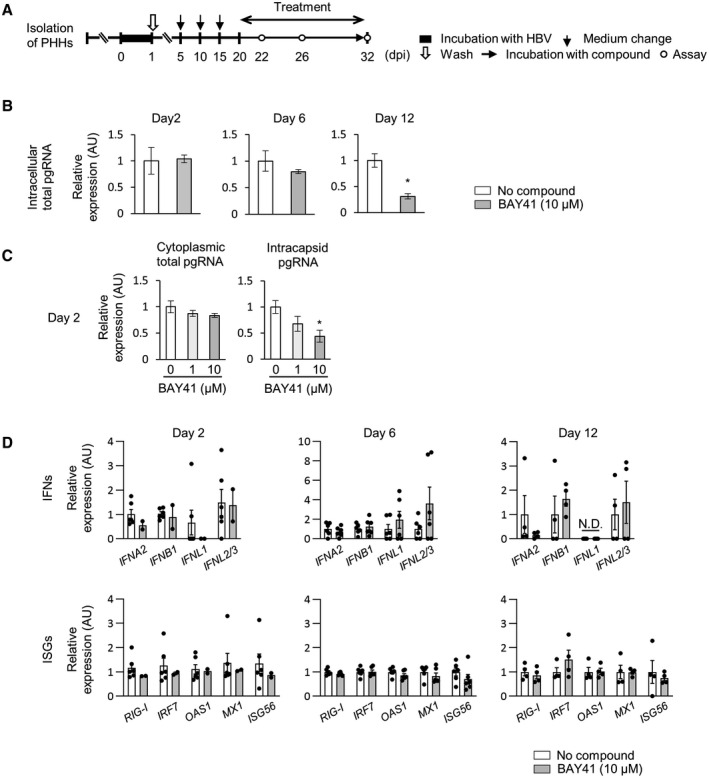
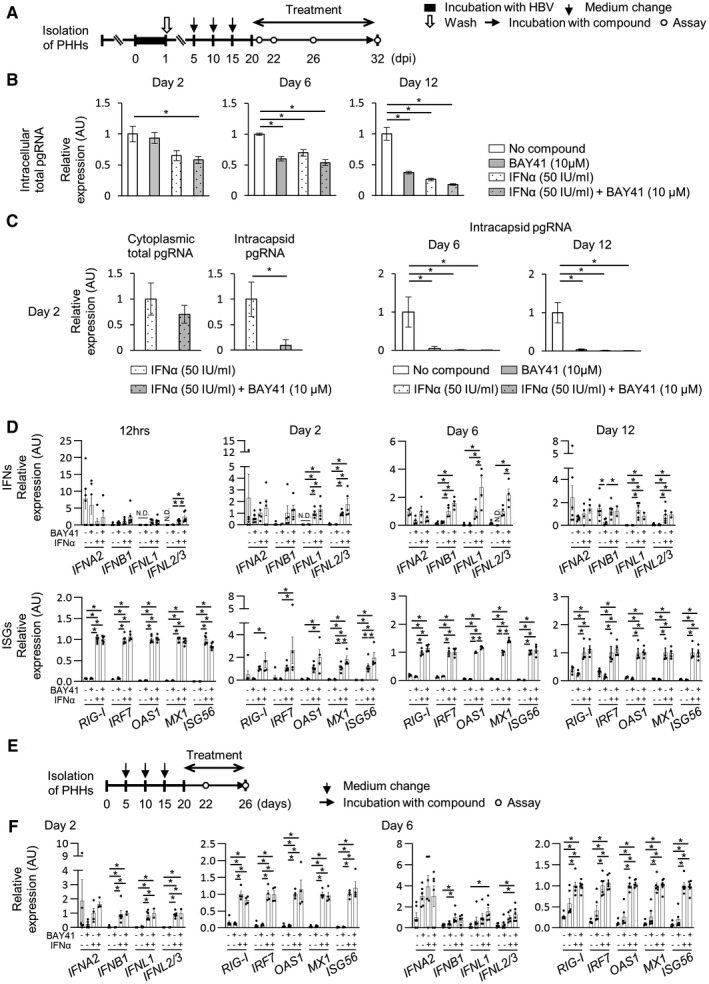
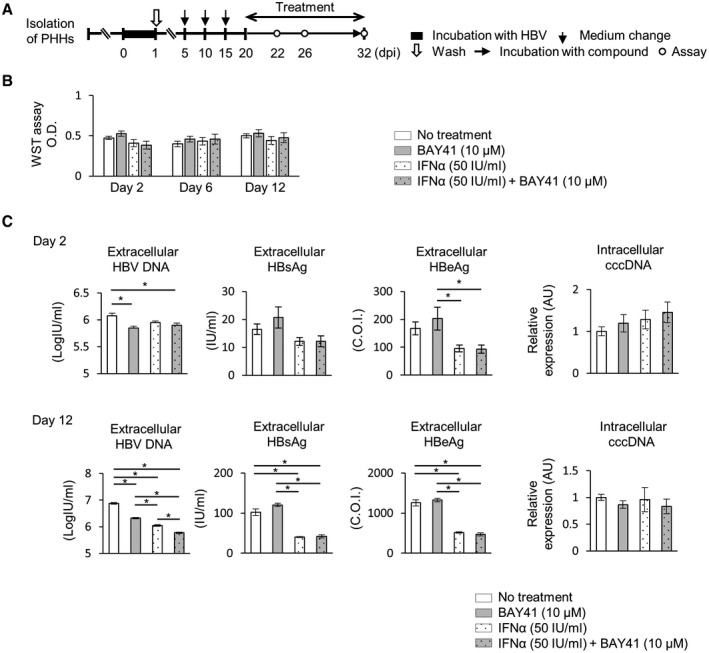
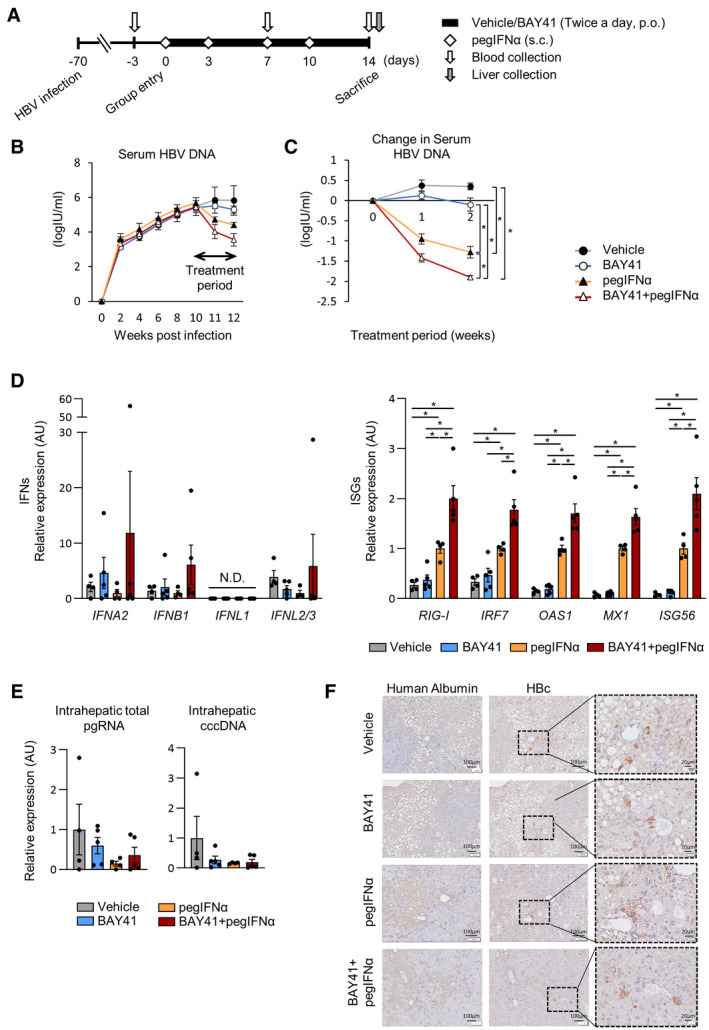
Capsid allosteric modulators (CAMs) inhibit the encapsidation of hepatitis B virus (HBV) pregenomic RNA (pgRNA), which contains a pathogen-associated molecular pattern motif. However, the effect of CAMs on the innate immune response of HBV-infected hepatocytes remains unclear, and we examined this effect in this study. Administration of a CAM compound, BAY41-4109 (BAY41), to HBV-infected primary human hepatocytes (PHHs) did not change the total cytoplasmic pgRNA levels but significantly reduced intracapsid pgRNA levels, suggesting that BAY41 increased extracapsid pgRNA levels in the cytoplasm. BAY41 alone did not change the intracellular interferon (IFN)-stimulated gene (ISG) expression levels. However, BAY41 enhanced antiviral ISG induction by IFN-α in HBV-infected PHHs but did not change ISG induction by IFN-α in uninfected PHHs. Compared with BAY41 or IFN-α alone, coadministration of BAY41 and IFN-α significantly suppressed extracellular HBV-DNA levels. HBV-infected human liver-chimeric mice were treated with vehicle, BAY41, pegylated IFN-α (pegIFN-α), or BAY41 and pegIFN-α together. Compared with the vehicle control, pegIFN-α highly up-regulated intrahepatic ISG expression levels, but BAY41 alone did not change these levels. The combination of BAY41 and pegIFN-α further enhanced intrahepatic antiviral ISG expression, which was up-regulated by pegIFNα. The serum HBV-DNA levels in mice treated with the combination of BAY41 and pegIFN-α were the lowest observed in all the groups. Conclusion: CAMs enhance the host IFN response when combined with exogenous IFN-α, likely due to increased cytoplasmic extracapsid pgRNA.
© 2021 The Authors. Hepatology Communications published by Wiley Periodicals LLC on behalf of American Association for the Study of Liver Diseases.
Figures
Similar articles
-
Capsid Assembly Modulators Have a Dual Mechanism of Action in Primary Human Hepatocytes Infected with Hepatitis B Virus.Antimicrob Agents Chemother. 2017 Jul 25;61(8):e00560-17. doi: 10.1128/AAC.00560-17. Print 2017 Aug. Antimicrob Agents Chemother. 2017. PMID: 28584155 Free PMC article.
-
Understanding Hepatitis B Virus Dynamics and the Antiviral Effect of Interferon Alpha Treatment in Humanized Chimeric Mice.J Virol. 2021 Jun 24;95(14):e0049220. doi: 10.1128/JVI.00492-20. Epub 2021 Jun 24. J Virol. 2021. PMID: 33910953 Free PMC article.
-
Hepatitis B Virus Capsid Assembly Modulators, but Not Nucleoside Analogs, Inhibit the Production of Extracellular Pregenomic RNA and Spliced RNA Variants.Antimicrob Agents Chemother. 2017 Jul 25;61(8):e00680-17. doi: 10.1128/AAC.00680-17. Print 2017 Aug. Antimicrob Agents Chemother. 2017. PMID: 28559265 Free PMC article.
-
Pharmacokinetics and pharmacodynamics of pegylated interferon for the treatment of hepatitis B.Expert Opin Drug Metab Toxicol. 2019 Oct;15(10):779-785. doi: 10.1080/17425255.2019.1678584. Epub 2019 Oct 12. Expert Opin Drug Metab Toxicol. 2019. PMID: 31593639 Review.
-
The Interactions between HBV and the Innate Immunity of Hepatocytes.Viruses. 2020 Mar 5;12(3):285. doi: 10.3390/v12030285. Viruses. 2020. PMID: 32151000 Free PMC article. Review.
Cited by
-
Class A capsid assembly modulator apoptotic elimination of hepatocytes with high HBV core antigen level in vivo is dependent on de novo core protein translation.J Virol. 2024 Mar 19;98(3):e0150223. doi: 10.1128/jvi.01502-23. Epub 2024 Feb 5. J Virol. 2024. PMID: 38315015 Free PMC article.
-
Inhibition of nonhomologous end joining-mediated DNA repair enhances anti-HBV CRISPR therapy.Hepatol Commun. 2022 Sep;6(9):2474-2487. doi: 10.1002/hep4.2014. Epub 2022 May 24. Hepatol Commun. 2022. PMID: 35608131 Free PMC article.
References
-
- World Health Organization . Fact sheet, Hepatitis B 2019, July 18. https://www.who.int/news‐room/fact‐sheets/detail/hepatitis‐b. Accessed January 14, 2021.
-
- European Association for the Study of the Liver . EASL 2017 Clinical Practice Guidelines on the management of hepatitis B virus infection. J Hepatol 2017;67:370‐398. - PubMed
-
- Fanning GC, Zoulim F, Hou J, Bertoletti A. Therapeutic strategies for hepatitis B virus infection: towards a cure. Nat Rev Drug Discov 2019;18:827‐844. - PubMed
Publication types
MeSH terms
Substances
LinkOut - more resources
Full Text Sources
Medical