

The transcription factor reservoir and chromatin landscape in activated plasmacytoid dendritic cells
- PMID: 34544361
- PMCID: PMC8454182
- DOI: 10.1186/s12863-021-00991-2
The transcription factor reservoir and chromatin landscape in activated plasmacytoid dendritic cells
Abstract
Background: Transcription factors (TFs) control gene expression by direct binding to regulatory regions of target genes but also by impacting chromatin landscapes and modulating DNA accessibility for other TFs. In recent years several TFs have been defined that control cell fate decisions and effector functions in the immune system. Plasmacytoid dendritic cells (pDCs) are an immune cell type with the unique capacity to produce high amounts of type I interferons quickly in response to contact with viral components. Hereby, this cell type is involved in anti-infectious immune responses but also in the development of inflammatory and autoimmune diseases. To date, the global TF reservoir in pDCs early after activation remains to be fully characterized.
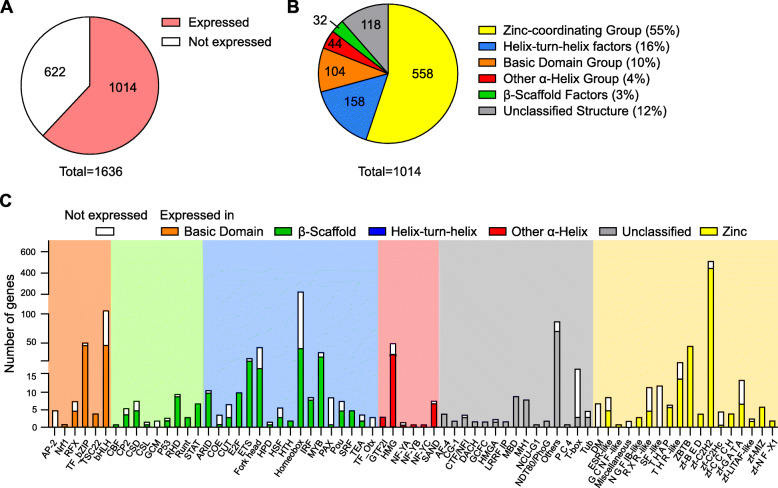
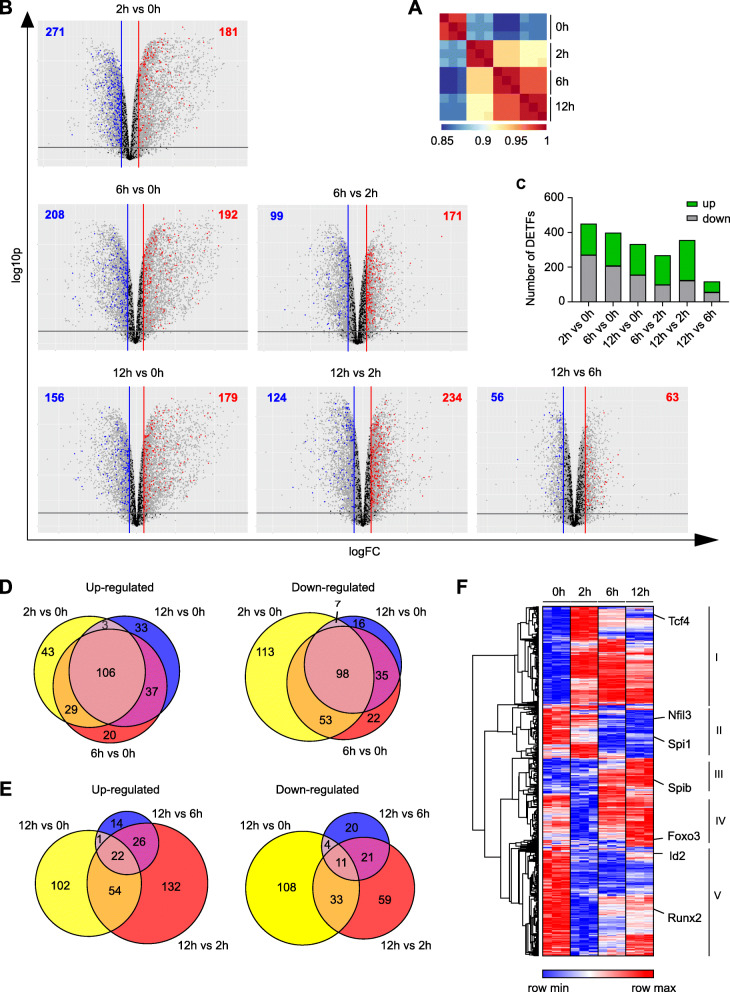
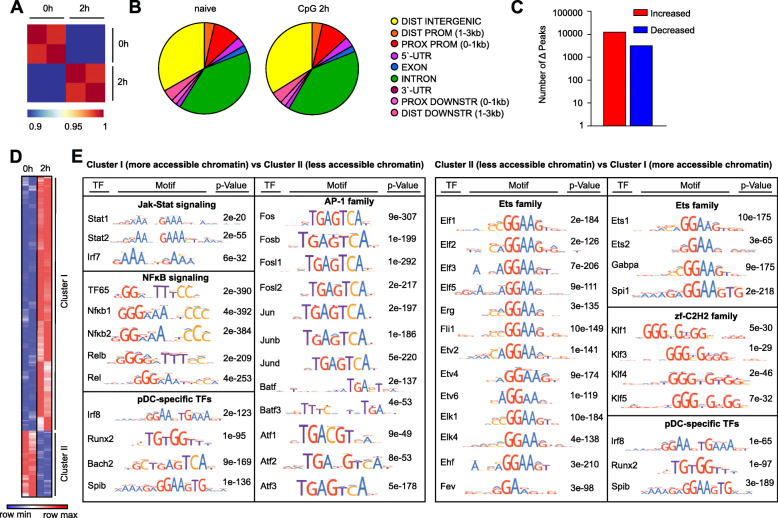
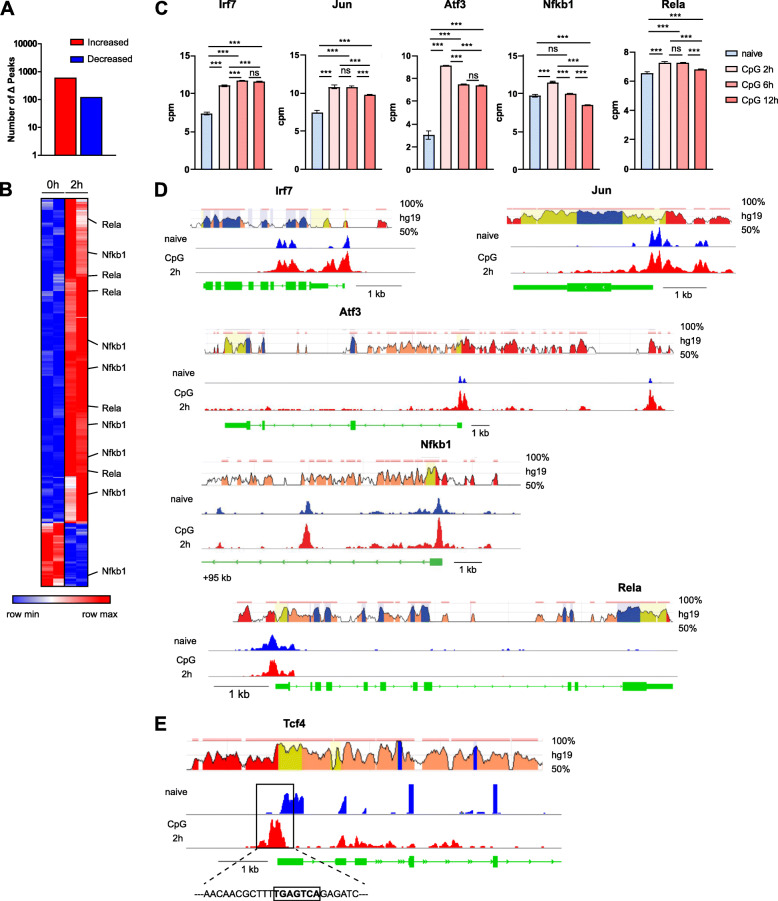
Results: To fill this gap, we have performed a comprehensive analysis in naïve versus TLR9-activated murine pDCs in a time course study covering early timepoints after stimulation (2 h, 6 h, 12 h) integrating gene expression (RNA-Seq) and chromatin landscape (ATAC-Seq) studies. To unravel the biological processes underlying the changes in TF expression on a global scale gene ontology (GO) analyses were performed. We found that 70% of all genes annotated as TFs in the mouse genome (1014 out of 1636) are expressed in pDCs for at least one stimulation time point and are covering a wide range of TF classes defined by their specific DNA binding mechanisms. GO analysis revealed involvement of TLR9-induced TFs in epigenetic modulation, NFκB and JAK-STAT signaling, and protein production in the endoplasmic reticulum. pDC activation predominantly "turned on" the chromatin regions associated with TF genes. Our in silico analyses pointed at the AP-1 family of TFs as less noticed but possibly important players in these cells after activation. AP-1 family members exhibit (1) increased gene expression, (2) enhanced chromatin accessibility in their promoter region, and (3) a TF DNA binding motif that is globally enriched in genomic regions that were found more accessible in pDCs after TLR9 activation.
Conclusions: In this study we define the complete set of TLR9-regulated TFs in pDCs. Further, this study identifies the AP-1 family of TFs as potentially important but so far less well characterized regulators of pDC function.
Keywords: ATAC-Seq; Gene expression analysis; Next generation sequencing; Plasmacytoid dendritic cells; TLR9; Transcription factors.
© 2021. The Author(s).
Conflict of interest statement
The authors declare no conflict of interest.
Figures

Similar articles
-
Irf1- and Egr1-activated transcription plays a key role in macrophage polarization: A multiomics sequencing study with partial validation.Int Immunopharmacol. 2021 Oct;99:108072. doi: 10.1016/j.intimp.2021.108072. Epub 2021 Aug 16. Int Immunopharmacol. 2021. PMID: 34426111
-
Human Plasmacytoid and Monocyte-Derived Dendritic Cells Display Distinct Metabolic Profile Upon RIG-I Activation.Front Immunol. 2018 Dec 21;9:3070. doi: 10.3389/fimmu.2018.03070. eCollection 2018. Front Immunol. 2018. PMID: 30622542 Free PMC article.
-
Bruton's tyrosine kinase regulates TLR9 but not TLR7 signaling in human plasmacytoid dendritic cells.Eur J Immunol. 2014 Apr;44(4):1130-6. doi: 10.1002/eji.201344030. Epub 2014 Jan 20. Eur J Immunol. 2014. PMID: 24375473
-
Plasmacytoid dendritic cells in antiviral immunity and autoimmunity.Sci China Life Sci. 2010 Feb;53(2):172-82. doi: 10.1007/s11427-010-0045-0. Epub 2010 Mar 7. Sci China Life Sci. 2010. PMID: 20596824 Free PMC article. Review.
-
AP-1 Takes Centre Stage in Enhancer Chromatin Dynamics.Trends Cell Biol. 2018 Jul;28(7):509-511. doi: 10.1016/j.tcb.2018.04.009. Epub 2018 May 16. Trends Cell Biol. 2018. PMID: 29778529 Review.
Cited by
-
Nano transdermal system combining mitochondria-targeting cerium oxide nanoparticles with all-trans retinoic acid for psoriasis.Asian J Pharm Sci. 2023 Sep;18(5):100846. doi: 10.1016/j.ajps.2023.100846. Epub 2023 Sep 24. Asian J Pharm Sci. 2023. PMID: 37881797 Free PMC article.
-
Transcriptional programming mediated by the histone demethylase KDM5C regulates dendritic cell population heterogeneity and function.Cell Rep. 2024 Aug 27;43(8):114506. doi: 10.1016/j.celrep.2024.114506. Epub 2024 Jul 24. Cell Rep. 2024. PMID: 39052479 Free PMC article.
-
A Unified Deep Learning Framework for Single-Cell ATAC-Seq Analysis Based on ProdDep Transformer Encoder.Int J Mol Sci. 2023 Mar 1;24(5):4784. doi: 10.3390/ijms24054784. Int J Mol Sci. 2023. PMID: 36902216 Free PMC article.
References
Publication types
MeSH terms
Substances
LinkOut - more resources
Full Text Sources
Molecular Biology Databases
Miscellaneous