. 2022 Apr 12;6(7):2129-2143.
doi: 10.1182/bloodadvances.2021005018.

CombiFlow: combinatorial AML-specific plasma membrane expression profiles allow longitudinal tracking of clones

Affiliations

CombiFlow: combinatorial AML-specific plasma membrane expression profiles allow longitudinal tracking of clones

Roos Houtsma et al. Blood Adv. .

Abstract

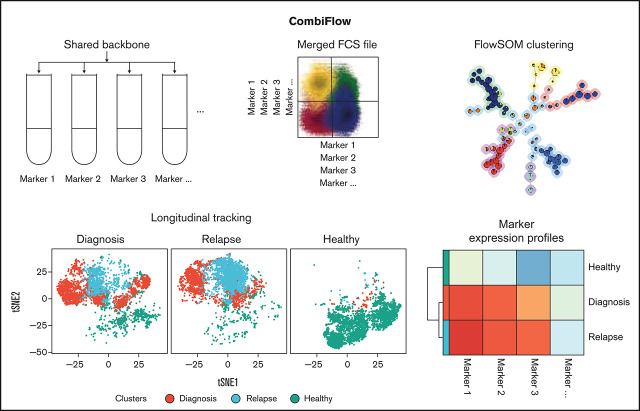
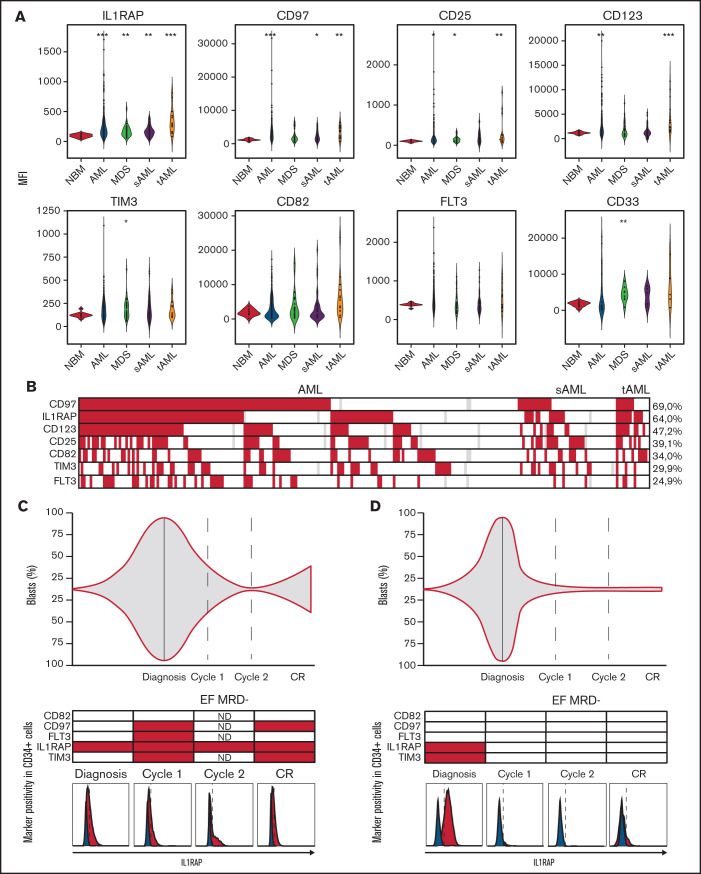
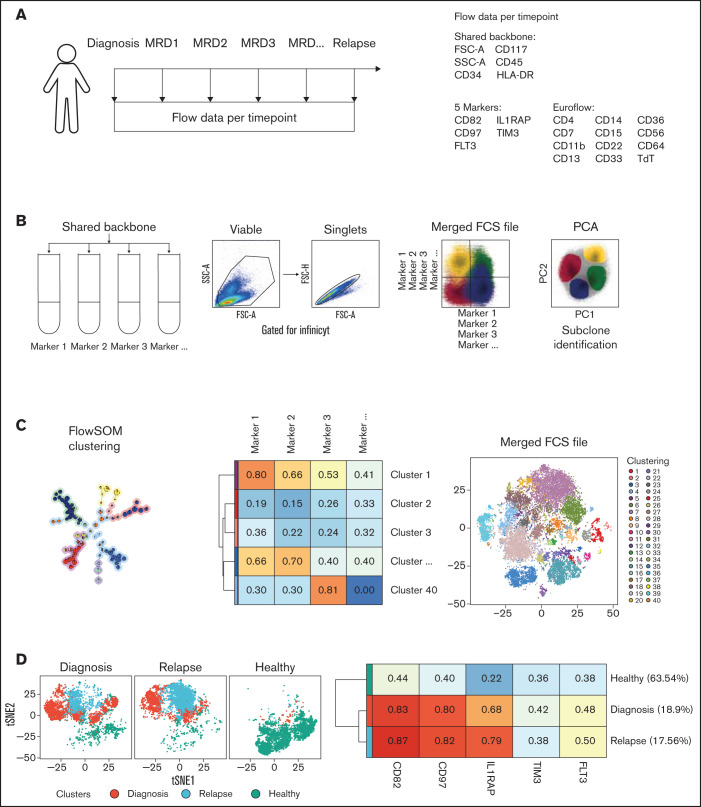
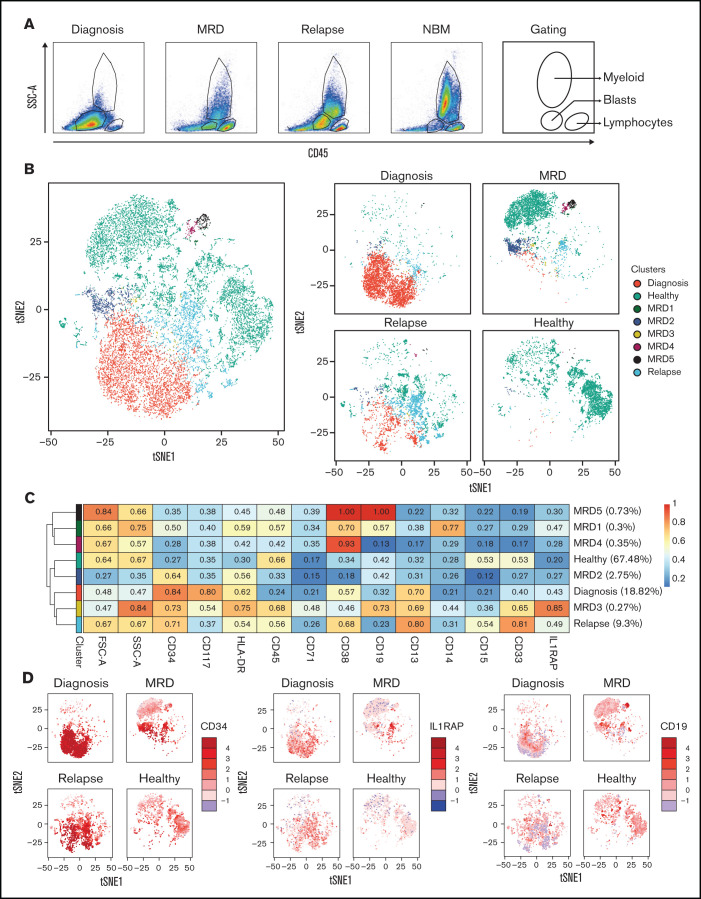
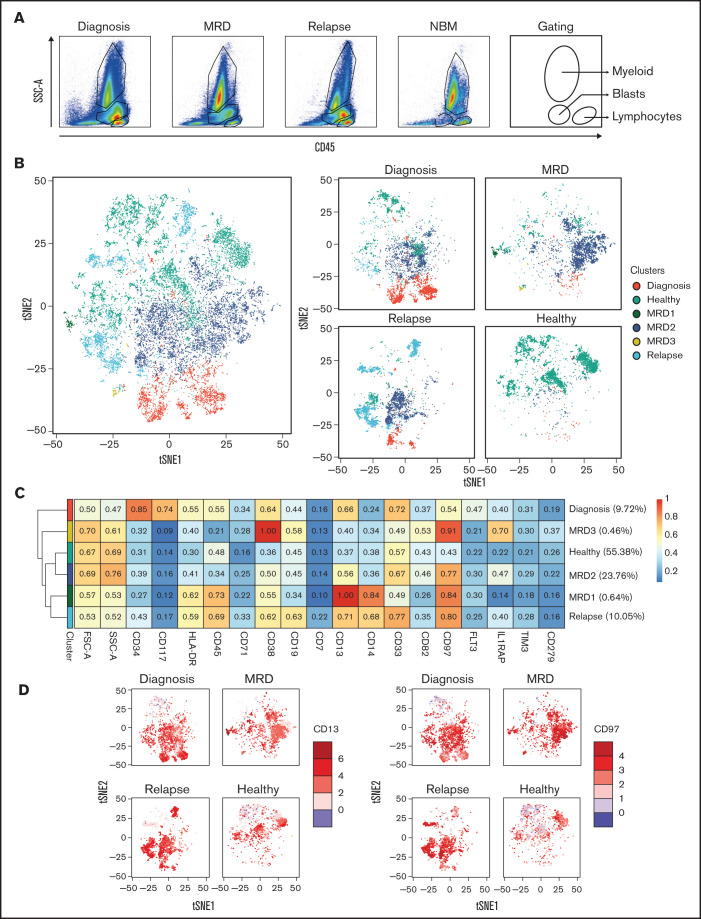
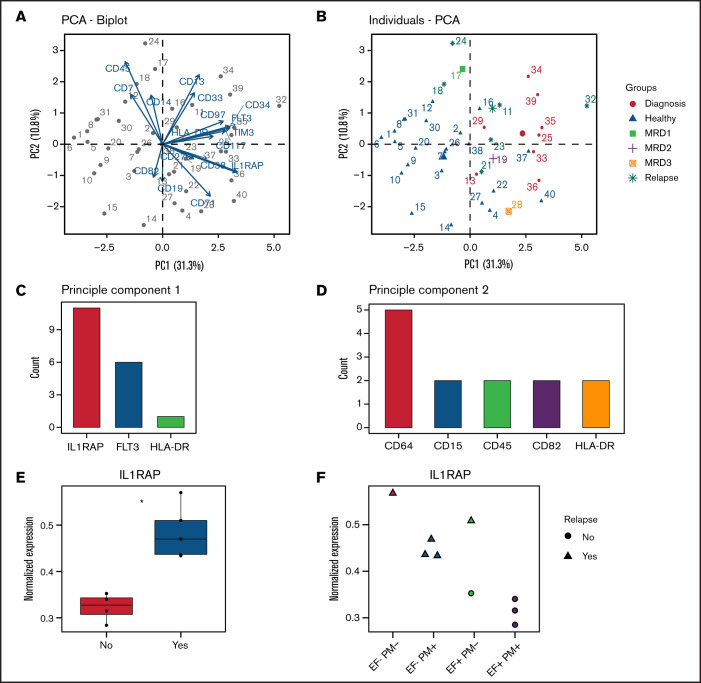
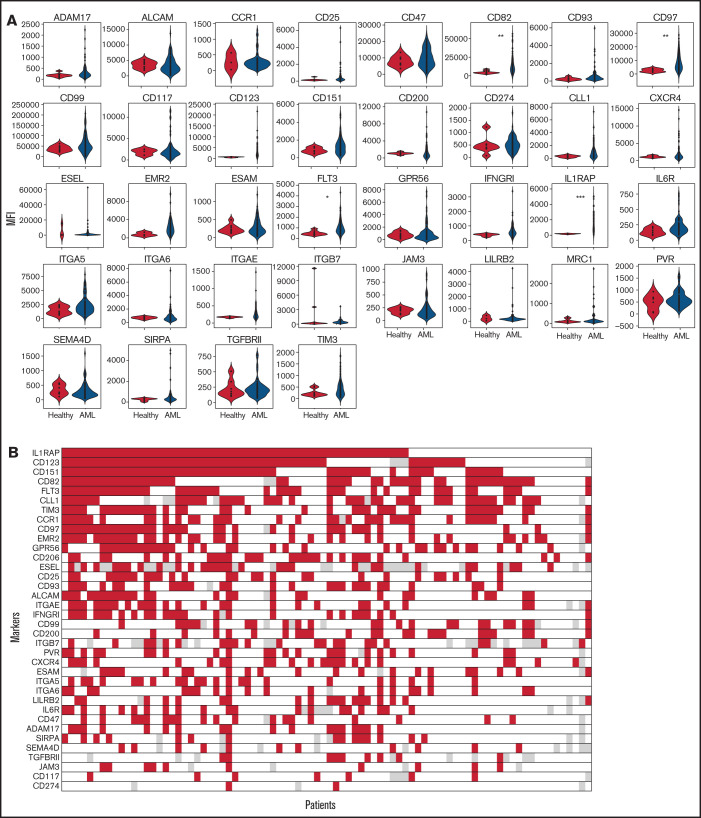
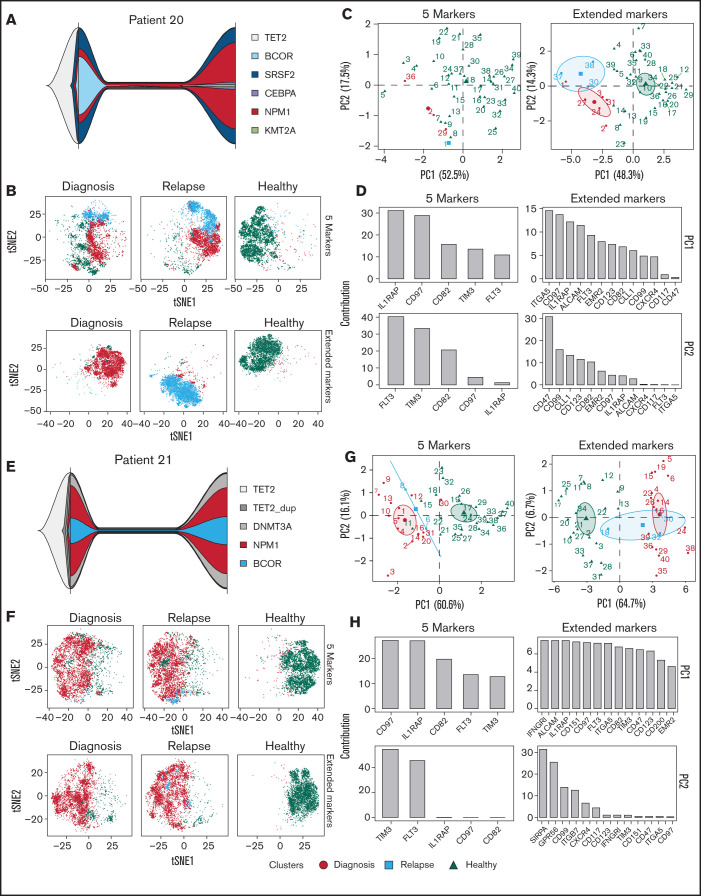
Acute myeloid leukemia (AML) often presents as an oligoclonal disease whereby multiple genetically distinct subclones can coexist within patients. Differences in signaling and drug sensitivity of such subclones complicate treatment and warrant tools to identify them and track disease progression. We previously identified >50 AML-specific plasma membrane (PM) proteins, and 7 of these (CD82, CD97, FLT3, IL1RAP, TIM3, CD25, and CD123) were implemented in routine diagnostics in patients with AML (n = 256) and myelodysplastic syndrome (n = 33). We developed a pipeline termed CombiFlow in which expression data of multiple PM markers is merged, allowing a principal component-based analysis to identify distinctive marker expression profiles and to generate single-cell t-distributed stochastic neighbor embedding landscapes to longitudinally track clonal evolution. Positivity for one or more of the markers after 2 courses of intensive chemotherapy predicted a shorter relapse-free survival, supporting a role for these markers in measurable residual disease (MRD) detection. CombiFlow also allowed the tracking of clonal evolution in paired diagnosis and relapse samples. Extending the panel to 36 AML-specific markers further refined the CombiFlow pipeline. In conclusion, CombiFlow provides a valuable tool in the diagnosis, MRD detection, clonal tracking, and understanding of clonal heterogeneity in AML.


Figures

None
Graphical abstract
Figure 1.
Figure 1.
PM marker positivity can be used to track disease progression and refine diagnostics. (A) PM marker expression (MFI) in de novo AML, MDS, sAML, and tAML (n = 289) vs NBM controls (n = 11). CD33 expression was determined in 50 cases (NBM, n = 11; AML, n = 50). Significant differences compared with NBM are indicated: *P < .05, **P < .01, ***P < .001. (B) Upregulation of PM markers in the AML cohort compared with NBM. Colors indicate a more than twofold increase in MFI compared with NBM (red), similar MFI compared with NBM (white), and not determined (gray). Percentages indicate the amount of patients that had increased expression of the marker at diagnosis (n = 256). (C and D) Disease progression of Patient 1 and Patient 2 portraying blast percentage and marker expression within CD34+ cells from diagnosis to treatment. Red indicates marker positivity. EuroFlow MRD was negative post–cycle 2 (EF MRD) based on EuroFlow criteria.
Figure 2.
Figure 2.
Aberrant PM marker expression in AML post–cycle 2 predicts risk of relapse. (A) Relapse-free survival of patients positive (PM+, red) or negative (PM, blue) for one or more PM markers at diagnosis and at the MRD measurement (n = 72). (B) Multivariate risk analysis. No LAIP indicates that an LAIP could not be determined at diagnosis. Molecular MRD is defined as presence of NPM1cyt or FLT3-ITD; patients that were wild type for these mutations at diagnosis were not included. A P value based on a Wald test of P < .05 was considered significant. (C) Relapse-free survival of EF PM, EF+ PM, EF PM+, and EF+ PM+ patients. EF, EuroFlow; CI, confidence interval; HR, hazard ratio; HSCT, hematopoietic stem cell transplantation; WBC, white blood cell.
Figure 3.
Figure 3.
CombiFlow: combinatorial AML-specific PM expression profiles allow longitudinal tracking of clones. (A) Overview of the collected flow data over time. The shared backbone is always included. For the 5 markers and the EuroFlow markers, the composition differs from patient to patient. (B) Infinicyt-based merging of flow data by expression of the backbone markers that are included in every tube. Viable, single cells were gated and used as input data. In the merged file, markers measured in separate tubes can be plotted against one another. A PCA based on marker expression can identify genetically distinct subclones. (C) Expression data from the merged file is used to cluster cells by using the FlowSOM algorithm. Normalized expression per cluster is obtained, and created clusters are visualized in a tSNE landscape. (D) Clusters are assigned to a condition (diagnosis, relapse, or healthy), and the total tSNE landscape is separated by sample. Normalized expression of all clusters grouped by condition is obtained. FSC-A, forward scatter area; FSC-H, forward scatter height; SSC-A, side scatter area.
Figure 4.
Figure 4.
Identification of potential relapse-inducing populations at MRD in a patient with AML. (A) Gating of the main compartments according to CD45 expression and side scatter area (SSC-A) for the merged FCS files from Patient 1. CD45 cells are gated out. (B) tSNE landscape colored by condition for all included samples (left) or per sample (right). (C) Expression of included markers per condition with the MRD-specific clusters separated to identify the subpopulation most likely to have caused relapse. (D) Expression of CD34, IL1RAP, and CD19 on the tSNE landscape per sample. FSC-A, forward scatter area.
Figure 5.
Figure 5.
Analysis of disease progression according to longitudinal CombiFlow analysis. (A) Gating of the main compartments according to CD45 expression and side scatter area (SSC-A) for the merged FCS files from Patient 3. CD45 cells are gated out. (B) tSNE landscape colored by condition for all included samples (left) or per sample (right). (C) Expression of included markers per condition with the MRD-specific clusters separated to identify the subpopulation most likely to have caused relapse. (D) Expression of CD13 and CD97 on the tSNE landscape per sample. FSC-A, forward scatter area.
Figure 6.
Figure 6.
Identification of IL1RAP as the most discriminating marker in standard chemotherapy-treated patients with AML. (A) PCA from Patient 3 and three NBM samples of 40 FlowSOM-based clusters and the contribution of the included markers to the separation of the clusters. (B) The same PCA, now with the 40 clusters assigned to a condition (diagnosis, healthy, relapse, or MRD). PC1 mainly represents the difference between healthy (blue) and AML (other). (C) The highest ranking markers contributing to PC1 for 18 AMLs. (D) The highest ranking markers contributing to PC2 for 18 AMLs. (E) The cohort was split into 2 groups based on relapse, and the normalized expression of IL1RAP was plotted. The asterisk indicates the significant difference (P < .05) between IL1RAP expression in MRD clusters of non-relapsed vs relapsed patients. (F) The cohort was split into 4 groups based on positivity for the EuroFlow and the PM markers. Normalized IL1RAP expression in the MRD-specific clusters was plotted. EF-PM- , EuroFlow-negative PM-negative; EF-PM+, EuroFlow-negative PM-positive; EF+PM-, EuroFlow-positive PM-negative; EF+PM+, EuroFlow-positive PM-positive.
Figure 7.
Figure 7.
Heterogeneous expression of 36 AML markers in a large AML patient cohort. (A) MFI of PM markers in CD34+cells, or CD34-CD117+ cells for NPM1cyt, AML patients (n = 84) vs healthy controls (NBM, n = 7; mobilized peripheral blood stem cells, n = 2). P values were corrected for multiple testing by using the FDR method. Significant differences compared with NBM are indicated: *P < .05, **P < .01, ***P < .001. (B) Expression of markers compared with healthy controls with a significant shift in MFI (≥2-fold increase in MFI) shown in red. Not determined markers are shown in gray. Markers were ranked according to the amount of positive AMLs.
Figure 8.
Figure 8.
Further refinement of CombiFlow by including more PM markers. (A) Fish plots depicting mutational changes between diagnosis and relapse for Patient 20. (B) tSNE landscapes of Patient 20 created by the 5 markers (top) or aberrant markers selected from the 36-marker panel (bottom). (C) PCAs depicting 40 clusters colored by condition: diagnosis (red circle), relapse (blue square), and healthy (green triangle). PCAs were based on the 5 markers (left) or aberrant markers selected from the 36-marker panel (right). (D) Bar graphs depicting the ranking of the included markers for PC1 and PC2 based on the 5 markers (left) or aberrant markers selected from the extended 36-marker panel (right). (E) Fish plots depicting mutational changes between diagnosis and relapse for Patient 21. (F) tSNE landscapes of Patient 21 created by the 5 markers (top) or aberrant markers selected from the 36-marker panel (bottom). (G) PCAs depicting 40 clusters colored by condition: diagnosis (red circle), relapse (blue square), and healthy (green triangle). PCAs were based on the 5 markers (left) or aberrant markers selected from the 36-marker panel (right). (H) Bar graphs depicting the ranking of the included markers for PC1 and PC2 based on the 5 markers (left) or aberrant markers selected from the extended 36-marker panel (right).

Similar articles

Cited by

References

    1. de Lima M, Porter DL, Battiwalla M, et al. . Proceedings from the National Cancer Institute's Second International Workshop on the Biology, Prevention, and Treatment of Relapse After Hematopoietic Stem Cell Transplantation: part III. Prevention and treatment of relapse after allogeneic transplantation. Biol Blood Marrow Transplant. 2014;20(1):4-13. - PMC - PubMed
    1. Yilmaz M, Wang F, Loghavi S, et al. . Late relapse in acute myeloid leukemia (AML): clonal evolution or therapy-related leukemia? Blood Cancer J. 2019;9(2):7. - PMC - PubMed
    1. Döhner H, Estey E, Grimwade D, et al. . Diagnosis and management of AML in adults: 2017 ELN recommendations from an international expert panel. Blood. 2017;129(4):424-447. - PMC - PubMed
    1. Bonnet D, Dick JE. Human acute myeloid leukemia is organized as a hierarchy that originates from a primitive hematopoietic cell. Nat Med. 1997; 3(7):730-737. - PubMed
    1. Valent P, Bonnet D, De Maria R, et al. . Cancer stem cell definitions and terminology: the devil is in the details. Nat Rev Cancer. 2012;12(11):767-775. - PubMed

Publication types

MeSH terms

Substances