

Developmental changes and metabolic reprogramming during establishment of infection and progression of Trypanosoma brucei brucei through its insect host
- PMID: 34543277
- PMCID: PMC8483307
- DOI: 10.1371/journal.pntd.0009504
Developmental changes and metabolic reprogramming during establishment of infection and progression of Trypanosoma brucei brucei through its insect host
Abstract
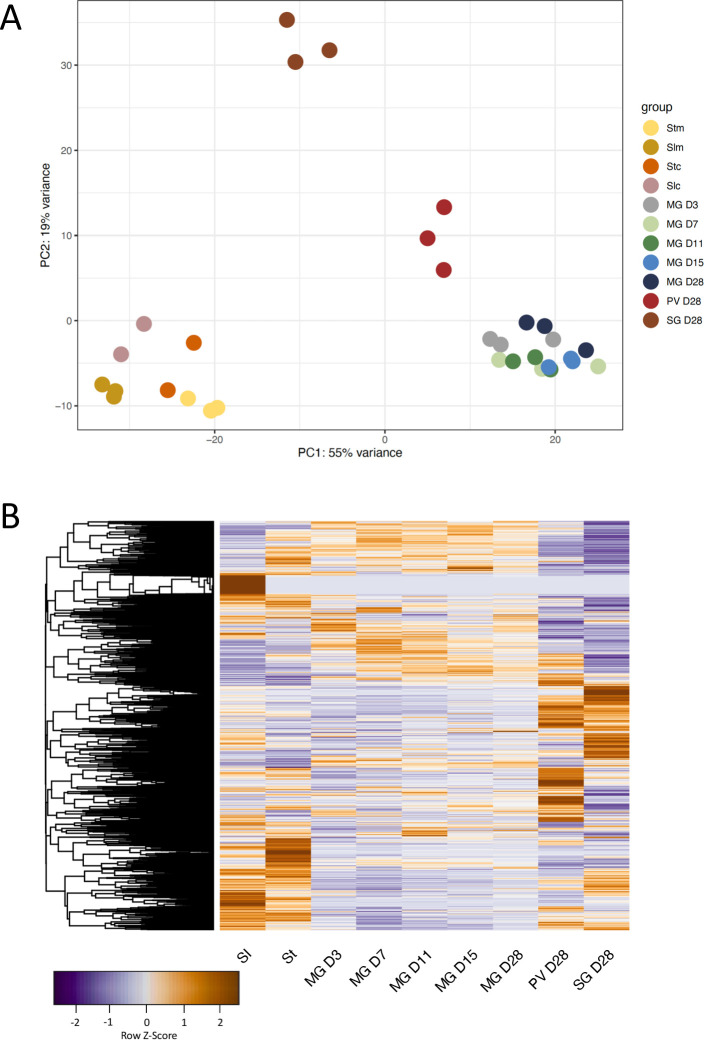
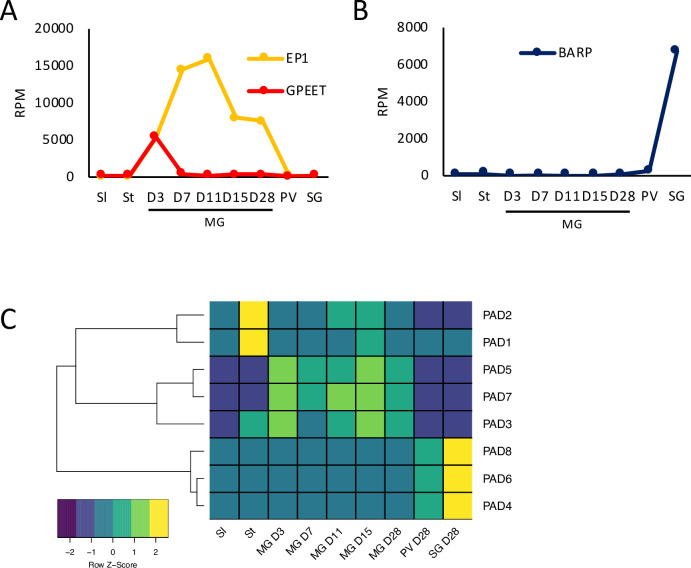
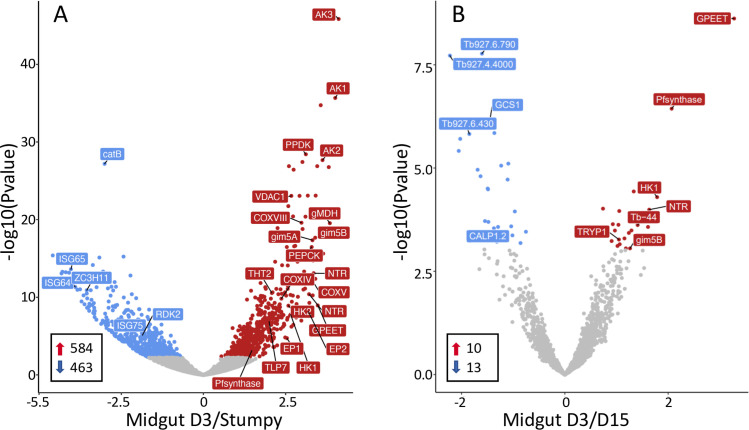
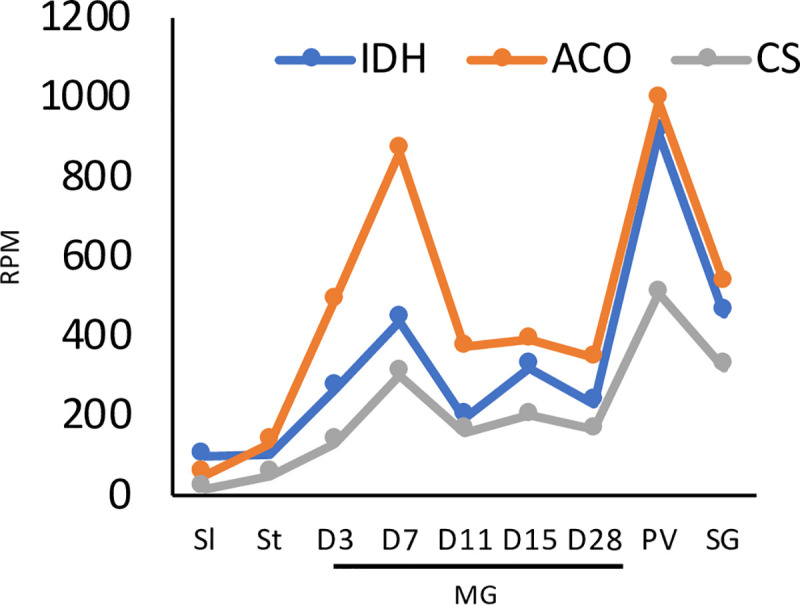
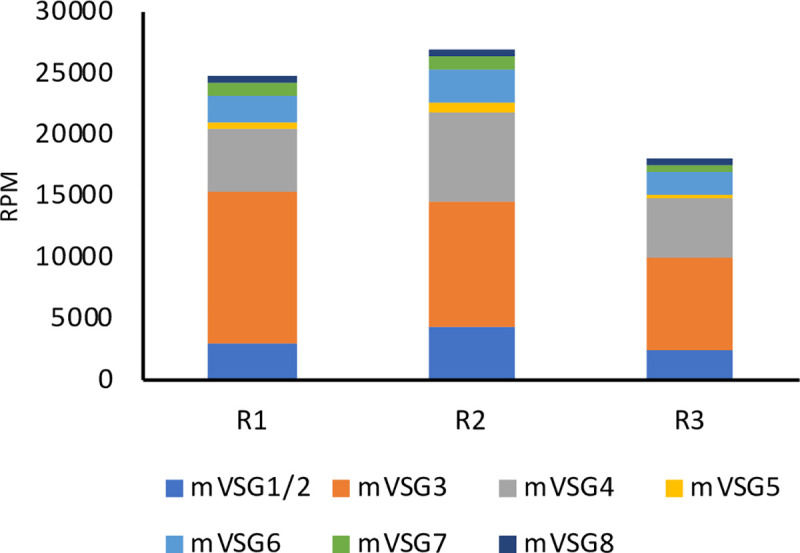
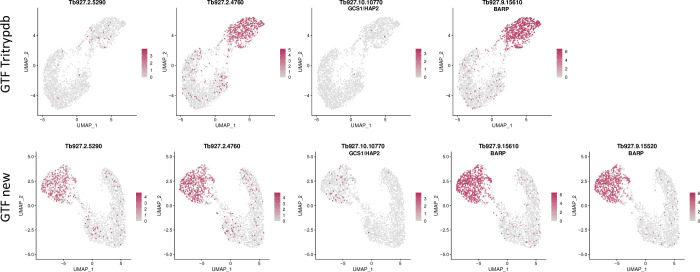
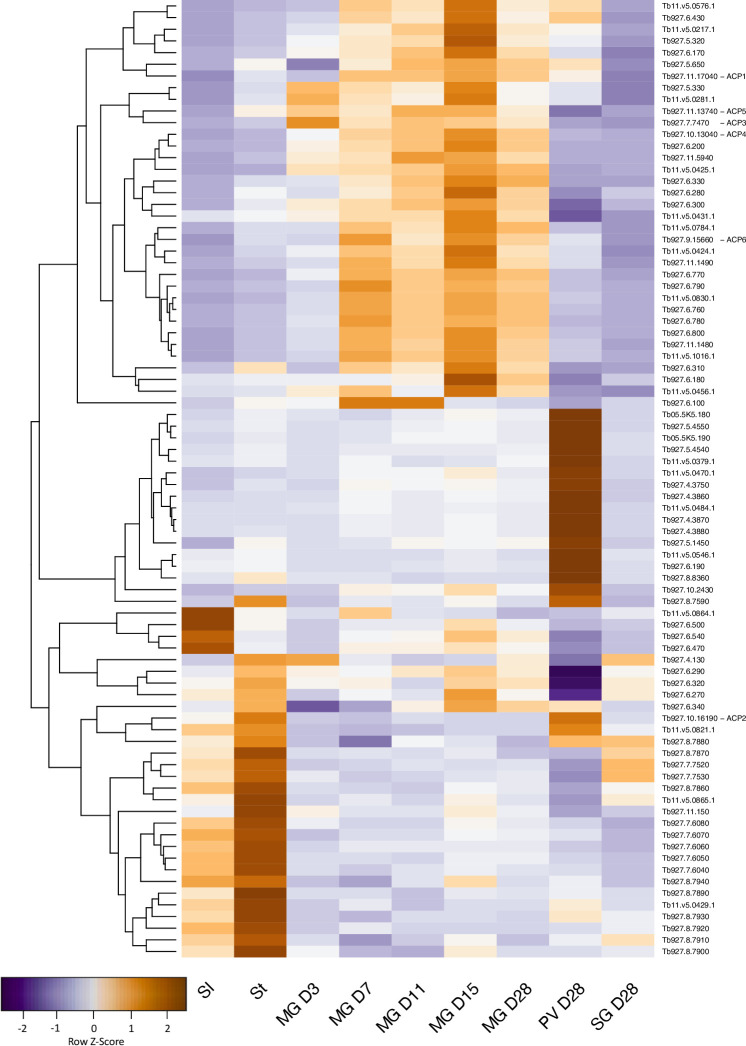
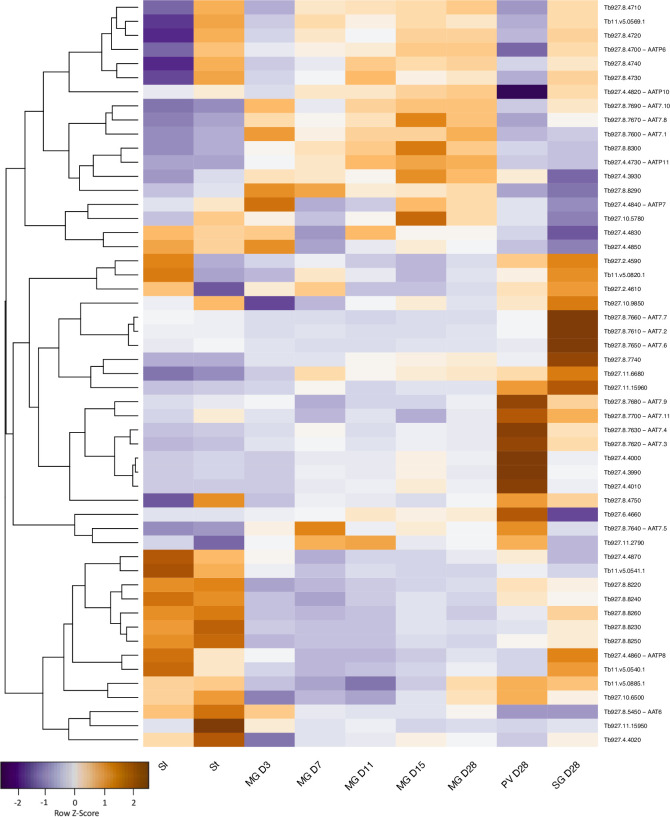
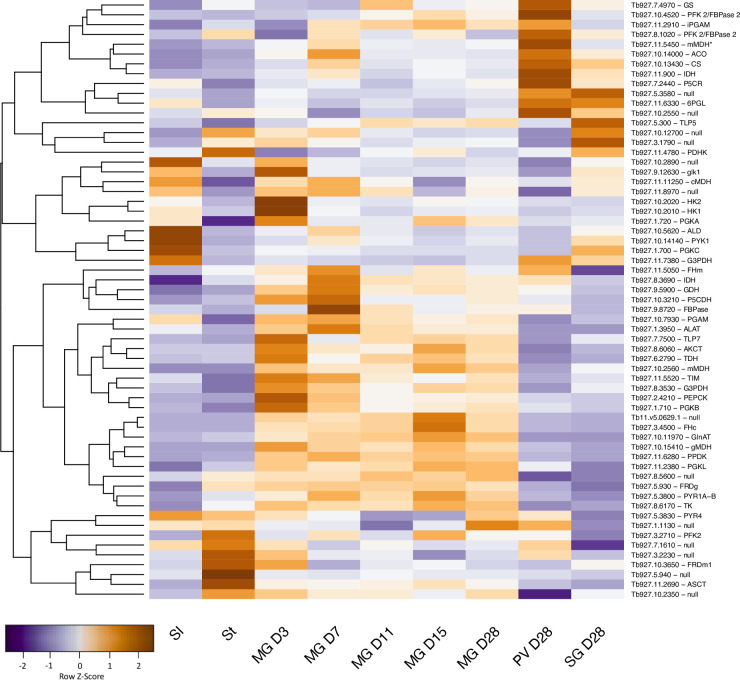
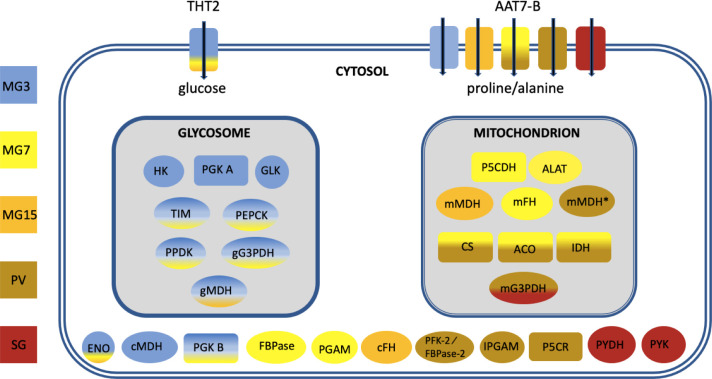
Trypanosoma brucei ssp., unicellular parasites causing human and animal trypanosomiasis, are transmitted between mammals by tsetse flies. Periodic changes in variant surface glycoproteins (VSG), which form the parasite coat in the mammal, allow them to evade the host immune response. Different isolates of T. brucei show heterogeneity in their repertoires of VSG genes and have single nucleotide polymorphisms and indels that can impact on genome editing. T. brucei brucei EATRO1125 (AnTaR1 serodeme) is an isolate that is used increasingly often because it is pleomorphic in mammals and fly transmissible, two characteristics that have been lost by the most commonly used laboratory stocks. We present a genome assembly of EATRO1125, including contigs for the intermediate chromosomes and minichromosomes that serve as repositories of VSG genes. In addition, de novo transcriptome assemblies were performed using Illumina sequences from tsetse-derived trypanosomes. Reads of 150 bases enabled closely related members of multigene families to be discriminated. This revealed that the transcriptome of midgut-derived parasites is dynamic, starting with the expression of high affinity hexose transporters and glycolytic enzymes and then switching to proline uptake and catabolism. These changes resemble the transition from early to late procyclic forms in culture. Further metabolic reprogramming, including upregulation of tricarboxylic acid cycle enzymes, occurs in the proventriculus. Many transcripts upregulated in the salivary glands encode surface proteins, among them 7 metacyclic VSGs, multiple BARPs and GCS1/HAP2, a marker for gametes. A novel family of transmembrane proteins, containing polythreonine stretches that are predicted to be O-glycosylation sites, was also identified. Finally, RNA-Seq data were used to create an optimised annotation file with 5' and 3' untranslated regions accurately mapped for 9302 genes. We anticipate that this will be of use in identifying transcripts obtained by single cell sequencing technologies.
Conflict of interest statement
The authors have declared that no competing interests exist.
Figures
Similar articles
-
Tsetse fly tolerance to T. brucei infection: transcriptome analysis of trypanosome-associated changes in the tsetse fly salivary gland.BMC Genomics. 2016 Nov 25;17(1):971. doi: 10.1186/s12864-016-3283-0. BMC Genomics. 2016. PMID: 27884110 Free PMC article.
-
The establishment of variant surface glycoprotein monoallelic expression revealed by single-cell RNA-seq of Trypanosoma brucei in the tsetse fly salivary glands.PLoS Pathog. 2021 Sep 20;17(9):e1009904. doi: 10.1371/journal.ppat.1009904. eCollection 2021 Sep. PLoS Pathog. 2021. PMID: 34543350 Free PMC article.
-
Single-cell RNA sequencing of Trypanosoma brucei from tsetse salivary glands unveils metacyclogenesis and identifies potential transmission blocking antigens.Proc Natl Acad Sci U S A. 2020 Feb 4;117(5):2613-2621. doi: 10.1073/pnas.1914423117. Epub 2020 Jan 21. Proc Natl Acad Sci U S A. 2020. PMID: 31964820 Free PMC article.
-
Antigenic variation during the developmental cycle of Trypanosoma brucei.J Protozool. 1984 Feb;31(1):41-7. J Protozool. 1984. PMID: 6204043 Review.
-
Flying tryps: survival and maturation of trypanosomes in tsetse flies.Trends Parasitol. 2013 Apr;29(4):188-96. doi: 10.1016/j.pt.2013.02.003. Epub 2013 Mar 16. Trends Parasitol. 2013. PMID: 23507033 Review.
Cited by
-
In silico evolutionary and structural analysis of cAMP response proteins (CARPs) from Leishmania major.Arch Microbiol. 2023 Mar 20;205(4):125. doi: 10.1007/s00203-023-03463-6. Arch Microbiol. 2023. PMID: 36941487
-
Single-cell transcriptomics reveals expression profiles of Trypanosoma brucei sexual stages.PLoS Pathog. 2022 Mar 7;18(3):e1010346. doi: 10.1371/journal.ppat.1010346. eCollection 2022 Mar. PLoS Pathog. 2022. PMID: 35255094 Free PMC article.
-
Cyclic AMP signalling and glucose metabolism mediate pH taxis by African trypanosomes.Nat Commun. 2022 Feb 1;13(1):603. doi: 10.1038/s41467-022-28293-w. Nat Commun. 2022. PMID: 35105902 Free PMC article.
-
Several different sequences are implicated in bloodstream-form-specific gene expression in Trypanosoma brucei.PLoS Negl Trop Dis. 2022 Mar 21;16(3):e0010030. doi: 10.1371/journal.pntd.0010030. eCollection 2022 Mar. PLoS Negl Trop Dis. 2022. PMID: 35312693 Free PMC article.
-
Nanopore-Based Direct RNA Sequencing of the Trypanosoma brucei Transcriptome Identifies Novel lncRNAs.Genes (Basel). 2023 Feb 28;14(3):610. doi: 10.3390/genes14030610. Genes (Basel). 2023. PMID: 36980882 Free PMC article.
References
Publication types
MeSH terms
Substances
Grants and funding
LinkOut - more resources
Full Text Sources
Molecular Biology Databases
