

R-Ras subfamily proteins elicit distinct physiologic effects and phosphoproteome alterations in neurofibromin-null MPNST cells
- PMID: 34530870
- PMCID: PMC8447793
- DOI: 10.1186/s12964-021-00773-4
R-Ras subfamily proteins elicit distinct physiologic effects and phosphoproteome alterations in neurofibromin-null MPNST cells
Abstract
Background: Loss of the Ras GTPase-activating protein neurofibromin promotes nervous system tumor pathogenesis in patients with neurofibromatosis type 1 (NF1). Neurofibromin loss potentially hyperactivates classic Ras (H-Ras, N-Ras, K-Ras), M-Ras, and R-Ras (R-Ras, R-Ras2/TC21) subfamily proteins. We have shown that classic Ras proteins promote proliferation and survival, but not migration, in malignant peripheral nerve sheath tumor (MPNST) cells. However, it is unclear whether R-Ras, R-Ras2 and M-Ras are expressed and hyperactivated in MPNSTs and, if so, whether they contribute to MPNST pathogenesis. We assessed the expression and activation of these proteins in MPNST cells and inhibited them to determine the effect this had on proliferation, migration, invasion, survival and the phosphoproteome.
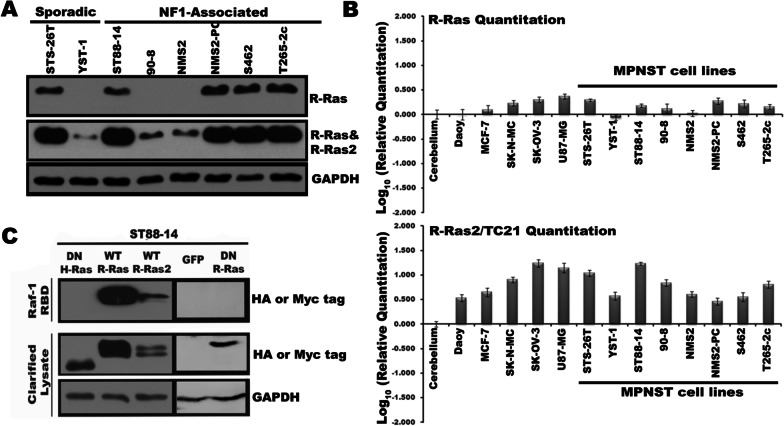
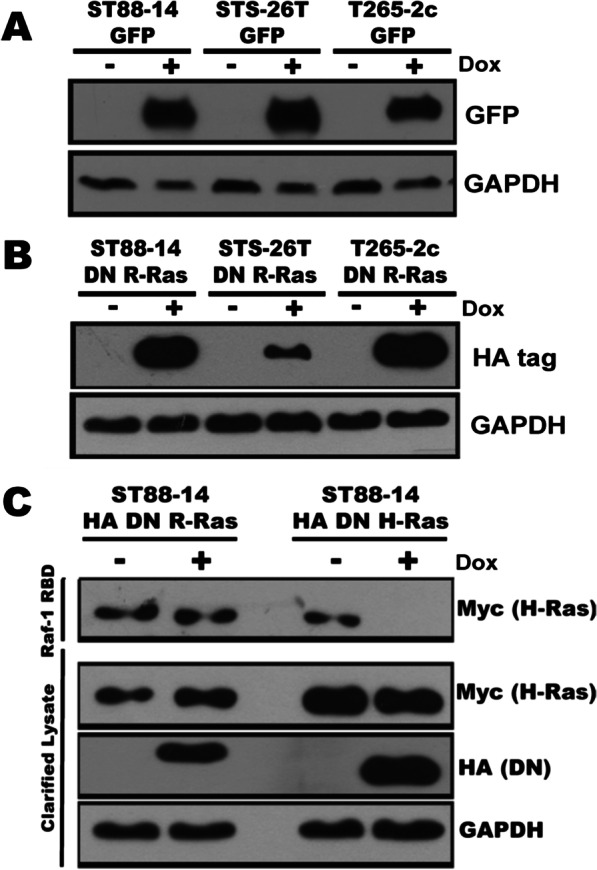
Methods: NF1-associated (ST88-14, 90-8, NMS2, NMS-PC, S462, T265-2c) and sporadic (STS-26T, YST-1) MPNST lines were used. Cells were transfected with doxycycline-inducible vectors expressing either a pan-inhibitor of the R-Ras subfamily [dominant negative (DN) R-Ras] or enhanced green fluorescent protein (eGFP). Methodologies used included immunoblotting, immunocytochemistry, PCR, Transwell migration, 3H-thymidine incorporation, calcein cleavage assays and shRNA knockdowns. Proteins in cells with or without DN R-Ras expression were differentially labeled with SILAC and mass spectrometry was used to identify phosphoproteins and determine their relative quantities in the presence and absence of DN R-Ras. Validation of R-Ras and R-Ras2 action and R-Ras regulated networks was performed using genetic and/or pharmacologic approaches.
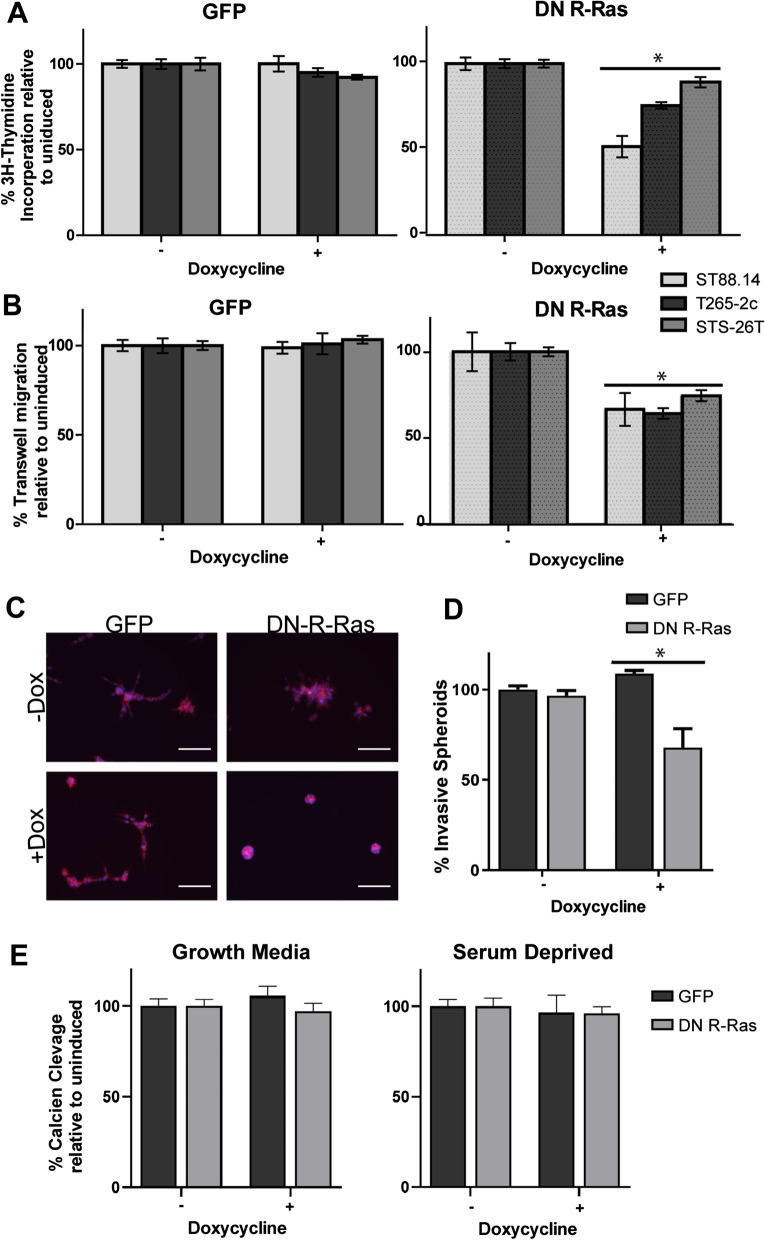
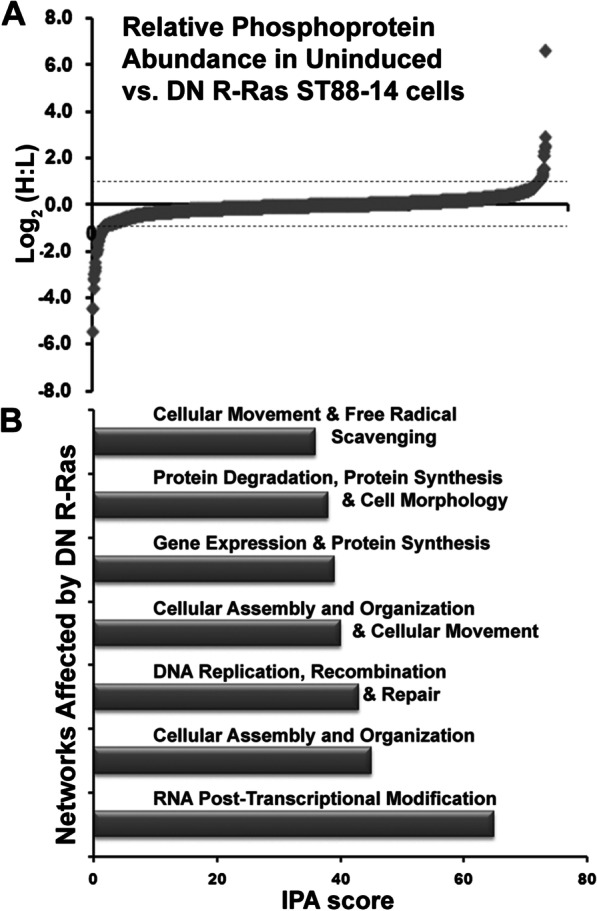
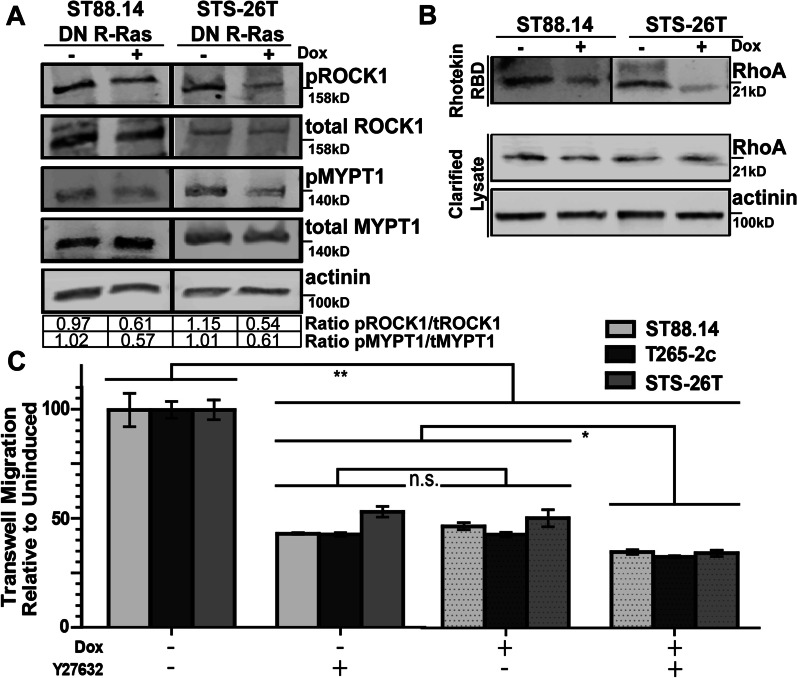
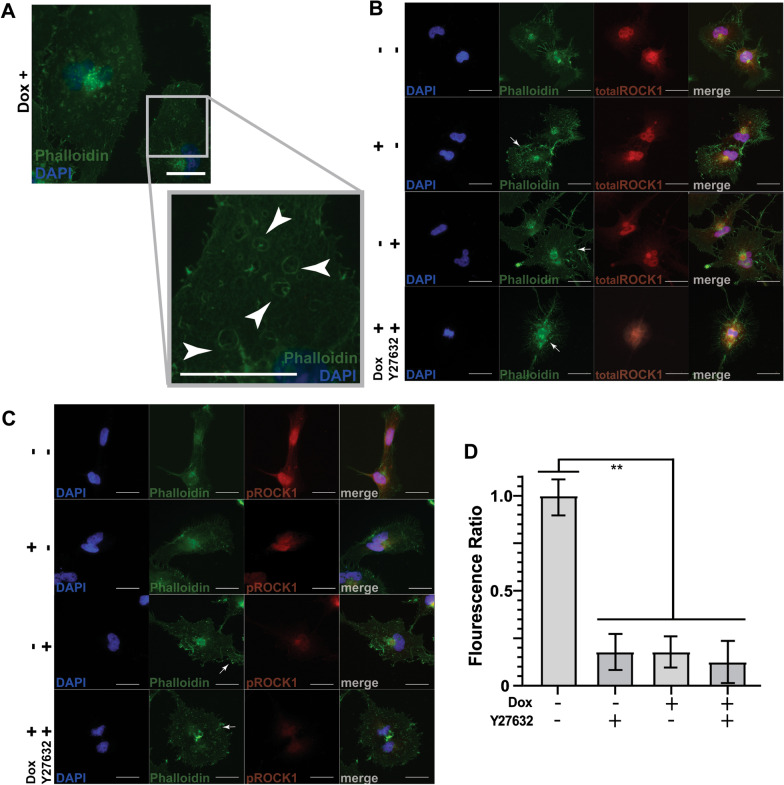
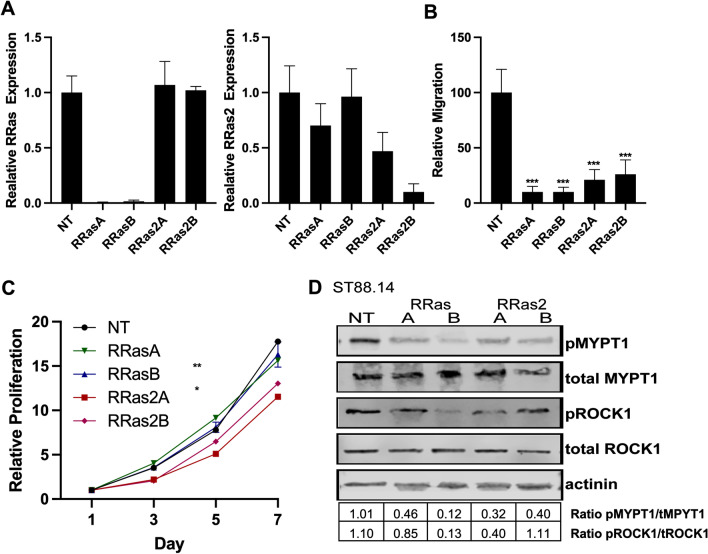
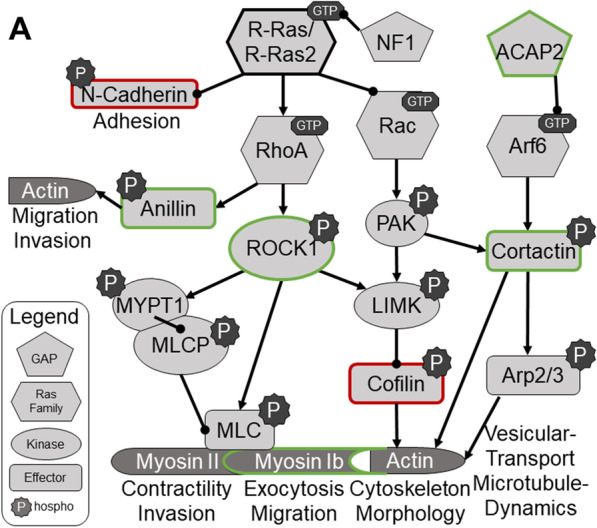
Results: R-Ras2 was uniformly expressed in MPNST cells, with R-Ras present in a major subset. Both proteins were activated in neurofibromin-null MPNST cells. Consistent with classical Ras inhibition, DN R-Ras and R-Ras2 knockdown inhibited proliferation. However, DN R-Ras inhibition impaired migration and invasion but not survival. Mass spectrometry-based phosphoproteomics identified thirteen protein networks distinctly regulated by DN R-Ras, including multiple networks regulating cellular movement and morphology. ROCK1 was a prominent mediator in these networks. DN R-Ras expression and RRAS and RRAS2 knockdown inhibited migration and ROCK1 phosphorylation; ROCK1 inhibition similarly impaired migration and invasion, altered cellular morphology and triggered the accumulation of large intracellular vesicles.
Conclusions: R-Ras proteins function distinctly from classic Ras proteins by regulating distinct signaling pathways that promote MPNST tumorigenesis by mediating migration and invasion. Mutations of the NF1 gene potentially results in the activation of multiple Ras proteins, which are key regulators of many biologic effects. The protein encoded by the NF1 gene, neurofibromin, acts as an inhibitor of both classic Ras and R-Ras proteins; loss of neurofibromin could cause these Ras proteins to become persistently active, leading to the development of cancer. We have previously shown that three related Ras proteins (the classic Ras proteins) are highly activated in malignant peripheral nerve sheath tumor (MPNST) cells with neurofibromin loss and that they drive cancer cell proliferation and survival by activating multiple cellular signaling pathways. Here, we examined the expression, activation and action of R-Ras proteins in MPNST cells that have lost neurofibromin. Both R-Ras and R-Ras2 are expressed in MPNST cells and activated. Inhibition of R-Ras action inhibited proliferation, migration and invasion but not survival. We examined the activation of cytoplasmic signaling pathways in the presence and absence of R-Ras signaling and found that R-Ras proteins regulated 13 signaling pathways distinct from those regulated by classic Ras proteins. Closer study of an R-Ras regulated pathway containing the signaling protein ROCK1 showed that inhibition of either R-Ras, R-Ras2 or ROCK1 similarly impaired cellular migration and invasion and altered cellular morphology. Inhibition of R-Ras/R-Ras2 and ROCK1 signaling also triggered the accumulation of abnormal intracellular vesicles, indicating that these signaling molecules regulate the movement of proteins and other molecules in the cellular interior. Video Abstract.
Keywords: Malignant peripheral nerve sheath tumor; Neurofibromatosis; R-Ras; Ras; TC21.
© 2021. The Author(s).
Conflict of interest statement
The authors declare that they have no competing interests.
Figures
Similar articles
-
Depressing time: Waiting, melancholia, and the psychoanalytic practice of care.In: Kirtsoglou E, Simpson B, editors. The Time of Anthropology: Studies of Contemporary Chronopolitics. Abingdon: Routledge; 2020. Chapter 5. In: Kirtsoglou E, Simpson B, editors. The Time of Anthropology: Studies of Contemporary Chronopolitics. Abingdon: Routledge; 2020. Chapter 5. PMID: 36137063 Free Books & Documents. Review.
-
Ceftazidime with avibactam for treating severe aerobic Gram-negative bacterial infections: technology evaluation to inform a novel subscription-style payment model.Health Technol Assess. 2024 Oct;28(73):1-230. doi: 10.3310/YAPL9347. Health Technol Assess. 2024. PMID: 39487661 Free PMC article.
-
Using Experience Sampling Methodology to Capture Disclosure Opportunities for Autistic Adults.Autism Adulthood. 2023 Dec 1;5(4):389-400. doi: 10.1089/aut.2022.0090. Epub 2023 Dec 12. Autism Adulthood. 2023. PMID: 38116059 Free PMC article.
-
"I've Spent My Whole Life Striving to Be Normal": Internalized Stigma and Perceived Impact of Diagnosis in Autistic Adults.Autism Adulthood. 2023 Dec 1;5(4):423-436. doi: 10.1089/aut.2022.0066. Epub 2023 Dec 12. Autism Adulthood. 2023. PMID: 38116050 Free PMC article.
-
Strategies to improve smoking cessation rates in primary care.Cochrane Database Syst Rev. 2021 Sep 6;9(9):CD011556. doi: 10.1002/14651858.CD011556.pub2. Cochrane Database Syst Rev. 2021. PMID: 34693994 Free PMC article. Review.
Cited by
-
Changes of RAS Pathway Phosphorylation in Lymphoblastoid Cell Lines from Noonan Syndrome Patients Carrying Hypomorphic Variants in Two NS Genes.Int J Mol Sci. 2023 Feb 17;24(4):4035. doi: 10.3390/ijms24044035. Int J Mol Sci. 2023. PMID: 36835447 Free PMC article.
-
RAS and beyond: the many faces of the neurofibromatosis type 1 protein.Dis Model Mech. 2022 Feb 1;15(2):dmm049362. doi: 10.1242/dmm.049362. Epub 2022 Feb 21. Dis Model Mech. 2022. PMID: 35188187 Free PMC article.
-
LPAR1 and aberrantly expressed LPAR3 differentially promote the migration and proliferation of malignant peripheral nerve sheath tumor cells.Glia. 2023 Mar;71(3):742-757. doi: 10.1002/glia.24308. Epub 2022 Nov 23. Glia. 2023. PMID: 36416236 Free PMC article.
-
The therapeutic potential of neurofibromin signaling pathways and binding partners.Commun Biol. 2023 Apr 20;6(1):436. doi: 10.1038/s42003-023-04815-0. Commun Biol. 2023. PMID: 37081086 Free PMC article. Review.
-
Inhibition of Erb-B2 Receptor Tyrosine Kinase 3 and Associated Regulatory Pathways Potently Impairs Malignant Peripheral Nerve Sheath Tumor Proliferation and Survival.Am J Pathol. 2023 Sep;193(9):1298-1318. doi: 10.1016/j.ajpath.2023.05.016. Epub 2023 Jun 14. Am J Pathol. 2023. PMID: 37328102 Free PMC article.
References
-
- Orita S, Kaibuchi K, Kuroda S, Shimizu K, Nakanishi H, Takai Y. Comparison of kinetic properties between two mammalian ras p21 GDP/GTP exchange proteins, ras guanine nucleotide-releasing factor and smg GDP dissociation stimulation. J Biol Chem. 1993;268:25542–25546. doi: 10.1016/S0021-9258(19)74425-1. - DOI - PubMed
Publication types
MeSH terms
Substances
Grants and funding
- P30 NS057098/NS/NINDS NIH HHS/United States
- F30 NS063626/NS/NINDS NIH HHS/United States
- R01 NS109655/NS/NINDS NIH HHS/United States
- U54 CA210963/CA/NCI NIH HHS/United States
- P30 DK079337/DK/NIDDK NIH HHS/United States
- K12 HD076224/HD/NICHD NIH HHS/United States
- P30 AR050948/AR/NIAMS NIH HHS/United States
- R01 CA122804/CA/NCI NIH HHS/United States
- P30 NS047466/NS/NINDS NIH HHS/United States
- W81XWH-12-1-0164/Congressionally Directed Medical Research Programs
- F30 CA247139/CA/NCI NIH HHS/United States
- F31 NS081825/NS/NINDS NIH HHS/United States
- R01 NS048353/NS/NINDS NIH HHS/United States
- F31 NS081824/NS/NINDS NIH HHS/United States
- S10 RR027822/RR/NCRR NIH HHS/United States
- X81XWH-09-1-0086/Congressionally Directed Medical Research Programs
LinkOut - more resources
Full Text Sources
Molecular Biology Databases
Research Materials
Miscellaneous
