. 2021 Sep 15;12(1):5156.
doi: 10.1038/s41467-021-25459-w.

USP11 controls R-loops by regulating senataxin proteostasis

Affiliations

USP11 controls R-loops by regulating senataxin proteostasis

Mateusz Jurga et al. Nat Commun. .

Abstract

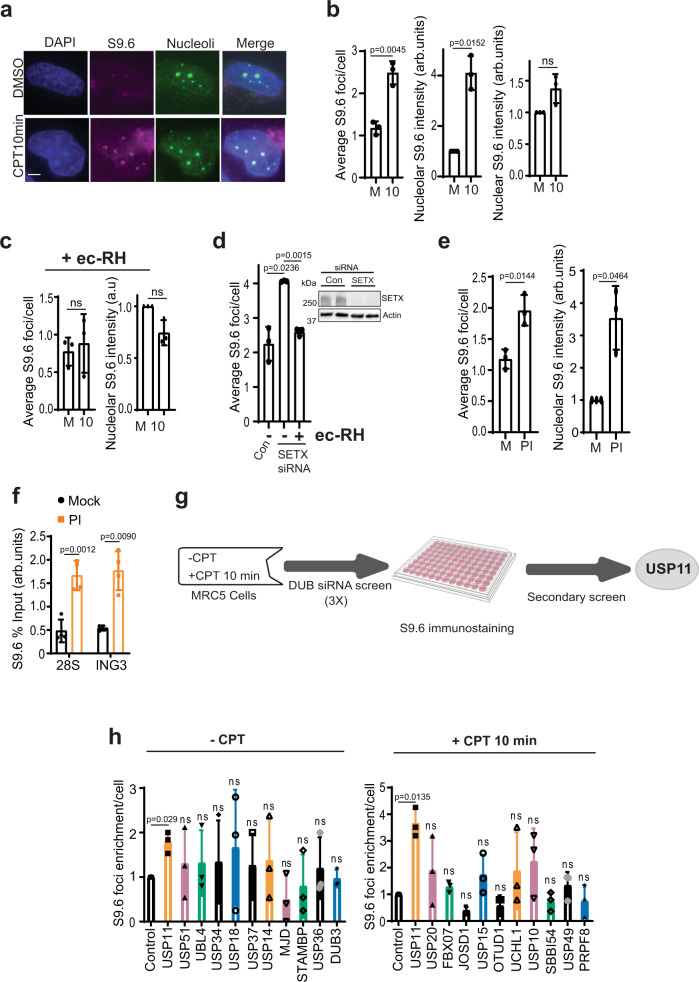
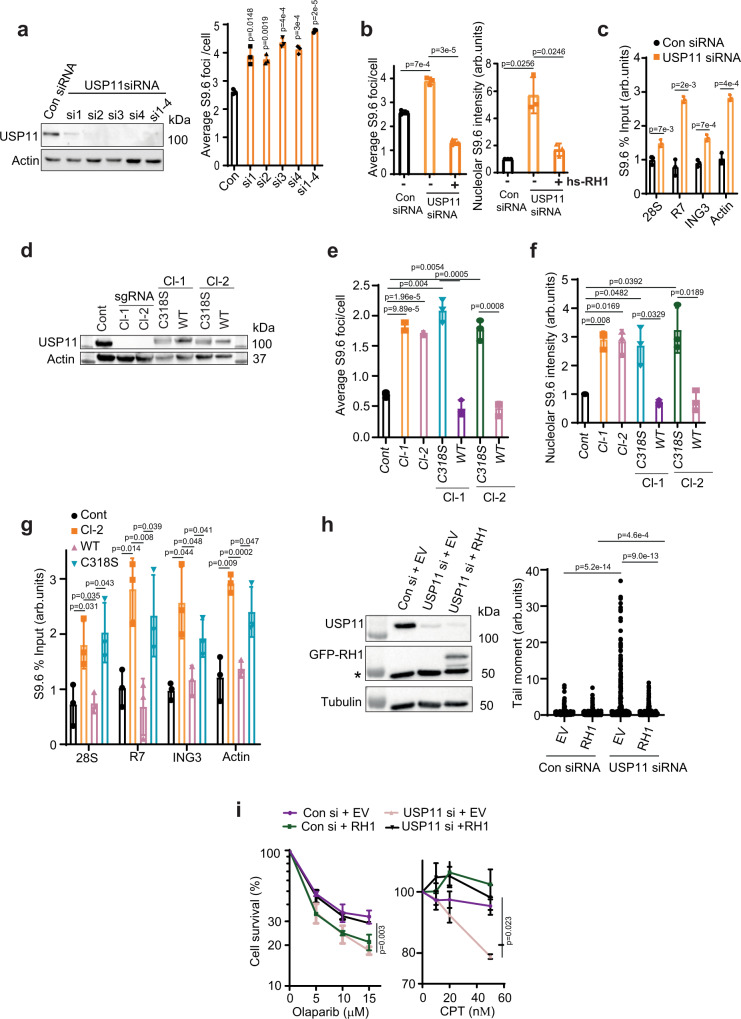
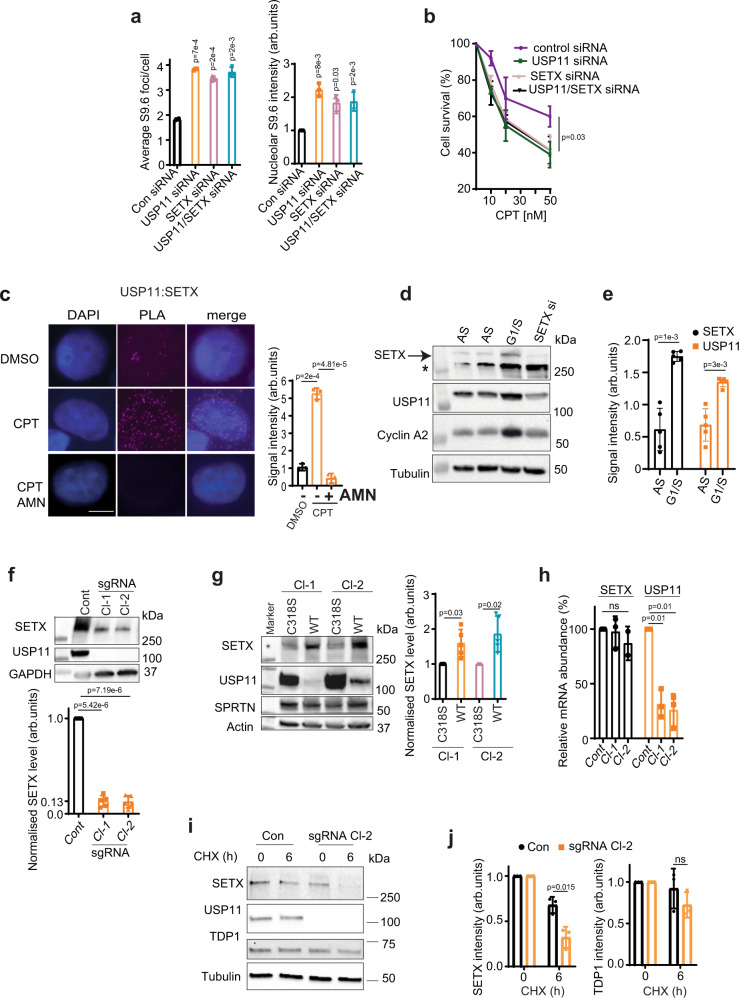
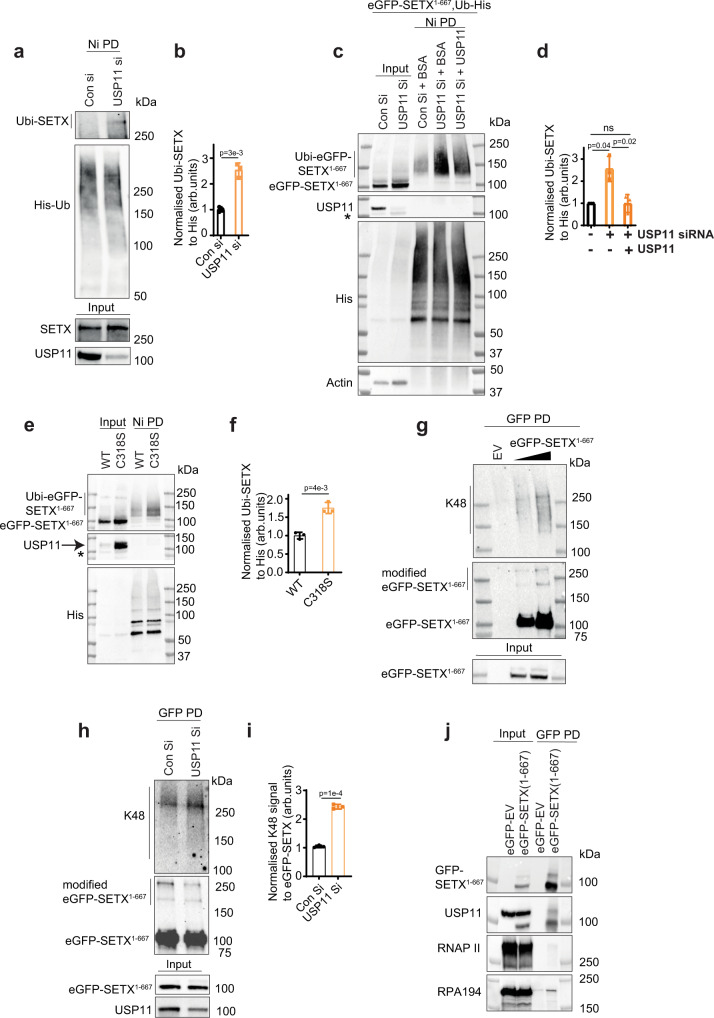
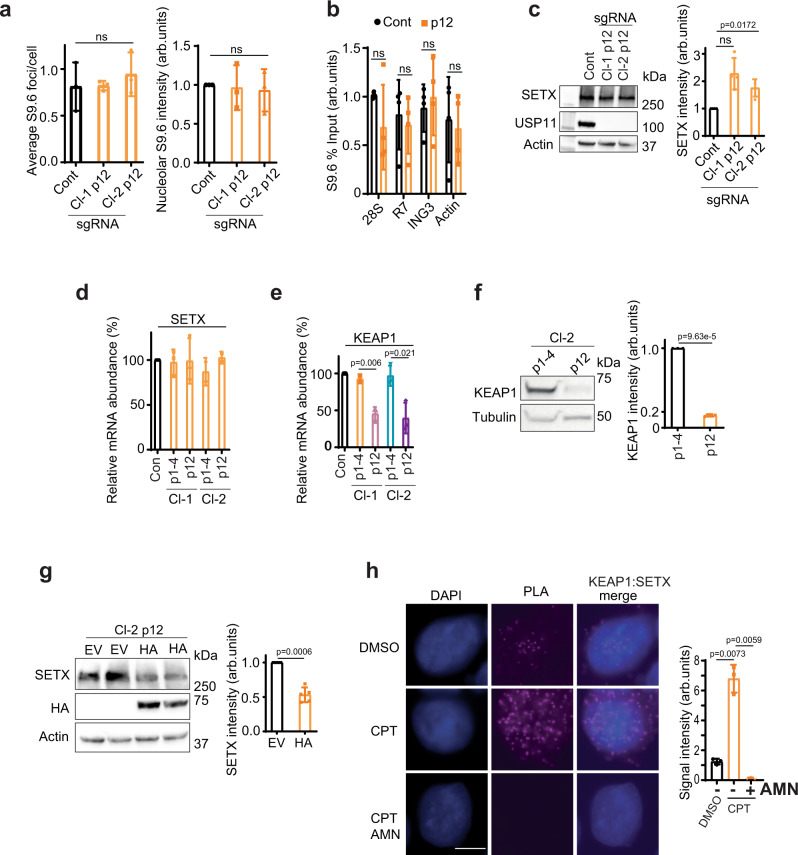
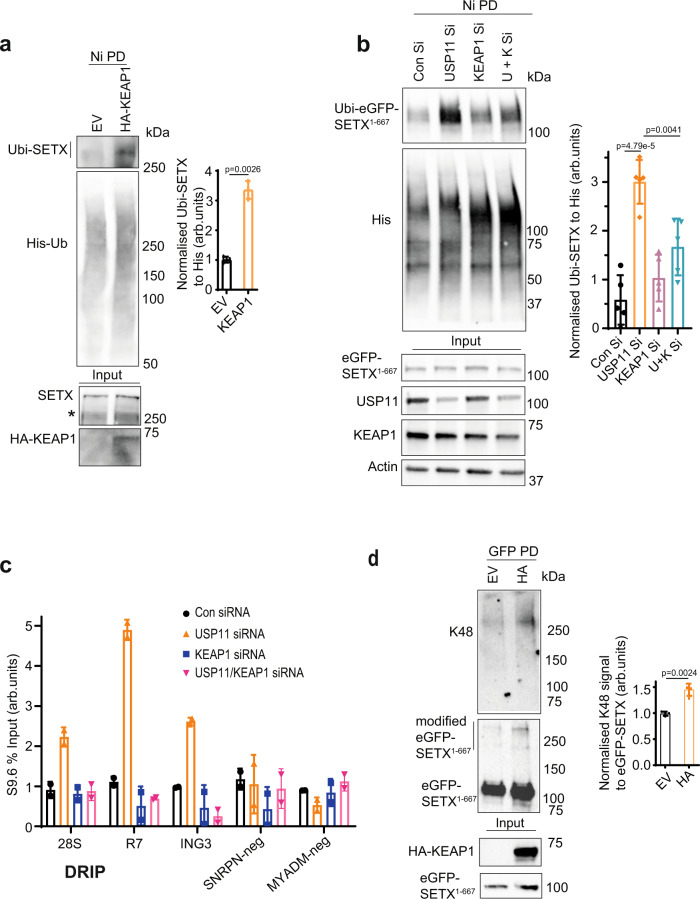
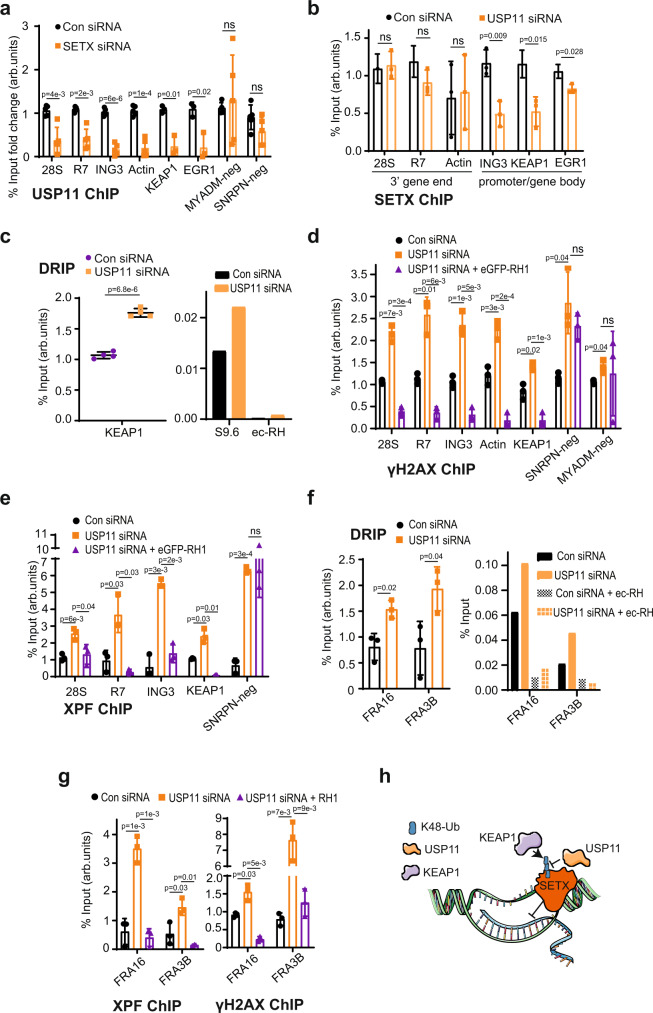
R-loops are by-products of transcription that must be tightly regulated to maintain genomic stability and gene expression. Here, we describe a mechanism for the regulation of the R-loop-specific helicase, senataxin (SETX), and identify the ubiquitin specific peptidase 11 (USP11) as an R-loop regulator. USP11 de-ubiquitinates SETX and its depletion increases SETX K48-ubiquitination and protein turnover. Loss of USP11 decreases SETX steady-state levels and reduces R-loop dissolution. Ageing of USP11 knockout cells restores SETX levels via compensatory transcriptional downregulation of the E3 ubiquitin ligase, KEAP1. Loss of USP11 reduces SETX enrichment at KEAP1 promoter, leading to R-loop accumulation, enrichment of the endonuclease XPF and formation of double-strand breaks. Overexpression of KEAP1 increases SETX K48-ubiquitination, promotes its degradation and R-loop accumulation. These data define a ubiquitination-dependent mechanism for SETX regulation, which is controlled by the opposing activities of USP11 and KEAP1 with broad applications for cancer and neurological disease.


Conflict of interest statement

The authors declare no competing interests.

Figures

Fig. 1
Fig. 1. A genetic screen uncovers USP11 as a novel R-loop regulator.
a MRC-5 cells were treated with DMSO or 25 µM camptothecin (CPT) for 10 min and immediately harvested for S9.6/nucleolin immunofluorescence. Representative confocal images from three biological repeats are shown, scale bar = 3 µm. b MRC-5 cells were treated with DMSO (Mock; M) or 25 µM CPT (10) for 10 min and immediately collected for S9.6/nucleolin immunofluorescence. Data are the average ± SD from 3 biological repeats, each containing at least 100 cells. The average number of S9.6 foci/cell was calculated (left panel). The total nucleolar (middle panel) and nuclear (right panel) S9.6 fluorescence was measured using ImageJ and normalized to mock. ns; p > 0.05, two-tailed Student’s t-test. c MRC-5 cells were treated with DMSO (Mock; M) or 25 µM CPT (10) and then incubated with RNase-H (ec-RH). Cells were then processed for S9.6/nucleolin immunostaining. Data are the average ± SD from 3 biological repeats, each containing at least 100 cells. The average number of S9.6 foci/cell was calculated (left panel) and total nucleolar S9.6 fluorescence was measured and normalized to mock (right panel). ns; p > 0.05, two-tailed Student’s t-test. d MRC-5 cells were transfected with SETX or scrambled (Con) siRNAs and incubated with RNase-H (ec-RH). Cells were processed for S9.6 immunostaining. The average number of S9.6 foci/cell was calculated and data represent average ± SD from three biological repeats, each containing at least 100 cells. Two-tailed Student’s t-test. Insert, western blotting showing SETX protein expression with Actin as a loading control. e MRC-5 cells were incubated with DMSO (Mock; M) or 25 µM MG132 (proteasomal inhibitor, PI) followed by S9.6/nucleolin immunostaining. Data are the average ± SD from 3 biological repeats, each containing at least 100 cells. The average number of S9.6 foci/cell was calculated (left panel) and total nucleolar S9.6 fluorescence normalized to mock (right panel). *p < 0.05, two-tailed Student’s t-test. f HEK-293 cells were mock incubated with DMSO or 25 µM MG132 (PI) followed by DNA/RNA immunoprecipitation (DRIP) using S9.6 antibodies. Quantitative PCR was conducted using primers targeting nucleolar (28S) and nuclear (ING3) loci. The data represent the average ± SD from four biological repeats. Raw % input values are shown in Supplementary Fig. 1b. Two-tailed Student’s t-test. g Flowchart depicting the design of S9.6 genetic screen. A secondary S9.6 screen was conducted in a 24-well format, which uncovered USP11 as a new R-loop regulator. h The DUB siRNA screen was performed as described above and data from selected DUBs are presented showing average S9.6 foci/cell normalized to scrambled siRNA controls from three biological repeats ± SD. ns; p > 0.05, two-tailed Student’s t-test.
Fig. 2
Fig. 2. Loss of USP11 triggers R-loop accumulation and R-loop-dependent DNA damage.
a MRC-5 cells were transfected with scrambled siRNA (Con), four different siRNA sequences targeting different regions in USP11 (si1–si4) or pooled siRNA containing all four siRNAs (si1–4). Depletion of USP11 was examined by immunoblotting (left panel) and by immunofluorescence (right panel). The average number ± SD of S9.6 foci per cell was calculated from 3 biological repeats each containing at least 100 cells. b MRC-5 cells were transfected with USP11 or scrambled 50 nM siRNA (Con) and with human RNase H1 (hs-RH1). Cells were then processed for S9.6/nucleolin immunostaining. Data are the average ± SD from 3 biological repeats, each containing at least 100 cells and presented as the average number of S9.6 foci/cell (left panel) and mean S9.6 nucleolar intensity (right panel). p-Values calculated using two-tailed Student’s t-test. c Lysates from Control (Con siRNA) and USP11-depleted cells (USP11 siRNA) were subjected to DNA/RNA immunoprecipitation (DRIP) using S9.6 antibodies. Quantitative PCR was conducted using primers targeting nucleolar (28S and R7) and nuclear (ING3 and actin) loci. The data represent the average ± SD from three biological repeats. Raw % input values are shown in Supplementary Fig. 1d. p-Values calculated using two-tailed Student’s t-test. d HEK-293 cells were transfected with a vector expressing Cas9 and sgRNA targeting exon 1 of USP11. USP11-knockout clones were then stably complemented by vectors encoding full-length FLAG-HA-USP11 (WT) or catalytically inactive FLAG-HA-USP11C318S mutant (C318S). The images are representative of three biological repeats. e, f USP11 sgRNA clones (Cl-1 and Cl-2) and those complemented with WT USP11 or the C318S mutant were examined by S9.6/nucleolin immunofluorescence. The average number of S9.6 foci/cell (e) and total nucleolar fluorescence normalized to control (Cont) cells (f) were calculated from 3 biological repeats, each containing at least 100 cells and presented as average ± SD. p-Values calculated using two-tailed Student’s t-test. g Lysates from Control (Cont) and USP11 sgRNA Cl-2 and USP11 sgRNA Cl-2 complemented with USP11 (WT) or catalytically inactive USP11C318S mutant (C318S) were subjected to DNA/RNA immunoprecipitation using S9.6 antibodies. Quantitative PCR was conducted using primers targeting nucleolar (28S and R7) and nuclear (ING3 and actin) loci. The data represent the average ± SD from three biological repeats. Raw % input values are shown in Supplementary Fig. 2c. p-Values calculated using two-tailed Student’s t-test. h Control (Con si) and USP11-depleted MRC-5 cells (USP11si) were transfected with plasmids encoding eGFP-EV (EV) or eGFP-RNase H1 (RH1). The expression level of USP11, eGFP-Rnase H1 and Tubulin was analysed by immunoblotting. * denotes a nonspecific band (left panel). Chromosomal breaks were quantified by an alkaline comet assay and data represent the average of 3 biological replicates ± SD, each containing 125 cells (right panel). p-Values calculated using two-tailed Student’s t-test. i MRC-5 cells transfected with Control (control) or USP11 siRNA and eGFP-EV (EV) or eGFP-RNase H1 (RH1) were incubated with the indicated doses of Olaparib or CPT and left to grow for 7 days. The surviving colonies were counted and % survival calculated relative to mock-treated cells. Data are the average ± SEM from three biological repeats. p-Values calculated using two-tailed Student’s t-test.
Fig. 3
Fig. 3. USP11 and SETX work together to regulate R-loop homeostasis.
a MRC-5 cells treated with control (Con), USP11, SETX or USP11 and SETX siRNA were analysed by S9.6/nucleolin immunostaining. Data are the average ± SD from 3 biological repeats, each containing at least 100 cells and presented as average number of S9.6 foci/cell (left panel) and mean S9.6 nucleolar intensity (right panel). p-Values calculated using two-tailed Student’s t-test. b MRC-5 cells treated with control (Con), USP11, SETX or USP11 and SETX siRNA were incubated with the indicated doses of CPT for 1 h and left to grow for 7 days. The surviving colonies were counted and % survival calculated relative to mock-treated cells. Data are the mean ± SD from three biological repeats. p-Values calculated using two-tailed Student’s t-test. c MRC-5 cells mock treated with DMSO (DMSO), 25 µM CPT for 10 min or α-amanitin (AMN) overnight followed by CPT were subjected to proximity ligation assay using antibodies against endogenous USP11 and SETX. Representative images are shown, scale bar is equal to 10 µm (left panel). The signal intensity was measured using ImageJ (right panel). Data are the mean ± SD from three biological repeats. p-Values calculated using two-tailed Student’s t-test. d HEK-293 cells were synchronized to G1/S boundary (G1/S) by a double-thymidine block. Asynchronized (AS) cells served as a control. The expression level of SETX, USP11, cyclin A2 and tubulin was analysed by immunoblotting. * denotes a nonspecific band. The images are representative of three biological repeats. e The band intensity of SETX and USP11 was quantified from five biological repeats of d, normalized to tubulin and then presented as fold increase of the mean ± SD compared to asynchronized samples. p-Values calculated using two-tailed Student’s t-test. f Lysates from Control (Cont) and USP11-knockout HEK-293 cells (sgRNA Cl-1 and Cl-2) were fractionated by SDS-PAGE and analysed by immunoblotting using SETX, USP11 and GAPDH antibodies (top panel). SETX band intensities were normalized to GAPDH and presented as fold reduction compared to levels in control parental cells (bottom panel). Data are the average of five biological repeats and presented as mean ± SD. p-Values calculated using two-tailed Student’s t-test two-tailed Student’s t-test. g Lysates from USP11 sgRNA Cl-1 and Cl-2 complemented with wild-type USP11 (WT) or catalytically inactive USP11C318S mutant (C318S) were fractionated by SDS-PAGE and analysed by immunoblotting using SETX, USP11, SPRTN and actin antibodies (left panel). SETX band intensities were normalized to actin and presented as fold increase as compared to C318S cells (right panel). Data are the average of five biological repeats and presented as mean ± SD. p-Values calculated using two-tailed Student’s t-test. h Total RNA was extracted from USP11-knockout clones at passage 2–7 (sgRNA Cl-1 and 2) and control cells (Cont), reverse transcribed to cDNA, and USP11 and SETX transcripts were quantified by qPCR. Data are the mean of three biological repeats ± SD, normalized to actin transcript levels and presented as % reduction compared to controls. ns; p > 0.05, two-tailed Student’s t-test. i Parental HEK-293 (Con) and USP11 sgRNA Cl-2 cells were incubated with cycloheximide (CHX). The expression level of SETX, USP11, TDP1 and Tubulin was analysed by immunoblotting. The images are representative of three biological repeats. j The band intensity of SETX and TDP1 following incubation with CHX was quantified from three biological repeats, normalized to tubulin and then presented as fold reduction of the mean ± SD compared to untreated samples; p > 0.05, two-tailed Student’s t-test.
Fig. 4
Fig. 4. USP11 regulates SETX ubiquitination.
a, b Control (Con si) and USP11-depleted HEK-293 cells (USP11 si) were transfected with Ub-His plasmid, treated with MG132 overnight (PI), lysed and subjected to nickel pull-down under denaturing conditions to purify ubiquitinated proteins. Samples were fractionated by SDS-PAGE and analysed by immunoblotting using anti-SETX, USP11 and His antibodies. a The band intensities of Ubi-SETX were normalized to His-Ub and presented as fold increase of SETX ubiquitination compared to controls (b). Data are the average ± SD from three biological repeats. p-Values calculated using two-tailed Student’s t-test. c, d Purification of Ubi-eGFP-SETX1–667 was conducted as described above followed by incubation of the nickel beads with BSA or recombinant USP11 in a deubiquitination buffer. Samples were fractionated by SDS-PAGE and analysed by immunoblotting using anti-GFP, USP11, His and actin antibodies. * denotes a nonspecific band (c). The band intensities of Ubi-eGFP-SETX1–667 were normalized to His-Ub and presented as fold increase of SETX ubiquitination compared to controls (d). Data are the average ± SD from three biological repeats. ns; p > 0.05, two-tailed Student’s t-test. e, f USP11 sgRNA Cl-2 cells expressing wild-type USP11 (WT) or the catalytically inactive USP11C318S mutant (C318S) were transfected with plasmids encoding eGFP-SETX1–667 and Ub-His; and ubiquitinated eGFP-SETX1–667 was purified using Nickel pull-down under denaturing conditions. * denotes a nonspecific band (e). The band intensities of Ubi-eGFP-SETX1–667 were normalized to His-Ub and presented as fold increase of SETX ubiquitination compared to WT (f). Data are the average ± SD from three biological repeats. p-Values calculated using two-tailed Student’s t-test. g HEK-293 cells expressing an empty vector-eGFP (EV) or eGFP-SETX1–667 were lysed under denaturing conditions and subjected to GFP pull-down to purify eGFP-SETX1–667. Samples were fractionated by SDS-PAGE and analysed by immunoblotting using anti-GFP and K48 antibodies. The images are representative of three biological repeats. h, i HEK-293 cells expressing eGFP-SETX1–667 were transfected with control siRNA (Con Si) or USP11 siRNA (USP11 Si), lysed and subjected to GFP pull-down under denaturing conditions to purify eGFP-SETX1–667. Samples were fractionated by SDS-PAGE and analysed by immunoblotting using anti-GFP, K48 and USP11 antibodies (h). The intensity of K48 signal was normalized to pulled down eGFP-SETX1–667 signal and presented as fold increase of SETX K48-ubiquitination in USP11 Si cells compared to controls (i). Data are the average ± SD from three biological repeats. p-Values calculated using two-tailed Student’s t-test. j HEK-293 cell lysates expressing an empty vector-eGFP (EV-GFP) or eGFP-SETX1–667 were subjected to GFP pull-down and analysed by immunoblotting using antibodies against GFP, USP11, RNA polymerase II (RNAPII) and RNA polymerase I (RPA-194).
Fig. 5
Fig. 5. Aged USP11-knockout cells restore SETX and R-loop levels via downregulation of KEAP1.
a Parental HEK-293 cells (Cont) and USP11-knockout clones 1 and 2 (Cl-1 and Cl-2) at passage 1–14 (p12) were examined for R-loop levels using S9.6/nucleolin immunostaining. The average number of S9.6 foci/cell (left panel) and total nucleolar fluorescence normalized to control cells (right panel) were calculated from three biological repeats, each containing at least 100 cells and presented as average ± SD. ns; p > 0.05, two-tailed Student’s t-test. b Lysates from Control (Cont) and USP11-knockout clone-2 at passage 12–15 (p12) were subjected to DNA/RNA immunoprecipitation (DRIP) using S9.6 antibodies. Quantitative PCR was conducted using primers targeting nucleolar (28S and R7) and nuclear (ING3 and actin) loci. The data represent the average ± SD from four biological repeats. Raw % input values are shown in Supplementary Fig. 5b. ns; p > 0.05, two-tailed Student’s t-test. c Lysates from parental HEK-293 cells (Cont) and USP11-knockout clones 1 and 2 (Cl-1 and Cl-2) at passage 12–14 (p12) were fractionated by SDS-PAGE and analysed by immunoblotting (left panel). SETX band intensities were normalized to actin and presented as fold increase compared to control cells (right panel). Data are the mean of four biological repeats ± SD. ns; p > 0.05, two-tailed Student’s t-test. d, e Total RNA was extracted from young (p1–4) and aged (p12–15; p12) USP11 sgRNA clones, reverse transcribed to cDNA and transcript levels of SETX and KEAP1 were quantified by qPCR. SETX and KEAP1 mRNA levels were first normalized to actin and then presented as % change compared to levels in control cells. Data are the mean ± SD from three biological repeats. p-Values calculated using two-tailed Student’s t-test. f Lysates from young (p1–4) and aged (p12–15, p12) USP11 sgRNA clone-2 (Cl-2) were fractionated by SDS-PAGE and analysed by immunoblotting (left panel). KEAP1 band intensities were normalized to tubulin and presented as fold decrease compared to p1–4 (right panel). Data are the mean of three biological repeats ± SD. p-Values calculated using two-tailed Student’s t-test. g Lysates from USP11-knockout clone-2 (Cl-2) at passage 12 were transfected with empty vector (EV) or HA-KEAP1 (HA) plasmids and fractionated by SDS-PAGE for immunoblotting analysis. Two biological repeats are shown (left panel). SETX band intensities were normalized to actin and presented as fold decrease compared to EV (right panel). Data are the mean of five biological repeats ± SD. p-Values calculated using two-tailed Student’s t-test. h MRC-5 cells treated with mock (DMSO) or α-amanitin (AMN) overnight followed by 10 min incubation with 25 µM CPT were subjected to proximity ligation assay using antibodies against endogenous KEAP1 and SETX. Representative images are shown, scale bar is equal to 10 µm (left panel). The signal intensity was measured using ImageJ (right panel). Data are the mean ± SD from three biological repeats. p-Values calculated using two-tailed Student’s t-test.
Fig. 6
Fig. 6. KEAP1 opposes USP11 to regulate SETX proteostasis.
a Empty vector (EV) and HA-KEAP1 (HA) overexpressing HEK-293 cells were transfected with Ub-His plasmid, lysed and subjected to nickel pulldown under denaturing conditions to purify ubiquitinated proteins. Samples were fractionated by SDS-PAGE and analysed by immunoblotting using SETX, HA and His antibodies. * Denotes a nonspecific band (left panel). The band intensities of Ubi-SETX were normalized to the bait His-Ub and presented as fold increase of SETX ubiquitination in HA-KEAP1 overexpressing cells compared to controls (right panel). Data are the average ± SD from three biological repeats. p-Values calculated using two-tailed Student’s t-test. b Control (Con Si), USP11-, KEAP1- and double USP11/KEAP1 (U + K Si)-depleted HEK-293 cells were transfected with plasmids encoding eGFP-SETX1–667 and Ub-His. Cell lysates were subjected to nickel pulldown under denaturing conditions to purify ubiquitinated proteins. Samples were fractionated by SDS-PAGE and analysed by immunoblotting using anti-GFP, USP11, His, KEAP1 and Actin antibodies (left panel). The band intensities of Ubi-eGFP-SETX1–667 were normalized to His-Ub and presented as fold increase of SETX ubiquitination as compared to controls. Data are the average ± SD from four biological repeats (right panel). p-Values calculated using two-tailed Student’s t-test. c Lysates from Control (Con siRNA), USP11-, KEAP1- and USP11/KEAP1-depleted cells (USP11/KEAP1 siRNA) were subjected to DNA/RNA immunoprecipitation (DRIP) protocol using S9.6 antibodies. Quantitative PCR was conducted using primers targeting nucleolar (28S and R7) and nuclear (ING3, SNRPN-neg, MYADM-neg) loci. SNRPN-neg and MYADM-neg loci are negative controls. Data represent the average ± range from two biological repeats. d HEK-293 cells expressing eGFP-SETX1–667 were transfected with empty vector-HA (EV) or HA-KEAP1 (HA). Cell lysates were subjected to GFP pulldown under denaturing conditions to purify eGFP-SETX1–667. Samples were fractionated by SDS-PAGE and analysed by immunoblotting using anti-GFP, K48 and HA antibodies (left panel). The intensity of K48 signal was normalized to pulled down eGFP-SETX1–667 signal and presented as fold increase compared to EV. Data are the average ± SD from four biological repeats (right panel). p-Values calculated using two-tailed Student’s t-test.
Fig. 7
Fig. 7. R-loops formed upon USP11 loss are processed to double-strand breaks.
a Control siRNA (Con) or SETX siRNA-treated HEK-293 cells were subjected to a USP11 ChIP followed by qPCR using primers targeting nucleolar (28S, R7) and nuclear (ING3, Actin, KEAP1, EGR1, SNRPN-neg, MYADM-neg) loci and presented as % input fold change compared to Con. Data represent the average ± SD from five biological repeats. ns; p > 0.05, two-tailed Student’s t-test. b Control siRNA (Con) or USP11 siRNA-treated HEK-293 cells were subjected to a SETX ChIP followed by qPCR using primers targeting nucleolar (28S, R7) and nuclear (ING3, Actin, KEAP1, EGR1) loci. Data represent the average ± SD from three biological repeats. ns; p > 0.05, two-tailed Student’s t-test. c Lysates from Control (Con siRNA) and USP11-depleted cells (USP11 siRNA) were subjected to a DNA/RNA immunoprecipitation (DRIP) protocol using S9.6 antibodies. Quantitative PCR was conducted using primers targeting nuclear KEAP1 locus. Pooled repeats (left panel) and raw % input values from a representative experiment are shown (right panel), and data represent the average ± SD from four biological repeats. p-Values calculated using two-tailed Student’s t-test. d HEK-293 cells were transfected with Control siRNA, USP11 siRNA and eGFP-RNase H1 (eGFP-RH1), and subsequently subjected to a γH2AX ChIP followed by qPCR using primers targeting nucleolar (28S, R7) and nuclear (ING3, Actin, KEAP1, SNRPN-neg, MYADM-neg) loci. Data represent the average ± SD from three biological repeats. ns; p > 0.05, two-tailed Student’s t-test. e HEK-293 cells were transfected with Control (Con) siRNA, USP11 siRNA and eGFP-RNase H1 (eGFP-RH1), and subsequently subjected to a XPF ChIP followed by qPCR using primers targeting nucleolar (28S, R7) and nuclear (ING3, KEAP1, SNRPN-neg) loci. Data represent the average ± SD from three biological repeats. ns; p > 0.05, two-tailed Student’s t-test. f Lysates from Control (Con) siRNA and USP11-depleted cells (USP11 siRNA) were subjected to a DNA/RNA immunoprecipitation (DRIP) protocol using S9.6 antibodies. Quantitative PCR was conducted using primers targeting nuclear common fragile sites FRA16 and FRA3B. In vitro, on-bead ec-RNase-H (ec-RH) treatment served as a signal validation control. Pooled repeats (left panel) and raw % input values from a representative experiment are shown (right panel), and data represent the average ± SD from three biological repeats. p-Values calculated using two-tailed Student’s t-test. g HEK-293 cells were transfected with Control (Con) siRNA, USP11 siRNA and eGFP-RNase H1 (RH1), and subsequently subjected to a XPF ChIP (left panel) and γH2A.X ChIP (right panel) followed by qPCR using primers targeting nuclear common fragile sites FRA16 and FRA3B. Data represent the average ± SD from three biological repeats. p-Values calculated using two-tailed Student’s t-test. h A model depicting R-loop regulation by SETX-USP11-KEAP1 axis. SETX protein level is regulated via ubiquitination by KEAP1 and deubiquitination by USP11. We suggest that the extent of SETX binding to USP11 and KEAP1 is controlled to favour more binding to USP11, thus increasing SETX levels, or more binding to KEAP1, thus reducing SETX level, at distinct genomic loci. The spatial regulation and control of SETX levels would ensure a fine balance to favour physiological R-loops that are required to promote transcription and, at the same time, suppress pathological R-loops that cause genomic instability.

Similar articles

Cited by

References

    1. Westover KD, Bushnell DA, Kornberg RD. Structural basis of transcription: separation of RNA from DNA by RNA polymerase II. Science. 2004;303:1014–1016. doi: 10.1126/science.1090839. - DOI - PubMed
    1. Roy D, Lieber MR. G clustering is important for the initiation of transcription-induced R-loops in vitro, whereas high G density without clustering is sufficient thereafter. Mol. Cell. Biol. 2009;29:3124–3133. doi: 10.1128/MCB.00139-09. - DOI - PMC - PubMed
    1. Marinello J, Chillemi G, Bueno S, Manzo SG, Capranico G. Antisense transcripts enhanced by camptothecin at divergent CpG-island promoters associated with bursts of topoisomerase I-DNA cleavage complex and R-loop formation. Nucleic Acids Res. 2013;41:10110–10123. doi: 10.1093/nar/gkt778. - DOI - PMC - PubMed
    1. Sanz LA, et al. Prevalent, dynamic, and conserved R-loop structures associate with specific epigenomic signatures in mammals. Mol. Cell. 2016;63:167–178. doi: 10.1016/j.molcel.2016.05.032. - DOI - PMC - PubMed
    1. Chein Y-H, Davidson N. RNA:DNA hybrids are more stable than DNA:DNA duplexes in concentrated perchlorate and trichloroacetate solutions. Nucleic Acids Res. 1978;5:1627–1637. doi: 10.1093/nar/5.5.1627. - DOI - PMC - PubMed

Publication types

MeSH terms