. 2022 Feb 7;114(2):290-301.
doi: 10.1093/jnci/djab183.

SRGN-Triggered Aggressive and Immunosuppressive Phenotype in a Subset of TTF-1-Negative Lung Adenocarcinomas

Affiliations

SRGN-Triggered Aggressive and Immunosuppressive Phenotype in a Subset of TTF-1-Negative Lung Adenocarcinomas

Ichidai Tanaka et al. J Natl Cancer Inst. .

Abstract

Background: Approximately 20% of lung adenocarcinoma (LUAD) is negative for the lineage-specific oncogene Thyroid transcription factor 1 (TTF-1) and exhibits worse clinical outcome with a low frequency of actionable genomic alterations. To identify molecular features associated with TTF-1-negative LUAD, we compared the transcriptomic and proteomic profiles of LUAD cell lines. SRGN , a chondroitin sulfate proteoglycan Serglycin, was identified as a markedly overexpressed gene in TTF-1-negative LUAD. We therefore investigated the roles and regulation of SRGN in TTF-1-negative LUAD.

Methods: Proteomic and metabolomic analyses of 41 LUAD cell lines were done using mass spectrometry. The function of SRGN was investigated in 3 TTF-1-negative and 4 TTF-1-positive LUAD cell lines and in a syngeneic mouse model (n = 5 to 8 mice per group). Expression of SRGN was evaluated in 94 and 105 surgically resected LUAD tumor specimens using immunohistochemistry. All statistical tests were 2-sided.

Results: SRGN was markedly overexpressed at mRNA and protein levels in TTF-1-negative LUAD cell lines (P < .001 for both mRNA and protein levels). Expression of SRGN in LUAD tumor tissue was associated with poor outcome (hazard ratio = 4.22, 95% confidence interval = 1.12 to 15.86, likelihood ratio test, P = .03), and with higher expression of Programmed cell death 1 ligand 1 (PD-L1) in tumor cells and higher infiltration of Programmed cell death protein 1-positive lymphocytes. SRGN regulated expression of PD-L1 as well as proinflammatory cytokines, including Interleukin-6, Interleukin-8, and C-X-C motif chemokine 1 in LUAD cell lines; increased migratory and invasive properties of LUAD cells and fibroblasts; and enhanced angiogenesis. SRGN was induced by DNA demethylation resulting from Nicotinamide N-methyltransferase-mediated impairment of methionine metabolism.

Conclusions: Our findings suggest that SRGN plays a pivotal role in tumor-stromal interaction and reprogramming into an aggressive and immunosuppressive tumor microenvironment in TTF-1-negative LUAD.


Figures

Figure 1.
Figure 1.
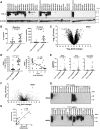
Expression of Serglycin (SRGN) in lung adenocarcinoma (LUAD) cell lines. A) Immunoblot analysis of Thyroid transcription factor 1 (TTF-1) in LUAD cell lines. H3255 cell lysates were used as a TTF-1–positive control. β-Actin served as a loading control. B) Cell migration and invasion in TTF-1–positive and –negative LUAD cell lines. Data are not available for 5 TTF-1–positive and 2 –negative LUAD cell lines (24). C) Volcano plot of genes differently expressed between TTF-1–positive and –negative LUAD cell lines. The x-axis is log2 fold-change in gene expression between TTF-1–negative and –positive LUAD cell lines, and the y-axis is log10P values adjusted for false discovery rate (FDR) based on the Benjamini and Hochberg method (Supplementary Table 2, available online). D) (Left) mRNA expression of SRGN in TTF-1–positive and –negative LUAD cell lines. (Right) Correlation between TTF-1 and SRGN mRNA expression in LUAD cell lines. E) SRGN protein expression levels in 3 cellular compartments, including conditioned media, whole-cell extracts (WCE), and cell surface proteins, from TTF-1–positive and –negative LUAD cell lines based on normalized tandem mass spectrometry (MS/MS) spectral counts. F) Volcano plot of secreted proteins (normalized MS/MS counts >1; n = 2809) differently expressed between TTF-1–positive and –negative LUAD cell lines. The x-axis is log2 fold-change in normalized MS/MS counts between TTF-1–negative and –positive LUAD cell lines, and the y-axis is log10P values calculated by the Mann-Whitney U test. G) Immunoblot analysis of SRGN expression in the conditioned media from TTF-1–positive and –negative LUAD cell lines. Conditioned media from H2030 cells were used as SRGN-positive controls. H) Correlation of SRGN protein expression quantified by immunoblotting and mass spectrometry. Signal intensity of SRGN in immunoblotting was measured by ImageJ. In B, D (left) and E, horizontal lines indicate mean values and SD, and P values were calculated using Mann-Whitney U test. In D (right) and H, correlation coefficients and P values were calculated using Spearman correlation test. All statistical tests were 2-sided.
Figure 2.
Figure 2.
Association of Serglycin (SRGN) expression and survival of lung adenocarcinoma (LUAD) patients. A) Representative images of immunohistochemical analysis of SRGN and Thyroid transcription factor 1 (TTF-1) in set 1. Arrows indicate tumor cells, arrowheads indicate alveolar type II epithelial cells with nuclear TTF-1 expression, and dashed arrows indicate SRGN expression in inflammatory cells of the tumor stroma. Scale bars represent 200 µm. B) SRGN and TTF-1 expression in set 1 (n = 94). P values were calculated by Fisher’s exact test. C) Kaplan-Meier survival curves for disease-free survival (left) and overall survival (right) in set 1, stratified according to protein expression of SRGN (SRGN-negative, n = 85; SRGN-positive, n = 9). P values were calculated using Gehan-Breslow-Wilcoxon test. D) SRGN and TTF-1 expression in set 2. P values were calculated by Fisher’s exact test. E) Kaplan-Meier survival curves for overall survival in set 2, stratified according to protein expression of SRGN (SRGN-negative, n = 56; SRGN-positive, n = 49). P values were calculated using Gehan-Breslow-Wilcoxon test. F) Programmed cell death 1 ligand 1 (PD-L1) expression in tumor cells and (G) CD4, CD8, CD68, and Programmed cell death protein 1 (PD-1) expression in tumor-infiltrating lymphocytes in the SRGN-positive (n = 6) and SRGN-negative (n = 60) LUAD in set 1. Horizontal lines indicate median values, and P values were calculated using Mann-Whitney U test. All statistical tests were 2-sided.
Figure 3.
Figure 3.
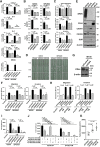
The regulatory role of Serglycin (SRGN) on expression of proinflammatory cytokines and cancer cell-stromal cell interaction via SRGN in Thyroid transcription factor 1 (TTF-1)–negative lung adenocarcinoma (LUAD). A) mRNA expression levels of C-X-C motif chemokine 1 (CXCL1), Interleukin-6 (IL-6), Interleukin-8 (IL-8), Programmed cell death 1 ligand 1 (PD-L1), and SRGN in H2030 and DFCI024 cell lines with SRGN knockdown. B) Levels of CXCL1, IL-6, and IL-8 in the conditioned media from H2030 and DFCI024 cell lines with SRGN knockdown. C) Cell proliferation, migration, invasion, and D) scratch assays in H2030 and DFCI024 cells with SRGN knockdown. E) Immunoblot analysis of SRGN, CD44, C-X-C chemokine receptor 1 (CXCR1), C-X-C chemokine receptor 2 (CXCR2), and IL-6 receptor (IL6R) expression in umbilical vein endothelial cells (HUVEC) and WI-38 cell lines. Conditioned media and cell lysates of H2030 and H3255 were used as positive and negative controls for SRGN and CD44, respectively. β-Actin served as a loading control. F) Migration and invasion assays in WI-38 cells, cultured in the conditioned media from H2030 and DFCI024 cells treated with negative control siRNA or SRGN siRNA. G) Immunoblot analysis of CD44 expression in WI-38 cell lines treated with negative control siRNA or CD44 siRNA. H) Migration and invasion assay in WI-38 cells with CD44 knockdown, cultured in the conditioned media from H2030 and DFCI024 cells. I) Tube formation assay of HUVEC cells cultured in the conditioned media from H2030 and DFCI024 cells treated with negative control siRNA or SRGN siRNA. J) Tube formation assay of HUVEC cells with CXCR1/2 inhibitor reparixin and/or IL6R inhibitor tocilizumab, cultured in the conditioned media from H2030 and DFCI024 cells. K) Tumor volumes in nude mice 4 weeks after subcutaneous injection with DFCI024 cells alone, with WI-38 cells or with HUVEC cells (n = 5 per group). Before coinjection, WI-38 and HUVEC cells were cultured for 96 hours with conditioned media from DFCI024 cells. Horizontal lines indicate mean and SD. P values were calculated using Mann-Whitney U test. In A-C, F, H-J, experiments have been performed with at least 3 independent biological repeats. Columns indicate the average of triplicate samples from a representative experiment, and bars indicate SD. P values were calculated using unpaired t test, compared with siControl (A-C, F, H, and I) and with control (black) (J). CM = conditioned media. All statistical tests were 2-sided.
Figure 4.
Figure 4.
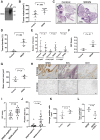
The contribution of Serglycin (Srgn) to tumor progression and reprogramming of tumor microenvironment in vivo. A) Immunoblot analysis of mouse Srgn using Myc-tag antibody in a control clone and a 393P-derived clone stably expressing mouse Srgn. B) Tumor volumes in mice 2 weeks after tail vein injection of Srgn-overexpressing 393P and control 393P cells (n = 8 per group). Tumor volumes were determined using the Seg3D tool. C) Representative hematoxylin and eosin (H&E) staining of lung sections from mice injected with Srgn-overexpressing 393P clone and control cells. Scale bars represent 4 mm. D) Tumor burden and E) number of tumors were assessed in 6 mice with SRGN-overexpressing tumors and 5 mice with control tumors. Tumor burden was defined as the percentage of area of tumors in H&E staining of lung sections and was quantified using Aperio ImageScope software. F) Tumor fibrosis was assessed by Masson’s trichrome staining in 6 mice with SRGN-overexpressing tumors and 3 mice with control tumors. (G) CD31-positive vessel area was measured using Aperio ImageScope software in 6 mice with SRGN-overexpressing tumors and 5 mice with control tumors. H) Representative images of SRGN and CD31 immunohistochemical staining and Elastica van Gieson (EVG) staining in SRGN-positive (#303066) and -negative (#501359) LUAD tumors. Scale bars represent 100 µm. I) Tumor fibrosis assessed by EVG staining and (J) CD31-positive vessel area in 17 SRGN-positive and 11 negative LUAD tumors. CD31-positive vessel area was measured using Hybrid Cell Count software. K) Number of PD-1–positive T lymphocytes in 6 mice with SRGN-overexpressing tumors and 5 mice with control tumors. L) Tumor volumes in mice 4 weeks after tail vein injection of Srgn-overexpressing 393P cells with or without intraperitoneal administration of anti–PD-1 antibodies (n = 5 per group). Tumor volumes were measured using Image J software. In B, D-G, I-L, horizontal lines indicate mean and SD. P values were calculated using Mann-Whitney U test. All statistical tests were 2-sided.
Figure 5.
Figure 5.
Regulation of Serglycin (SRGN) gene expression by DNA methylation. Immunoblot analyses of SRGN expression in the conditioned media from H2030 and DFCI024 cell lines A) after TTF-1 overexpression and B) treated with negative control siRNA or NRF2 siRNA. Experiments have been performed with at least 3 independent biological repeats. C) Hierarchical clustering analysis of the top 15% methylated CpG sites (n = 4137) of an Illumina Infinium HumanMethylation27 BeadChip microarray in 35 LUAD cell lines. P values were calculated using Fisher’s exact test. C1 and C2, clusters 1 and 2. D) Correlation of SRGN mRNA expression and the methylation levels of the 5 CpG sites in the SRGN promoter region in 41 LUAD cell lines. Correlation coefficients and P values were calculated using Spearman correlation test. To adjust P values for multiple comparisons, the Bonferroni correction was conducted. E) Quantitative reverse transcription polymerase chain reaction (RT-PCR) analysis of SRGN mRNA expression levels (left) and the methylation levels of the 5 CpG sites in the SRGN promoter region (right) after treatment with 5-Aza-dC at 2 µM in H3255 and H920 cell lines. F) Quantitative RT-PCR analysis of DNA methyltransferase 1 (DNMT1), DNMT3A, DNMT3B, and SRGN mRNA expression levels in H920 cells treated with negative control siRNA or siRNA against DNMT1, DNMT3A, or DNMT3B. In E and F, experiments have been performed with at least 3 independent biological repeats. mRNA expression was presented as the average and SD of triplicate samples from a representative experiment. All statistical tests were 2-sided.
Figure 6.
Figure 6.
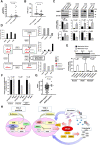
Induction of Serglycin (SRGN) expression by impaired methionine metabolism in Thyroid transcription factor 1 (TTF-1)–negative lung adenocarcinoma (LUAD). A) Nicotinamide N-methyltransferase (NNMT) protein expression levels in the whole-cell extracts (WCE) of TTF-1–positive and –negative LUAD cell lines based on normalized mass spectrometry (MS/MS) spectral counts. B) S-adenosyl methionine (SAM) levels in TTF-1–positive and –negative LUAD cell lines. SAM levels were normalized according to total protein concentration. C) SRGN mRNA expression levels and SAM levels after NNMT knockdown in H2030 cells or overexpression in H3255, H920, and HCC827 cells. D) Schema of the methionine cycle and methionine metabolic flux in LUAD cell lines 8 hours after exposure to 13C- and 15N-labeled methionine. E) SRGN mRNA expression levels in H3255, H920, and HCC827 cell lines cultured with 100 µM methionine (control), 10 µM methionine (low methionine), and 10 µM methionine for 8 days followed by 100 µM methionine for 8 days (recovery). F) Quantitative polymerase chain reaction (PCR) analysis of DNA methylation in the SRGN promoter region after treatment with 5-Aza-dC or low methionine. At the Chr10: 70847430 (hg19) in the promoter region of the SRGN gene where methylation was presented in H920 cells, the methylation-sensitive enzyme HpaII did not digest the DNA at this site, whereas methylation-insensitive enzyme MspI did digest DNA at this site. Quantitative PCR was conducted after DNA was digested by HpaII or MspI. Both 5-Aza-dC and low methionine (10 µM) treatment statistically significantly decreased DNA methylation at this site in H920 cells. All results were obtained from 3 repetitive experiments with 3 replicates. G) mRNA expression levels of NNMT in the SRGN-positive (N = 7) and SRGN–negative (N = 72) LUAD tumors in the tissue microarray for whom NNMT gene expression data are available. H) A schematic model showing that NNMT-induced perturbation of methionine metabolism induces SRGN-mediated reprogramming of tumor microenvironment in TTF-1–negative LUAD. Overexpression of NNMT consumes the SAM pool available for DNA methylation in TTF-1–negative LUAD, and impaired methionine metabolism results in induction of SRGN gene expression through loss of DNA methylation in the promoter region of the SRGN gene and transcriptional activation by Nuclear factor erythroid 2-related factor 2 (NRF2). Cancer cell-derived SRGN regulates expression of Programmed cell death 1 ligand 1 (PD-L1) and pro-inflammatory cytokines including Interleukin-6 (IL-6), Interleukin-8 (IL-8), and C-X-C motif chemokine 1 (CXCL1) in cancer cells, and reprograms tumor microenvironment via interaction with fibroblasts and endothelial cells, leading to enhanced aggressiveness and immune suppression in TTF-1–negative LUAD. In A, B, and G, horizontal lines indicate median values, and P values were calculated using Mann-Whitney U test. In C, E, and F, experiments have been performed with at least 3 independent biological repeats. Columns indicate the average of triplicate samples from a representative experiment, and bars indicate SD. P values were calculated using unpaired t test compared with control (C and E) and with undigested control (F). All statistical tests were 2-sided.

Similar articles

Cited by

References

    1. Maeda Y, Dave V, Whitsett JA.. Transcriptional control of lung morphogenesis. Physiol Rev. 2007;87(1):219–244. - PubMed
    1. Weir BA, Woo MS, Getz G, et al.Characterizing the cancer genome in lung adenocarcinoma. Nature. 2007;450(7171):893–898. - PMC - PubMed
    1. Kendall J, Liu Q, Bakleh A, et al.Oncogenic cooperation and coamplification of developmental transcription factor genes in lung cancer. Proc Natl Acad Sci USA. 2007;104(42):16663–16668. - PMC - PubMed
    1. Kwei KA, Kim YH, Girard L, et al.Genomic profiling identifies TITF1 as a lineage-specific oncogene amplified in lung cancer. Oncogene. 2008;27(25):3635–3640. - PMC - PubMed
    1. Tanaka H, Yanagisawa K, Shinjo K, et al.Lineage-specific dependency of lung adenocarcinomas on the lung development regulator TTF-1. Cancer Res. 2007;67(13):6007–6011. - PubMed

Publication types