

High-resolution analysis of the conformational transition of pro-apoptotic Bak at the lipid membrane
- PMID: 34523144
- PMCID: PMC8521305
- DOI: 10.15252/embj.2020107159
High-resolution analysis of the conformational transition of pro-apoptotic Bak at the lipid membrane
Abstract
Permeabilization of the outer mitochondrial membrane by pore-forming Bcl2 proteins is a crucial step for the induction of apoptosis. Despite a large set of data suggesting global conformational changes within pro-apoptotic Bak during pore formation, high-resolution structural details in a membrane environment remain sparse. Here, we used NMR and HDX-MS (Hydrogen deuterium exchange mass spectrometry) in lipid nanodiscs to gain important high-resolution structural insights into the conformational changes of Bak at the membrane that are dependent on a direct activation by BH3-only proteins. Furthermore, we determined the first high-resolution structure of the Bak transmembrane helix. Upon activation, α-helix 1 in the soluble domain of Bak dissociates from the protein and adopts an unfolded and dynamic potentially membrane-bound state. In line with this finding, comparative protein folding experiments with Bak and anti-apoptotic BclxL suggest that α-helix 1 in Bak is a metastable structural element contributing to its pro-apoptotic features. Consequently, mutagenesis experiments aimed at stabilizing α-helix 1 yielded Bak variants with delayed pore-forming activity. These insights will contribute to a better mechanistic understanding of Bak-mediated membrane permeabilization.
Keywords: HDX-MS; NMR; apoptosis; lipid nanodiscs; membrane.
© 2021 The Authors. Published under the terms of the CC BY NC ND 4.0 license.
Conflict of interest statement
The authors declare that they have no conflict of interest.
Figures
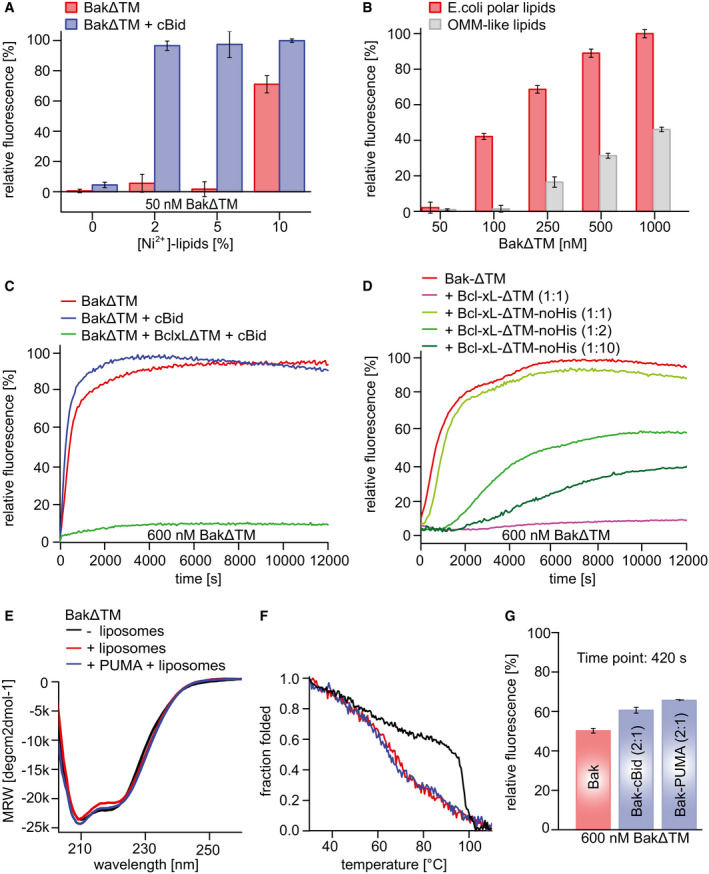
- A, B
The data are averaged for the time frame of 9,000–10,000 s and the standard deviation calculated from three measurements, respectively. (A) Influence of Ni2+‐caged lipids on BakΔTM activity. Liposomes were formed with OMM‐like lipids and subjected to 50 nM BakΔTM ± 20 nM cBid. (B) Influence of the indicated lipid compositions on BakΔTM autoactivity.
- C
Influence of cBid (300 nM) and BclxLΔTM (300 nM) on BakΔTM (600 nM), when autoactive.
- D
Comparison of the effect of BclxLΔTM on 600 nM BakΔTM pore formation with and without a His‐tag. The inhibitory activity of BclxL is highly dependent on its stable membrane association.
- E
Far‐UV‐CD spectra of BakΔTM ± E. coli polar liposomes and the Puma‐BH3 peptide as indicated.
- F
CD‐detected thermal melting experiments of BakΔTM (black) with liposomes (red) and Puma‐BH3 (blue).
- G
Percentile dye release is shown after 420 s for 600 nM BakΔTM ± 300 nM of an activator. The data are averaged for the time frame of 9,000–10,000 s and the standard deviation calculated from three technical replicates, respectively. Both cBid and Puma‐BH3 lead to enhanced liposome permeabilization.
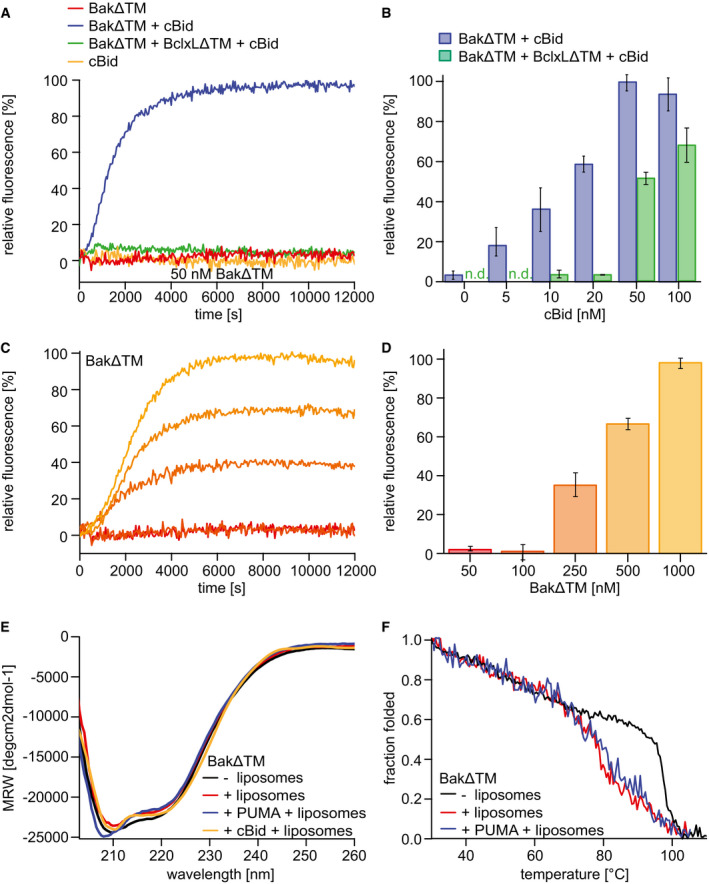
- A–D
Liposome permeabilization assays detecting the release of a fluorescence dye from liposomes. (A) Pore formation of 50 nM BakΔTM (red) is activated by 20 nM cBid (blue). 20 nM cBid alone (orange) shows no liposome permeabilization. Addition of 25 nM BclxLΔTM (green) inhibits pore formation. (B) Increasing amounts of cBid are titrated to 50 nM BakΔTM in the absence (blue) and presence (green) of 25 nM BclxLΔTM. (C,D) BakΔTM becomes autoactive at increasing concentrations. The concentrations are color‐coded as indicated in (D). (C) The averaged kinetics for increasing BakΔTM concentrations. Bar diagrams in (B) and (D) represent data from the kinetic experiments averaged between 9,000 and 10,000 s. The standard deviation was calculated from three measurements.
- E
Far‐UV‐CD spectra of BakΔTM ± liposomes and the activators cBid or Puma‐BH3 peptide as indicated.
- F
CD‐detected thermal melting experiments of BakΔTM (black) with liposomes (red) and Puma‐BH3 (blue).
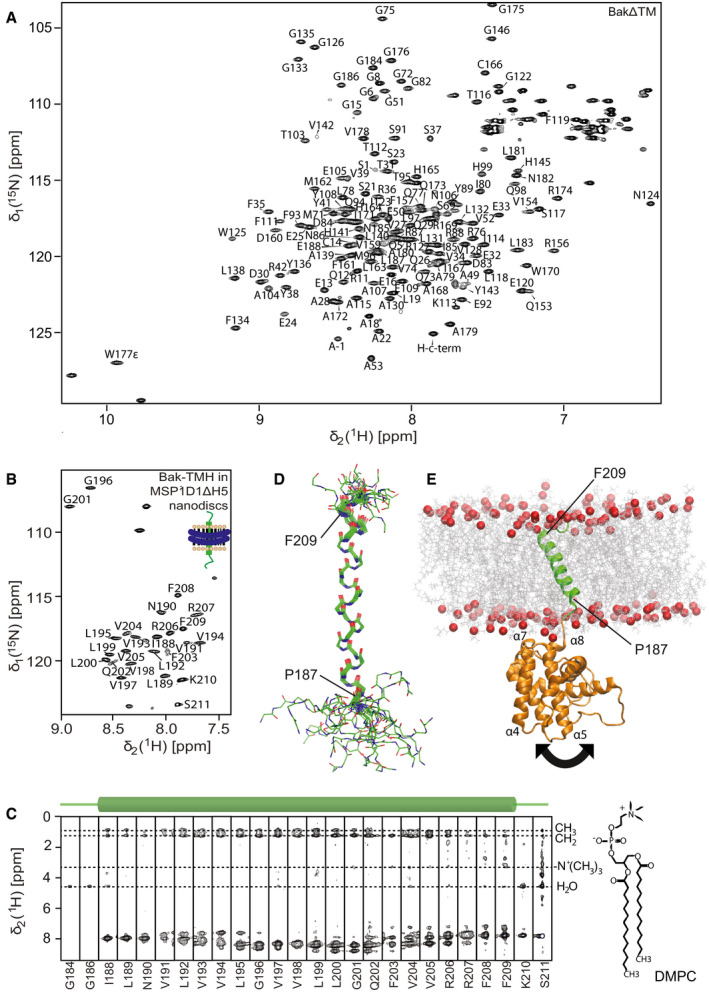
NMR backbone resonance assignments labeled in a 2D‐[15N,1H]‐HSQC spectrum of BakΔTM.
NMR backbone resonance assignment of the Bak‐TMH in MSP1D1ΔH5 nanodiscs.
3D‐15N‐edited‐[1H,1H]‐NOESY spectrum containing all sequential amide connectivities as well as the contacts to lipid tails and water exchange. The location of the transmembrane helix is indicated above.
Overlay of the 20 lowest energy NMR structures of the Bak‐TMH in MSP1D1ΔH5 nanodiscs. A transmembrane helix is formed between Pro187 and Phe209 as indicated in the picture.
Structural model of full‐length Bak obtained by an MD simulation and by utilizing our structural information. The arrow indicates the flexibility of the 4‐amino acid linker between the soluble domain and the TMH.
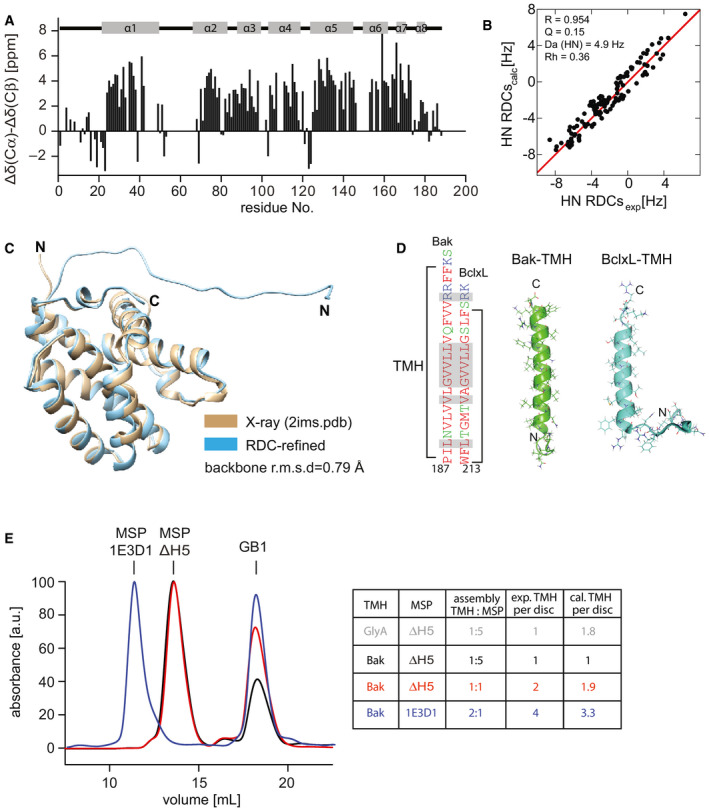
NMR secondary chemical shifts of BakΔTM are in agreement with the α‐helical secondary structure content as present in a crystal structure (2IMS.pdb (Moldoveanu et al, 2006)) indicated at the top.
Correlation between the experimental and back‐calculated RDCs for the NMR‐refined BakΔTM structure.
Comparison of the refined BakΔTM structure containing the full N‐terminus with the published crystal structure (2IMS.pdb (Moldoveanu et al, 2006)), which was used as an initial structure for the refinement.
Comparison of the sequence and structure of the Bak‐ and BclxL‐TMH in nanodiscs. The high similarity is shown by color coding the amino acids according to their polarity (red: apolar, green: polar, blue: basic). Identical amino acids are highlighted in the sequence in gray.
SEC profiles of Bak‐TMH in nanodiscs after cleaving off the GB1 tag color‐coded according to the table on the right. The area under the curve was used to calculate the ratio of TMH/nanodisc. The table shows the applied assembly conditions as well as the expected and calculated amount of TMH/nanodisc. For a dimeric protein like the glycophorin A (GlyA) TMH, the expected and calculated ratios vary, which is not the case for the Bak‐TMH.
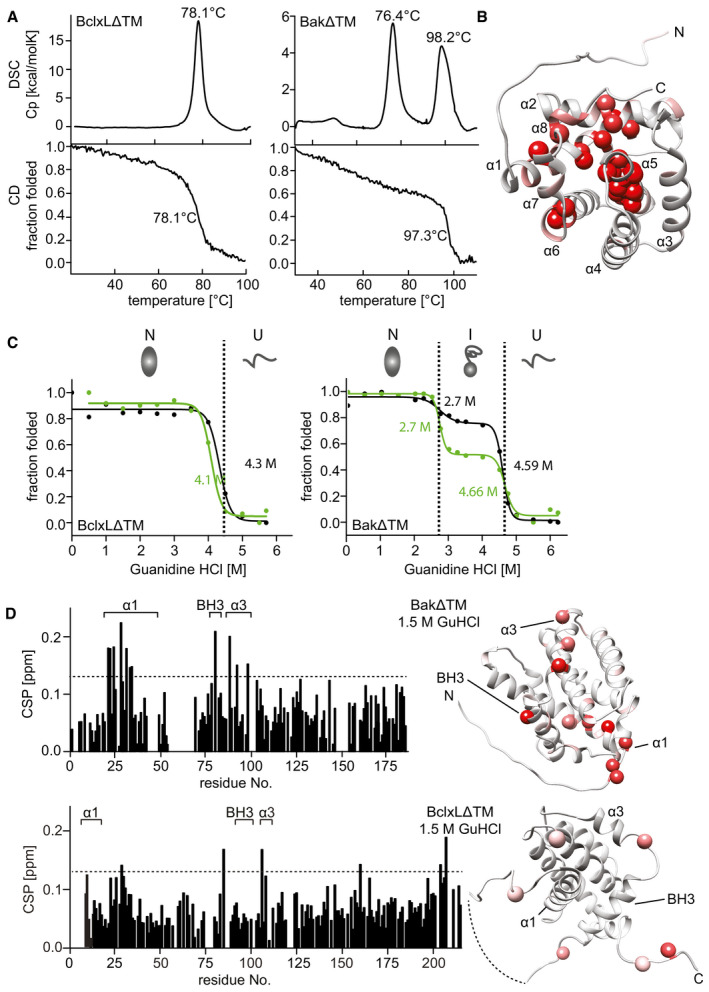
Comparison of the thermal stability of BclxLΔTM (left) and BakΔTM (right) measured by DSC (top) and Far‐UV‐CD at 222 nm (bottom).
RDC‐refined structure of BakΔTM. The NMR peak height ratio of the deuterated vs. protonated sample was used to identify solvent‐protected amino acid residues (red spheres).
Comparison of the GuHCl‐induced chemical unfolding of the secondary structure (black), monitored by far‐UV‐CD at 222 nm, and tertiary structure (green), monitored by Trp‐fluorescence, of BclxLΔTM (left) and BakΔTM (right). The native (N), intermediate (I), and unfolded (U) states are indicated at the top.
Chemical shift perturbation (CSP) plot derived from 2D‐[15N, 1H] HSQC spectra of BakΔTM (top) and BclxLΔTM (bottom) ± 1.5 M GuHCl. The most significant chemical shift perturbations (> mean value plus standard deviation, dotted line) are highlighted in red on the structures on the right.
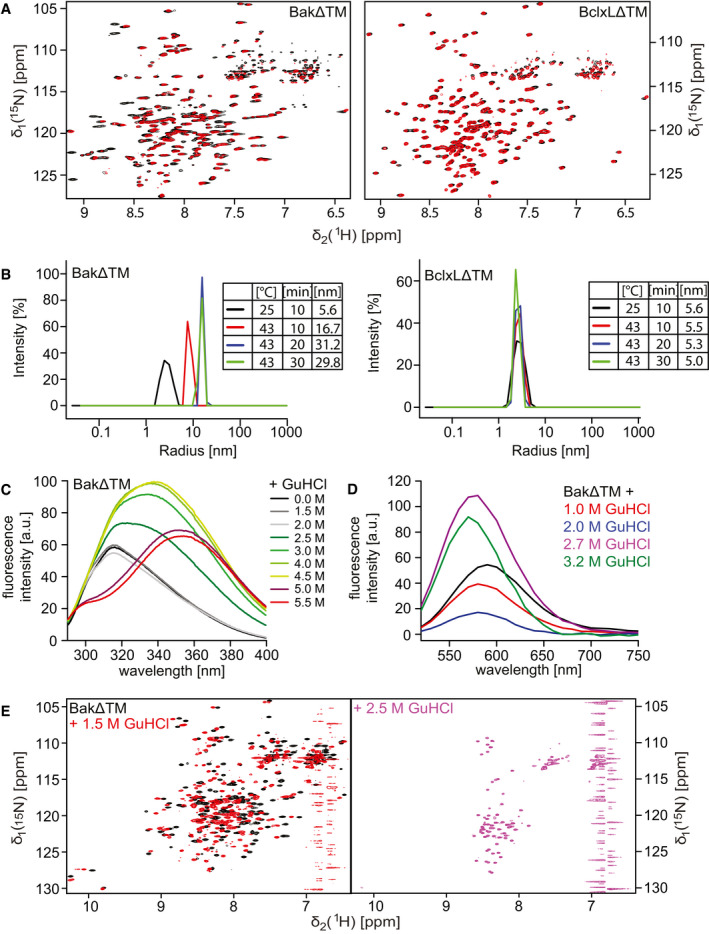
2D‐[15N, 1H]‐HSQC spectra of BakΔTM (left) and BclxLΔTM (right) using a protonated (black) or deuterated (red) sample.
DLS experiments of BakΔTM (left) and BclxLΔTM (right) upon incubation at different temperatures and varying times. The tables on the right state the hydrodynamic diameter in [nm], which is calculated from the measured hydrodynamic radii.
Tryptophan fluorescence emission spectra of BakΔTM at different GuHCl concentrations upon excitation at 280 nm.
Fluorescence emission spectra of SYPRO Orange binding to BakΔTM at different GuHCl concentrations.
2D‐[15N, 1H]‐HSQC spectra of BakΔTM in the absence (black) and presence of 1.5 M GuHCl (red) and 2.5 M GuHCl (magenta).
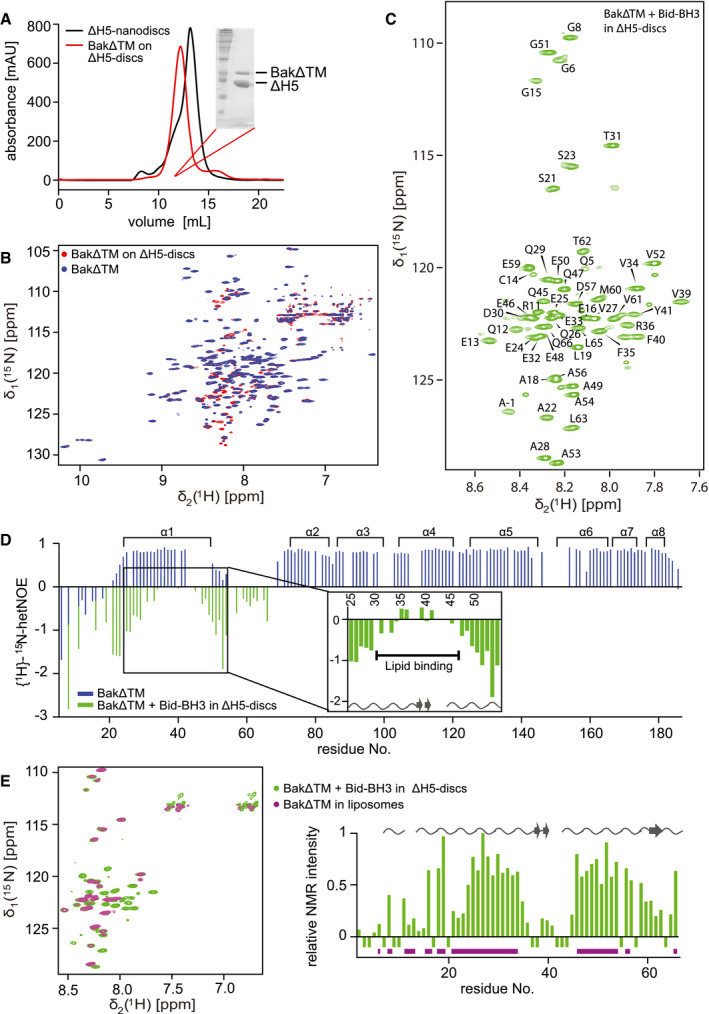
Size exclusion chromatogram of nanodiscs (black) and BakΔTM bound to nanodiscs (red). Inset: SDS–PAGE confirms the presence of Bak‐loaded nanodiscs.
Overlay of 2D‐[15N, 1H]‐TROSY spectra of BakΔTM with (red) and without (blue) nanodiscs.
2D‐[15N, 1H]‐TROSY spectrum of BakΔTM in nanodiscs after Bid‐BH3 activation with the assigned resonances indicated.
{1H}–15N‐heteronuclear NOE of BakΔTM in the inactive state (blue) and the active state in nanodiscs after Bid‐BH3 activation (green). α‐Helices in Bak are shown at the top. Residues 25–54 of the activated state are magnified. Chemical shift‐derived secondary structure elements are indicated at the bottom.
Left: Overlay of 2D‐[15N, 1H]‐TROSY spectra of BakΔTM in [Ni2+]‐caged liposomes (magenta) and Bid‐BH3‐activated BakΔTM in nanodiscs (green). Right: Plot of the relative NMR intensity of Bid‐BH3‐activated BakΔTM in nanodiscs. Peaks that are also visible in liposomes are indicated by horizontal lines in magenta at the bottom, while the chemical shift‐derived secondary structure elements are indicated at the top.
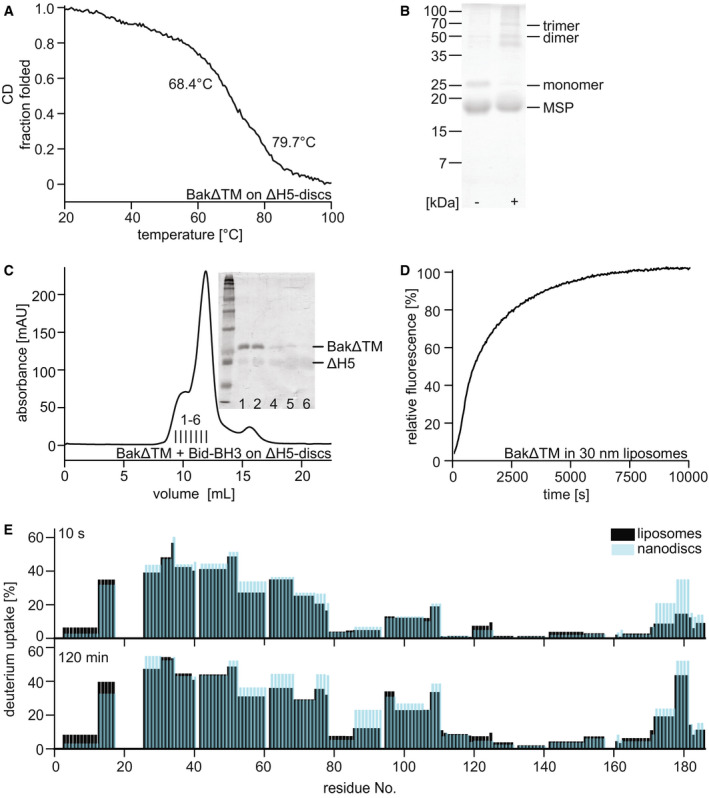
Far‐UV‐CD thermal melting data of BakΔTM bound to lipid nanodiscs. The melting point at 68.4°C corresponds to BakΔTM, while the later unfolding event at 79.7°C shows the melting of the MSP forming the nanodisc.
SDS–PAGE of Cu/phen crosslinking of BakΔTM bound to ΔH5 nanodiscs ± Bid‐BH3 peptide.
Size exclusion chromatogram of BakΔTM bound to nanodiscs after activation by Bid‐BH3. Inset: SDS–PAGE shows that activated BakΔTM elutes before the main nanodisc peak. The MSP band is very faint due to increased destaining which is sometimes seen for MSP.
Pore‐forming assay with 600 nM BakΔTM in liposomes of 30 nm size.
Comparison of the deuterium uptake of the active Bak species in liposomes (black) and ΔH5 nanodiscs (blue). The HDX‐MS detected deuterium uptake is compared after 10 s at the top and 2 h at the bottom.
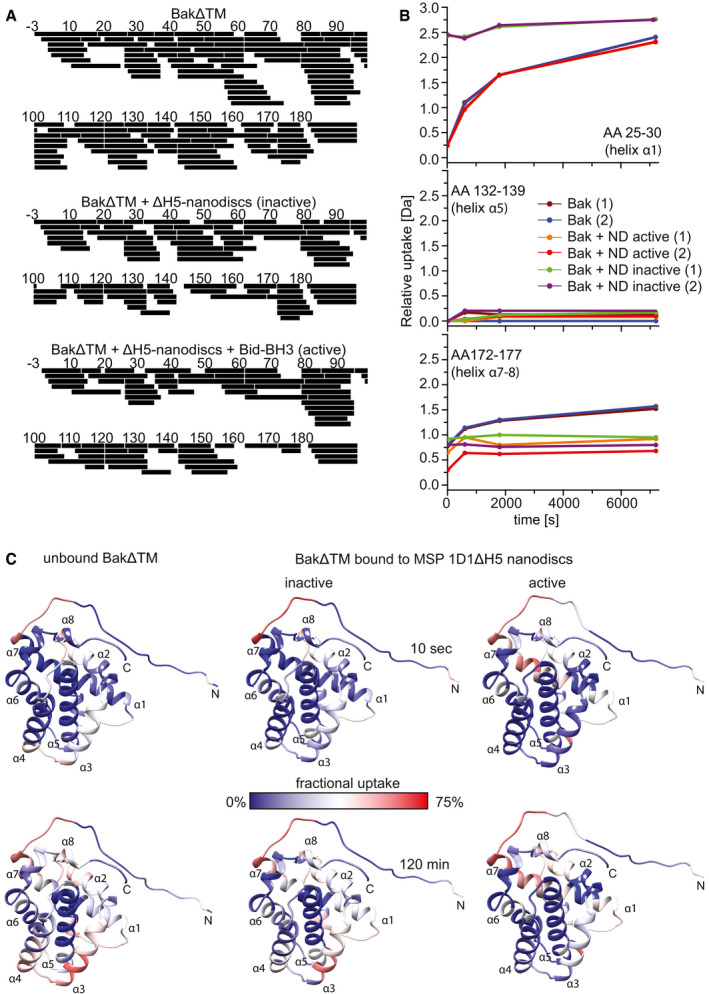
HDX peptide coverage maps of the different BakΔTM samples. BakΔTM: Total coverage was 100% with 126 peptides and a redundancy of 6.96. BakΔTM + ∆H5 nanodiscs (inactive): Total coverage was 99% with 83 peptides and a redundancy of 4.47. BakΔTM + ∆H5 nanodiscs + Bid‐BH3 (active): Total coverage was 97% with 76 peptides and a redundancy of 4.25.
HDX graphs of three peptides, located in different helices as indicated, displaying the relative deuterium uptake during the reaction time. Two biological replicates were measured for each state. (ND = ∆H5 nanodiscs).
HDX‐MS experiments of unbound BakΔTM and BakΔTM bound to Ni‐nanodiscs in the inactive state and after activation with the Bid‐derived BH3 peptide. HDX was mapped to the BakΔTM structure and colored according to the measured exchange rates after the incubation times indicated. Blue colors correspond to a lower (less accessible) and red colors to a higher (more accessible) fractional uptake of deuterium.
- A
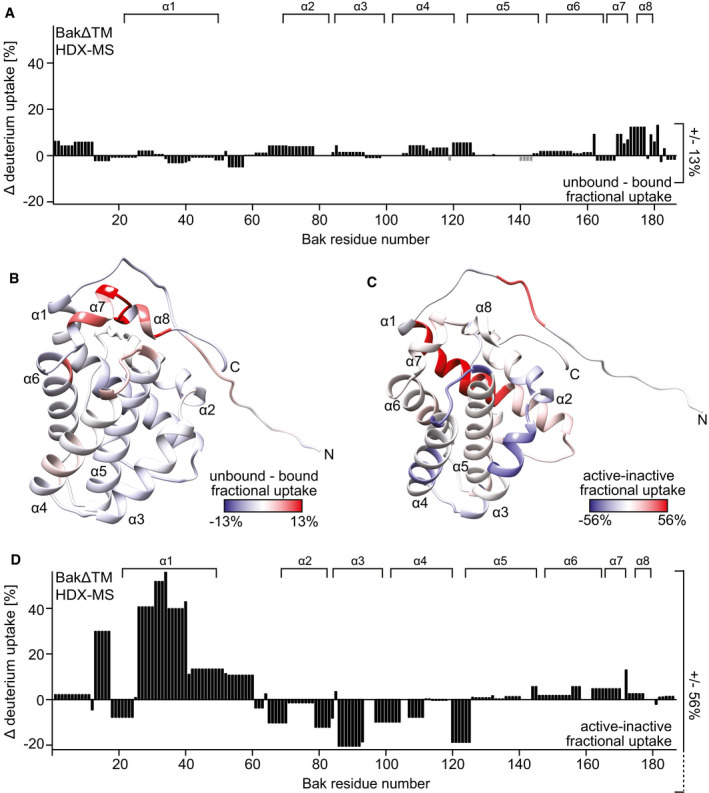
The HDX values after 120 min of BakΔTM bound to ΔH5 nanodiscs are subtracted from the values with soluble BakΔTM and plotted against the amino acid sequence. α‐Helical secondary structure is indicated at the top.
- B
The HDX data displayed in (A) are color‐coded on the BakΔTM structure. Higher fractional uptake in the unbound state is colored in red, while less uptake is colored in blue.
- C, D
The HDX of inactive BakΔTM subtracted from the HDX of Bid‐BH3‐activated BakΔTM, both bound to nanodiscs, is color‐coded on the BakΔTM structure in (C) and plotted against the amino acid sequence in (D). In this case, the HDX rates after 10 s were used for figure preparation. The position of the α‐helical secondary structure elements (α1–α8) is indicated at the top.
- A
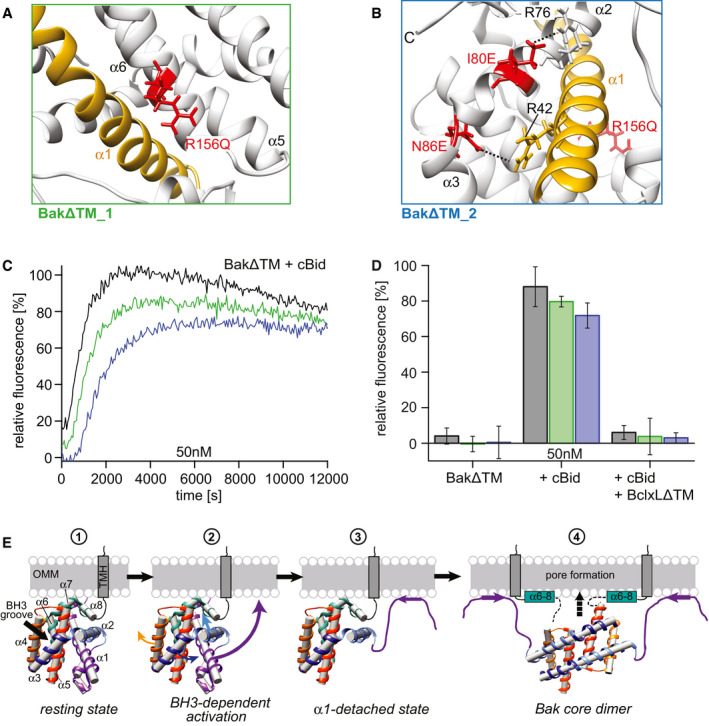
BakΔTM_1 (green frame): R156Q stabilizes the interaction between the latch domain (α6–α8) and helix 1 (gold).
- B
BakΔTM_2 (blue frame): Combines R156Q and I80E, N86E, which target the interaction between the BH3 region and helix 1.
- C, D
Liposome permeabilization assay comparing the variants in (A, green) and (B, blue) to wild‐type BakΔTM (black). (C) Comparison of 50 nM of wild‐type BakΔTM (black) to the two variants after activation by 25 nM cBid. (D) Bar diagram comparing the behavior of the BakΔTM variants alone and in the presence of 25 nM cBid and 25 nM BclxLΔTM. The data derived from the liposome permeabilization kinetics shown in panel (C) are averaged for the time interval of 9,000–10,000 s, and the standard deviations were derived from three technical replicates.
- E
Model of the structural changes of Bak during pore formation. Stage 1 depicts the resting state on the OMM surface. The linker between the TMH and soluble domain is most likely flexible. Stage 2 shows the effect induced by the binding of a BH3‐only protein to the Bak BH3 binding groove, where α3 and α4 are pushed apart, most likely weakening the interaction of α2 and α3 with α1, facilitating its detachment. Thereby, α1 unfolds and most likely binds to the membrane (stage 3). This enables the detachment of the core and latch domains, homodimerization (stage 4) and ultimately pore formation. Possibly, the unfolding of α1 and the detachment of the latch domain (α6–α8) might happen simultaneously. Since no structural information is available for the final Bak pore, only the dimeric form is depicted here. A membrane surface‐bound position of the latch domain is suggested by a recent crystal structure (Birkinshaw et al, 2021).
Comment in
-
A killer metamorphosis: catching BAK in action at the membrane.EMBO J. 2021 Oct 18;40(20):e109529. doi: 10.15252/embj.2021109529. Epub 2021 Sep 20. EMBO J. 2021. PMID: 34542920 Free PMC article.
Similar articles
-
Dynamic reconfiguration of pro-apoptotic BAK on membranes.EMBO J. 2021 Oct 18;40(20):e107237. doi: 10.15252/embj.2020107237. Epub 2021 Sep 15. EMBO J. 2021. PMID: 34523147 Free PMC article.
-
Anti-apoptotic Bcl-XL protein in complex with BH3 peptides of pro-apoptotic Bak, Bad, and Bim proteins: comparative molecular dynamics simulations.Proteins. 2008 Nov 1;73(2):492-514. doi: 10.1002/prot.22075. Proteins. 2008. PMID: 18452209
-
Crystal structure of Bak bound to the BH3 domain of Bnip5, a noncanonical BH3 domain-containing protein.Proteins. 2024 Jan;92(1):44-51. doi: 10.1002/prot.26568. Epub 2023 Aug 8. Proteins. 2024. PMID: 37553948
-
Discoveries and controversies in BCL-2 protein-mediated apoptosis.FEBS J. 2016 Jul;283(14):2690-700. doi: 10.1111/febs.13527. Epub 2015 Oct 27. FEBS J. 2016. PMID: 26411300 Review.
-
Bax, Bak and beyond - mitochondrial performance in apoptosis.FEBS J. 2018 Feb;285(3):416-431. doi: 10.1111/febs.14186. Epub 2017 Sep 4. FEBS J. 2018. PMID: 28755482 Review.
Cited by
-
Apoptotic mitochondrial poration by a growing list of pore-forming BCL-2 family proteins.Bioessays. 2023 Mar;45(3):e2200221. doi: 10.1002/bies.202200221. Epub 2023 Jan 17. Bioessays. 2023. PMID: 36650950 Free PMC article.
-
Structural basis of BAK activation in mitochondrial apoptosis initiation.Nat Commun. 2022 Jan 11;13(1):250. doi: 10.1038/s41467-021-27851-y. Nat Commun. 2022. PMID: 35017502 Free PMC article.
-
Parkin-mediated ubiquitination inhibits BAK apoptotic activity by blocking its canonical hydrophobic groove.Commun Biol. 2023 Dec 12;6(1):1260. doi: 10.1038/s42003-023-05650-z. Commun Biol. 2023. PMID: 38087033 Free PMC article.
-
Pore-forming proteins as drivers of membrane permeabilization in cell death pathways.Nat Rev Mol Cell Biol. 2023 May;24(5):312-333. doi: 10.1038/s41580-022-00564-w. Epub 2022 Dec 21. Nat Rev Mol Cell Biol. 2023. PMID: 36543934 Review.
-
A killer metamorphosis: catching BAK in action at the membrane.EMBO J. 2021 Oct 18;40(20):e109529. doi: 10.15252/embj.2021109529. Epub 2021 Sep 20. EMBO J. 2021. PMID: 34542920 Free PMC article.
References
-
- Alsop AE, Fennell SC, Bartolo RC, Tan IK, Dewson G, Kluck RM (2015) Dissociation of Bak α1 helix from the core and latch domains is required for apoptosis. Nat Commun 6: 6841 - PubMed
-
- Birkinshaw RW, Iyer S, Lio D, Luo CS, Brouwer JM, Miller MS, Robin AY, Uren RT, Dewson G, Kluck RM et al (2021) Structure of detergent‐activated BAK dimers derived from the inert monomer. Mol Cell 81: 2123–2134.e5 - PubMed
Publication types
MeSH terms
Substances
LinkOut - more resources
Full Text Sources
Research Materials
