. 2021 Oct 26;41(11):e0039921.
doi: 10.1128/MCB.00399-21. Epub 2021 Sep 13.

Viral Manipulation of a Mechanoresponsive Signaling Axis Disassembles Processing Bodies

Affiliations

Viral Manipulation of a Mechanoresponsive Signaling Axis Disassembles Processing Bodies

Elizabeth L Castle et al. Mol Cell Biol. .

Abstract

Processing bodies (PBs) are ribonucleoprotein granules important for cytokine mRNA decay that are targeted for disassembly by many viruses. Kaposi's sarcoma-associated herpesvirus is the etiological agent of the inflammatory endothelial cancer, Kaposi's sarcoma, and a PB-regulating virus. The virus encodes kaposin B (KapB), which induces actin stress fibers (SFs) and cell spindling as well as PB disassembly. We now show that KapB-mediated PB disassembly requires actin rearrangements, RhoA effectors, and the mechanoresponsive transcription activator, YAP. Moreover, ectopic expression of active YAP or exposure of ECs to mechanical forces caused PB disassembly in the absence of KapB. We propose that the viral protein KapB activates a mechanoresponsive signaling axis and links changes in cell shape and cytoskeletal structures to enhanced inflammatory molecule expression using PB disassembly. Our work implies that cytoskeletal changes in other pathologies may similarly impact the inflammatory environment.

Keywords: Kaposi's sarcoma-associated herpesvirus; RNA regulation; YAP; actin dynamics; herpesviruses; mechanotransduction; processing bodies; tumorigenesis; virus-host interactions.


Figures

FIG 1
FIG 1
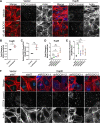
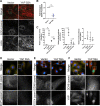
The RhoA-effector mDia1 is required for KapB-mediated PB disassembly. KapB- and vector-expressing HUVECs were transduced with shRNAs targeting mDia1 (shDIA1-1 and shDIA1-2) or with a nontargeting (shNT) control and selected. In parallel, cells were fixed for immunofluorescence or lysed for immunoblotting. (A) One representative immunoblot of three independent experiments stained with mDia1-specific antibody is shown. (B and C) Fixed cells were stained for CellProfiler analysis as detailed in Materials and Methods. (B) The number of EDC4 puncta per cell was quantified and normalized to the vector nontargeting (NT) control within each replicate. (C) CellProfiler data were used to calculate the ratio of EDC4 puncta counts in KapB-expressing cells versus the vector control for each treatment condition. (D) Representative images of cells stained for PB resident proteins EDC4 (green), KapB (blue), and F-actin (red, phalloidin). Boxes indicate area shown in the EDC4 (zoom) panel. Scale bar represents 20 μm. Statistics were determined using ratio-paired t tests between control and experimental groups; error bars represent standard deviation. n = 3 independent biological replicates. *, P < 0.05; **, P < 0.01.
FIG 2
FIG 2
The RhoA effector ROCK is required for KapB-mediated PB disassembly. (A to C) KapB- and vector-expressing HUVECs were treated with 10 μM Y-27632 or water control for 4 h and fixed for immunofluorescence. (A) Representative images of cells stained for PB resident proteins EDC4 (green), KapB (blue), and F-actin (red, phalloidin). Boxes indicate area shown in the EDC4 (zoom) panel. Scale bar represents 20 μm. (B and C) Fixed cells were stained for CellProfiler analysis as detailed in Materials and Methods. (B) The number of EDC4 puncta per cell was quantified and normalized to the vector NT control within each replicate. (C) CellProfiler data were used to calculate the ratio of EDC4 puncta counts in KapB-expressing cells versus the vector control for each treatment condition. (D to F) KapB- and vector-expressing HUVECs were transduced with shRNAs targeting ROCK1 and ROCK2 (shROCK1-1, shROCK1-2, shROCK2-1, and shROCK2-2) or with a nontargeting (shNT) control and selected. Cells were fixed for immunofluorescence. (D and E) Fixed cells were stained for CellProfiler analysis as detailed in Materials and Methods. (D) The number of EDC4 puncta per cell was quantified and normalized to the vector NT control within each replicate. (E) CellProfiler data were used to calculate the ratio of EDC4 puncta counts in KapB-expressing cells versus the vector control for each treatment condition. (F) Representative images of cells stained for PB resident proteins EDC4 (green), KapB (blue), and F-actin (red, phalloidin). Boxes indicate images shown in EDC4 (zoom) panel. Scale bar represents 20 μm. Statistics were determined using ratio-paired t tests between control and experimental groups; error bars represent standard deviation from n = 3 independent biological replicates except shROCK1-2 (n = 2). *, P < 0.05; **, P < 0.01.
FIG 3
FIG 3
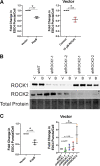
The RhoA-effector ROCK is required for KapB-mediated PB disassembly, knockdown confirmation, and vector data. (A) KapB- and vector-expressing HUVECs were treated with 10 μM Y-27632 or water control for 4 h and fixed for immunofluorescence. Fixed cells were stained for CellProfiler analysis as detailed in Materials and Methods. The number of EDC4 puncta per cell was quantified and normalized to the vector control. Vector control data are shown. (B and C) KapB- and vector-expressing HUVECs were transduced with shRNAs targeting ROCK1 and ROCK2 (shROCK1-1, shROCK1-2, shROCK2-1, and shROCK2-2) or with a nontargeting (shNT) control and selected. In parallel, cells were lysed for immunoblotting or fixed for immunofluorescence. (B) One representative immunoblot of three independent experiments stained using ROCK1- and ROCK2-specific antibodies. (C) Fixed cells were stained for CellProfiler analysis as detailed in Materials and Methods. The number of EDC4 puncta per cell was quantified and normalized to the vector NT control within each replicate. Vector control data are shown. Statistics were determined using a ratio-paired t test between control and experimental groups; error bars represent standard deviation. n = 3 independent biological replicates. *, P < 0.05.
FIG 4
FIG 4
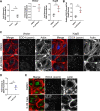
Cofilin knockdown augments KapB-mediated PB disassembly. KapB- and vector-expressing HUVECs were transduced with shRNAs targeting cofilin (shCFN-1 and shCFN-2) or with a nontargeting (shNT) control and selected. In parallel, cells were fixed for immunofluorescence or lysed for immunoblotting. (A) One representative immunoblot of three independent experiments stained using a cofilin-specific antibody. (B and C) Fixed cells were stained for CellProfiler analysis as detailed in Materials and Methods. (B) The number of EDC4 puncta per cell was quantified and normalized to the vector NT control within each replicate. (C) CellProfiler data were used to calculate the ratio of EDC4 puncta counts in KapB-expressing cells versus the vector control for each treatment condition. (D) Representative images of cells stained for PB resident proteins EDC4 (green), KapB (blue), and F-actin (red, phalloidin). Boxes indicate the area of the field of view that is shown in EDC4 (zoom) panel. Scale bar represents 20 μm. Statistics were determined using a ratio-paired t test between control and experimental groups; error bars represent standard deviation. n = 3 independent biological replicates. *, P < 0.05.
FIG 5
FIG 5
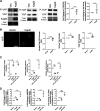
G-actin concentration does not control PB disassembly. (A to C) HUVECs were treated with 1 μM Jasp (polymerizes actin and decreases monomeric G-actin), 1 μg/μl CytD (actin depolymerization to increase monomeric G-actin), or a DMSO control for 30 min. (A and B) Fixed cells were stained for CellProfiler analysis as detailed in Materials and Methods. The number of EDC4 puncta per cell was quantified and normalized to the DMSO control. (C) Representative images of cells stained for PB resident proteins EDC4 and F-actin (phalloidin). Actin is not seen in Jasp panel due to Jasp-mediated interference with phalloidin staining (86). Scale bar represents 20 μm. Statistics were determined using a ratio-paired t test between control and experimental groups; error bars represent standard deviation. n = 3 independent biological replicates. (D) Representative immunoblot of filamentous and globular actin fractions separated by ultracentrifugation as detailed in Materials and Methods from HUVECs treated with DMSO, 0.5 or 1.0 μM Jasp. *, P < 0.05; **, P < 0.01.
FIG 6
FIG 6
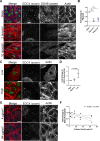
α-Actinin-1 overexpression mediated SF formation and PB disassembly. HUVECs were fixed and stained with antibodies for α-actinin-1 (A) and α-actinin-4 (B). (C and D) HUVECs transduced with recombinant lentiviruses expressing GFP-tagged α-actinin-1 (ACTN-GFP) or a GFP control were selected and fixed for immunofluorescence. (C) Fixed cells were stained for CellProfiler analysis as detailed in Materials and Methods. The number of EDC4 puncta per cell was quantified and normalized to the vector GFP control. (D) Representative images of cells stained for PB resident proteins EDC4 (false-colored green), ACTN-GFP (false-colored blue), and F-actin (red, phalloidin). Boxes indicate images shown in EDC4 (zoom) panel. Scale bar represents 20 μm. Statistics were determined using a ratio-paired t test between control and experimental groups; error bars represent standard deviation. n = 3 independent biological replicates. *, P < 0.05.
FIG 7
FIG 7
Actomyosin contractility controls PB disassembly. (A to C) KapB- and vector-expressing HUVECs were treated with 10 μm blebbistatin to inhibit actomyosin contractility or DMSO for 30 min and fixed for immunofluorescence. (A and B) Fixed cells were stained for CellProfiler analysis as detailed in Materials and Methods. (A) The number of EDC4 puncta per cell was quantified and normalized to the vector NT control within each replicate. (B) CellProfiler data were used to calculate the ratio of EDC4 puncta counts in KapB-expressing cells versus the vector control for each treatment condition. (C) Representative images of cells stained for PB resident proteins EDC4 (green), KapB (blue), and F-actin (red, phalloidin). Boxes indicate area shown in the EDC4 (zoom) panel. Scale bar represents 20 μm. (D and E) Untransduced HUVECs were treated with 5 nM calyculin A (CalA) to stimulate actomyosin contraction or DMSO for 20 min and fixed for immunofluorescence. (D) Fixed cells were stained for CellProfiler analysis as detailed in Materials and Methods. EDC4 puncta per cell were quantified and normalized to the DMSO control within each replicate. (E) Representative images of cells treated with 5 nM CalA and stained for PB resident proteins EDC4 (green) and F-actin (red, phalloidin). Boxes indicate area shown in the EDC4 (zoom) panel. Scale bar represents 20 μm. Statistics were determined using ratio-paired t tests between control and experimental groups; error bars represent standard deviation. n = 3 (A and B) and n = 5 (D) independent biological replicates. *, P < 0.05.
FIG 8
FIG 8
YAP is required for KapB-mediated PB disassembly. KapB- and vector-expressing HUVECs were transduced with shRNAs targeting YAP (shYAP-1 and shYAP-2) or with a nontargeting (shNT) control and selected. In parallel, cells were fixed for immunofluorescence or lysed for immunoblotting. (A) One representative immunoblot of three independent experiments stained with YAP-specific antibody is shown. (B to D) Fixed cells were stained for CellProfiler analysis as detailed in Materials and Methods. (B) The number of EDC4 puncta per cell was quantified and normalized to the vector NT control within each replicate. (C) CellProfiler data were used to calculate the ratio of EDC4 puncta count in KapB-expressing cells to the vector control for each treatment condition. (D) Representative images of cells stained for PB resident proteins EDC4 (green), KapB (blue), and F-actin (red, phalloidin). Boxes indicate area shown in the EDC4 (zoom) panel. Scale bar represents 20 μm. Statistics were determined using ratio-paired t tests between control and experimental groups; error bars represent standard deviation. n = 3 independent biological replicates. *, P < 0.05; **, P < 0.01; ***, P < 0.001.
FIG 9
FIG 9
KapB does not activate canonical functions of YAP. (A and B) KapB- and vector-expressing HUVECs were lysed for immunoblotting or fixed for immunofluorescence. (A) Representative immunoblots and quantification of immunoblotting for P(S127)-YAP-, YAP-, or KapB-specific antibody are shown. Several immunoblots are shown to illustrate variation in KapB-mediated changes in P-YAP and YAP. Protein levels under each condition were normalized to total protein. All treatments were normalized to vector control within each replicate. (B) Representative images of cells stained for YAP. Scale bar represents 20 μM. (C) HEK-293A cells were cotransfected with a firefly luciferase (Fluc) reporter plasmid with a YAP-responsive TEAD promoter element, a TREX-Renilla luciferase (Rluc) reporter plasmid, and overexpression constructs for either a KapB, YAP 5SA, or vector control. At 36 h posttransfection, cells were starved in serum-free DMEM for 12 h and lysed, and Fluc and Rluc activity was recorded. Data are normalized to vector control. Graphs show the ratio of Fluc to Rluc, independent Fluc values, and independent Rluc values, respectively. (D) HUVECs were transduced with recombinant lentiviruses expressing KapB, a constitutively active version of YAP (YAP 5SA) or an empty vector control, selected, and lysed for total RNA. qRT-PCR analysis of steady-state mRNA levels of canonical YAP-regulated genes CTGF, ANKRD1 and CYR61 was performed and was normalized to steady-state HPRT-1 mRNA levels. Statistics were determined using repeated-measures ANOVA; error bars represent standard deviation. n = 3 independent biological replicates. *, P < 0.05; **, P < 0.01.
FIG 10
FIG 10
Active YAP elicits PB disassembly. (A, B, and D to F) HUVECs were transduced with YAP 5SA-expressing and empty vector lentivirus and selected. Cells were fixed for immunofluorescence. (A) Representative images of cells stained for PB resident proteins EDC4 (green) and F-actin (red, phalloidin). Boxes indicate area shown in the EDC4 (zoom) panel. Scale bar represents 20 μm. (B) Fixed cells were stained for CellProfiler analysis as detailed in Materials and Methods. The number of EDC4 puncta per cell was quantified and normalized to the vector control. (C) HeLa Tet-Off cells were seeded and cotransfected with an ARE-containing firefly luciferase (Fluc) reporter plasmid, a Renilla luciferase (Rluc) reporter plasmid lacking an ARE, and either a KapB, YAP 5SA expression plasmid, or vector controls. At 36 h posttransfection, transcription was terminated with doxycycline treatment for 12 h. Fluc and Rluc activity was measured. Data are normalized to vector control within each replicate. Graphs show the ratio of Fluc to Rluc, independent Fluc values, and independent Rluc values, respectively. (D to F) Representative images of cells stained for DDX6 (red), DCP1a (green), and DAPI (blue) (D); DDX6 (red), EDC4 (green), and DAPI (blue) (E); and DDX6 (red), YAP (green), and DAPI (blue) (F). Boxes indicate area shown in the zoom panels. Scale bar represents 20 μm. Statistics were determined using ratio-paired t tests between control and experimental groups (B) or repeated measures ANOVA (C); error bars represent standard deviation. n = 3 independent biological replicates. *, P < 0.05; **, P < 0.01.
FIG 11
FIG 11
YAP transcriptional activity is required for PB disassembly. HUVECs were transduced with YAP 5SA-, YAP 6SA-, or vector-expressing lentivirus and selected. Cells were fixed for immunofluorescence. (A) Representative images of cells stained for EDC4 (red), DDX6 (green), and DAPI (blue). Boxes indicate area shown in the zoom panels. Scale bar represents 20 μm. (B) Fixed cells were stained for CellProfiler analysis as detailed in Materials and Methods. CellProfiler was used to count nuclei, EDC4 puncta, and DDX6 puncta. In RStudio analysis, puncta with ≥60% correlation (mean correlation in vector control) between EDC4 and DDX6 (PBs) were counted and normalized to number of nuclei per condition. PB counts were normalized to vector control within each replicate.
FIG 12
FIG 12
YAP inputs mediate PB disassembly. (A and B) HUVECs were seeded onto collagen-coated microscope slides and exposed to shear stress of 2 dyn/cm2, 10 dyn/cm2, or no shear (static control) for 21 h. Cells were fixed and stained for immunofluorescence. (A) Representative images of cells stained for PB resident proteins EDC4 (green) and DDX6 (blue), as well as F-actin (red, phalloidin). Boxes indicate area shown in EDC4 (zoom) and DDX6 (zoom) panels. Scale bar represents 20 μm. (B) CellProfiler was used to count nuclei, EDC4 puncta, and DDX6 puncta. In RStudio analysis, puncta with ≥70% correlation (mean correlation in vector control) between EDC4 and DDX6 (PBs) were counted and normalized to number of nuclei per condition. PB counts were normalized to static control within each replicate. (C and D) HUVECs were split and seeded at a high, medium, and low density, cultured for 48 h, and fixed for immunofluorescence. (C) Representative images of cells stained for the PB resident proteins EDC4 (green) and F-actin (red, phalloidin). Boxes indicate images shown in EDC4 (zoom) panel. Scale bar represents 20 μm. (D) Fixed cells were stained for CellProfiler analysis as detailed in Materials and Methods. The number of EDC4 puncta per cell was quantified and normalized to the high confluence condition. (E and F) Coverslips were coated for 4 h with 0 to 64 μg/cm2 of collagen. HUVECs were grown for 72 h on coated coverslips and fixed for immunofluorescence. (E) Representative images of cells stained for PB resident proteins EDC4 (green), DDX6 (blue), and F-actin (red, phalloidin). Boxes indicate images shown in EDC4 (zoom) panel. Scale bar represents 20 μm. (F) Fixed cells were stained for CellProfiler analysis as detailed in Materials and Methods. The number of EDC4 puncta per cell was quantified and normalized to the 0 μg/ml collagen-coating condition. Statistics were determined using repeated-measures ANOVA (A and B) or Pearson’s correlation coefficient (C); error bars represent standard deviation (A and B) and 95% confidence interval of line of best fit (slope is significantly nonzero; P = 0.014) (C). n = 3 independent biological replicates. *, P < 0.05; **, P < 0.01.
FIG 13
FIG 13
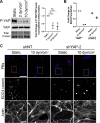
YAP is required for EDC4 puncta disassembly in HUVECs subjected to shear stress. (A) HUVECs were seeded onto collagen-coated microscope slides and exposed to shear stress of 2 dyn/cm2, 10 dyn/cm2, or a static control for 21 h. Cells were lysed for immunoblotting. One representative immunoblot and quantification of three independent experiments stained with P(S127)-YAP- and YAP-specific antibody are shown. P(S127)-YAP and YAP protein levels under each condition were normalized to total protein. All treatments were normalized to static control within each replicate. (B and C) HUVECs were transduced with shRNAs targeting YAP (shYAP-2) or with a nontargeting (shNT) control and selected. Cells were seeded onto collagen-coated microscope slides and exposed to shear stress of 10 dyn/cm2 or no shear (static control) for 21 h. Cells were fixed and stained for immunofluorescence. (B) CellProfiler was used to count nuclei and EDC4 puncta. In RStudio analysis, EDC4 puncta were normalized to number of nuclei per condition. EDC4 puncta counts were normalized to static control. (C) Representative images of cells stained for PB resident proteins EDC4 (red), DDX6 (green), and DAPI (blue). In parallel, separate coverslips were stained for F-actin (phalloidin). Boxes indicate area shown in the EDC4 (zoom) panel. Scale bar represents 20 μm. Statistics were determined using repeated-measures ANOVA (A); error bars represent standard deviation (A). n = 4, except 2 dyn/cm2 (n = 3) (A) and n = 2 (B and C) independent biological replicates. *, P < 0.05; **, P < 0.01.
FIG 14
FIG 14
YAP 5SA-mediated PB disassembly is not dependent on autophagy. YAP 5SA- and vector- expressing HUVECs were treated with 10 nM BafA1 or DMSO control for 30 min and fixed for immunofluorescence. (A and B) Fixed cells were stained for LC3 puncta analysis as detailed in Materials and Methods. (A) Representative images of cells stained for LC3 (white) and DAPI (blue). Boxes indicate the area of the field of view that is shown in LC3 (zoom) panel. Scale bar represents 20 μm. (B) The number of LC3 puncta per cell was quantified under each condition. (C and D) Fixed cells were stained for CellProfiler analysis as detailed in Materials and Methods. (C) Representative images of cells stained for DDX6 (red), YAP (green) and DAPI (blue). Boxes indicate the area of the field of view that is shown in DDX6 (zoom) panel. Scale bar represents 20 μm. (D) The number of DDX6 puncta per cell was quantified and normalized to the vector control within each replicate. (E) HUVECs were transduced with recombinant lentiviruses expressing KapB, a constitutively active version of YAP (YAP 5SA) or an empty vector control, selected, and lysed for total RNA. qRT-PCR analysis of steady-state mRNA levels of the Rab7-GTPase-activating protein, Armus, was performed and was normalized to steady-state HPRT-1 mRNA levels. Statistics were determined using a two-way ANOVA with multiple comparisons between control and experimental groups; error bars represent standard deviation. n = 3 independent biological replicates. **, P < 0.01; ***, P < 0.001.
FIG 15
FIG 15
KapB activates a mechanoresponsive pathway from within the cell rather than without to mediate PB disassembly. (A) Cells respond to external mechanical force by activating their structural support network, the actin cytoskeleton. The GTPase RhoA and its downstream effectors coordinate this response, bundling actin filaments into stress fibers (SFs), enhancing actomyosin contractility, and increasing adhesion to the underlying matrix to help withstand force-induced membrane deformation. Together, these actin-based responses increase cytoskeletal tension and elicit the dephosphorylation and nuclear translocation of the mechanoresponsive transcription activator YAP, where it collaborates with other transcription factors to induce TEAD-responsive genes. We present data to support the existence of a mechanoresponsive pathway that links actin SFs, actomyosin contractility, and the transcription transactivator YAP to the disassembly of PBs. The viral protein KapB taps into this mechanoresponsive pathway, triggering mechanical changes and forming contractile cytoskeletal structures that would normally respond to force, thereby inducing PB disassembly in a YAP-dependent manner from within the cell, rather than from without. Both KapB and stimuli that activate YAP cause PB disassembly. (B) Both KapB and active YAP have been shown to upregulate autophagic flux (100, 131); however, YAP 5SA also accelerates autophagosome-lysosome fusion by upregulating the Rab7-GTPase-activating protein, Armus, while KapB does not increase Armus transcription. In our model, upregulated autophagic flux contributes to PB disassembly mediated by both YAP 5SA and KapB.

Similar articles

Cited by

References

    1. Friedland JC, Lee MH, Boettiger D. 2009. Mechanically activated integrin switch controls alpha5beta1 function. Science 323:642–644. 10.1126/science.1168441. - DOI - PubMed
    1. Kong F, García AJ, Mould AP, Humphries MJ, Zhu C. 2009. Demonstration of catch bonds between an integrin and its ligand. J Cell Biol 185:1275–1284. 10.1083/jcb.200810002. - DOI - PMC - PubMed
    1. del Rio A, Perez-Jimenez R, Liu R, Roca-Cusachs P, Fernandez JM, Sheetz MP. 2009. Stretching single talin rod molecules activates vinculin binding. Science 323:638–641. 10.1126/science.1162912. - DOI - PMC - PubMed
    1. Grashoff C, Hoffman BD, Brenner MD, Zhou R, Parsons M, Yang MT, McLean MA, Sligar SG, Chen CS, Ha T, Schwartz MA. 2010. Measuring mechanical tension across vinculin reveals regulation of focal adhesion dynamics. Nature 466:263–266. 10.1038/nature09198. - DOI - PMC - PubMed
    1. Finch-Edmondson M, Sudol M. 2016. Framework to function: mechanosensitive regulators of gene transcription. Cell Mol Biol Lett 21:28. 10.1186/s11658-016-0028-7. - DOI - PMC - PubMed

Publication types

MeSH terms

LinkOut - more resources