With Chitosan and PLGA as the Delivery Vehicle, Toxoplasma gondii Oxidoreductase-Based DNA Vaccines Decrease Parasite Burdens in Mice
- PMID: 34512659
- PMCID: PMC8430031
- DOI: 10.3389/fimmu.2021.726615
With Chitosan and PLGA as the Delivery Vehicle, Toxoplasma gondii Oxidoreductase-Based DNA Vaccines Decrease Parasite Burdens in Mice
Abstract
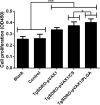
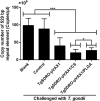
Toxoplasma gondii (T. gondii) is an intracellular parasitic protozoan that can cause serious public health problems. However, there is no effectively preventive or therapeutic strategy available for human and animals. In the present study, we developed a DNA vaccine encoding T. gondii oxidoreductase from short-chain dehydrogenase/reductase family (TgSDRO-pVAX1) and then entrapped in chitosan and poly lactic-co-glycolic acid (PLGA) to improve the efficacy. When encapsulated in chitosan (TgSDRO-pVAX1/CS nanospheres) and PLGA (TgSDRO-pVAX1/PLGA nanospheres), adequate plasmids were loaded and released stably. Before animal immunizations, the DNA vaccine was transfected into HEK 293-T cells and examined by western blotting and laser confocal microscopy. Th1/Th2 cellular and humoral immunity was induced in immunized mice, accompanied by modulated secretion of antibodies and cytokines, promoted the maturation and MHC expression of dendritic cells, and enhanced the percentages of CD4+ and CD8+ T lymphocytes. Immunization with TgSDRO-pVAX1/CS and TgSDRO-pVAX1/PLGA nanospheres conferred significant immunity with lower parasite burden in the mice model of acute toxoplasmosis. Furthermore, our results also lent credit to the idea that TgSDRO-pVAX1/CS and TgSDRO-pVAX1/PLGA nanospheres are substitutes for each other. In general, the current study proposed that TgSDRO-pVAX1 with chitosan or PLGA as the delivery vehicle is a promising vaccine candidate against acute toxoplasmosis.
Keywords: PLGA; Toxoplasma gondii; chitosan; immune protection; mouse; oxidoreductase.
Copyright © 2021 Yu, Cao, Gao, Aleem, Liu, Luo, Yan, Xu, Song and Li.
Conflict of interest statement
The authors declare that the research was conducted in the absence of any commercial or financial relationships that could be construed as a potential conflict of interest.
Figures


Similar articles
-
PLGA Nanoparticles as an Efficient Platform in Protein Vaccines Against Toxoplasma gondii.Acta Parasitol. 2022 Jun;67(2):582-591. doi: 10.1007/s11686-021-00499-w. Epub 2022 Jan 11. Acta Parasitol. 2022. PMID: 35013939 Review.
-
Nanospheres as the delivery vehicle: novel application of Toxoplasma gondii ribosomal protein S2 in PLGA and chitosan nanospheres against acute toxoplasmosis.Front Immunol. 2024 Oct 1;15:1475280. doi: 10.3389/fimmu.2024.1475280. eCollection 2024. Front Immunol. 2024. PMID: 39416787 Free PMC article.
-
Nano vaccines for T. gondii Ribosomal P2 Protein With Nanomaterials as a Promising DNA Vaccine Against Toxoplasmosis.Front Immunol. 2022 Feb 21;13:839489. doi: 10.3389/fimmu.2022.839489. eCollection 2022. Front Immunol. 2022. PMID: 35265084 Free PMC article.
-
Nano DNA Vaccine Encoding Toxoplasma gondii Histone Deacetylase SIR2 Enhanced Protective Immunity in Mice.Pharmaceutics. 2021 Sep 29;13(10):1582. doi: 10.3390/pharmaceutics13101582. Pharmaceutics. 2021. PMID: 34683874 Free PMC article.
-
Vaccination with a DNA vaccine cocktail encoding TgROP2, TgROP5, TgROP9, TgROP16, TgROP17, and TgROP18 confers limited protection against Toxoplasma gondii in BALB/c mice.Parasitol Res. 2024 Dec 26;123(12):420. doi: 10.1007/s00436-024-08435-3. Parasitol Res. 2024. PMID: 39724445
Cited by
-
Nanoparticles as a Delivery System of Antigens for the Development of an Effective Vaccine against Toxoplasma gondii.Vaccines (Basel). 2023 Mar 25;11(4):733. doi: 10.3390/vaccines11040733. Vaccines (Basel). 2023. PMID: 37112645 Free PMC article. Review.
-
PLGA Nanoparticles as an Efficient Platform in Protein Vaccines Against Toxoplasma gondii.Acta Parasitol. 2022 Jun;67(2):582-591. doi: 10.1007/s11686-021-00499-w. Epub 2022 Jan 11. Acta Parasitol. 2022. PMID: 35013939 Review.
-
Protective efficacy of Toxoplasma gondii GRA12 or GRA7 recombinant proteins encapsulated in PLGA nanoparticles against acute Toxoplasma gondii infection in mice.Front Cell Infect Microbiol. 2023 Jul 12;13:1209755. doi: 10.3389/fcimb.2023.1209755. eCollection 2023. Front Cell Infect Microbiol. 2023. PMID: 37502604 Free PMC article.
-
Advanced biopolymeric materials and nanosystems for RNA/DNA vaccines: a review.Nanomedicine (Lond). 2024;19(24):2027-2043. doi: 10.1080/17435889.2024.2382077. Epub 2024 Aug 7. Nanomedicine (Lond). 2024. PMID: 39110059 Review.
-
A novel Toxoplasma gondii TGGT1_316290 mRNA-LNP vaccine elicits protective immune response against toxoplasmosis in mice.Front Microbiol. 2023 Mar 21;14:1145114. doi: 10.3389/fmicb.2023.1145114. eCollection 2023. Front Microbiol. 2023. PMID: 37025641 Free PMC article.
References
Publication types
MeSH terms
Substances
LinkOut - more resources
Full Text Sources
Research Materials
Miscellaneous

