. 2021 Aug 30;22(17):9416.
doi: 10.3390/ijms22179416.

Role of RNA Motifs in RNA Interaction with Membrane Lipid Rafts: Implications for Therapeutic Applications of Exosomal RNAs

Affiliations

Role of RNA Motifs in RNA Interaction with Membrane Lipid Rafts: Implications for Therapeutic Applications of Exosomal RNAs

Rafał Mańka et al. Int J Mol Sci. .

Abstract

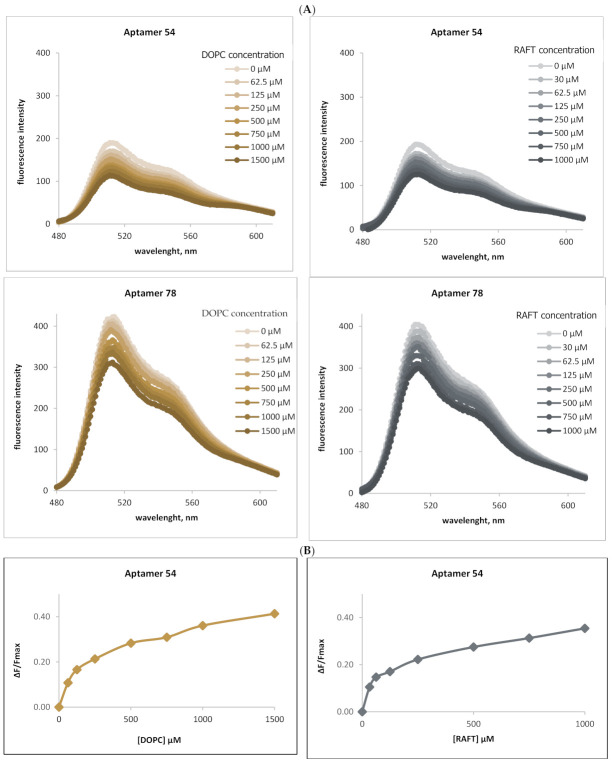
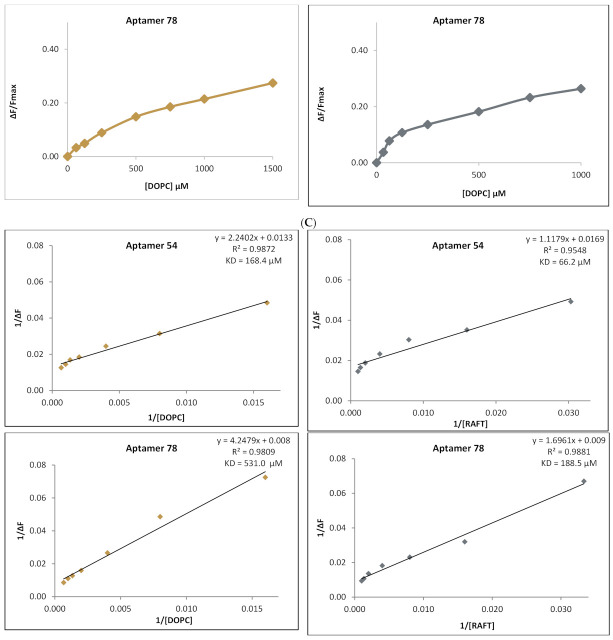
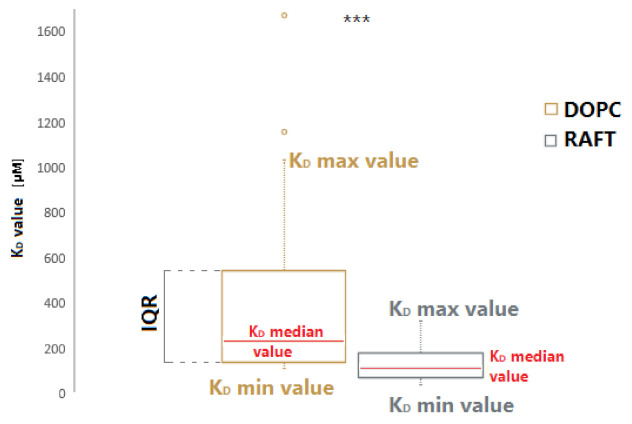
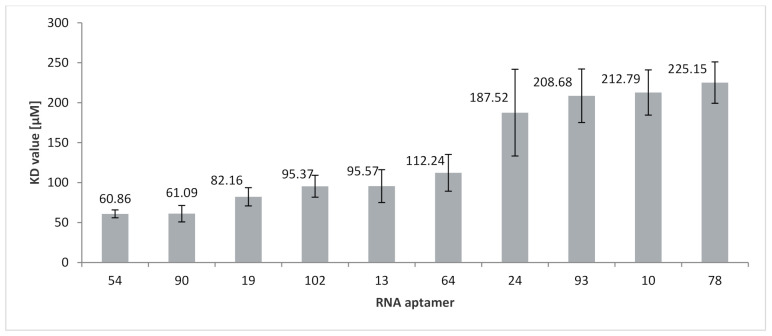
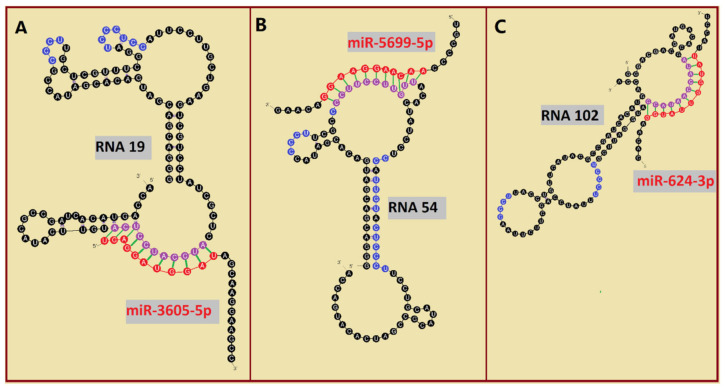
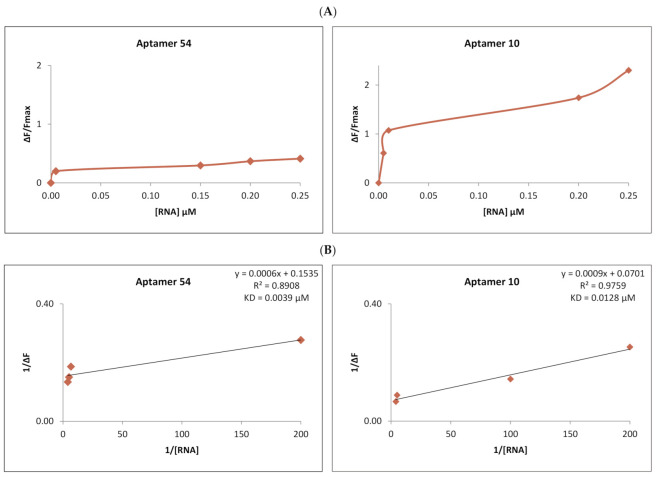
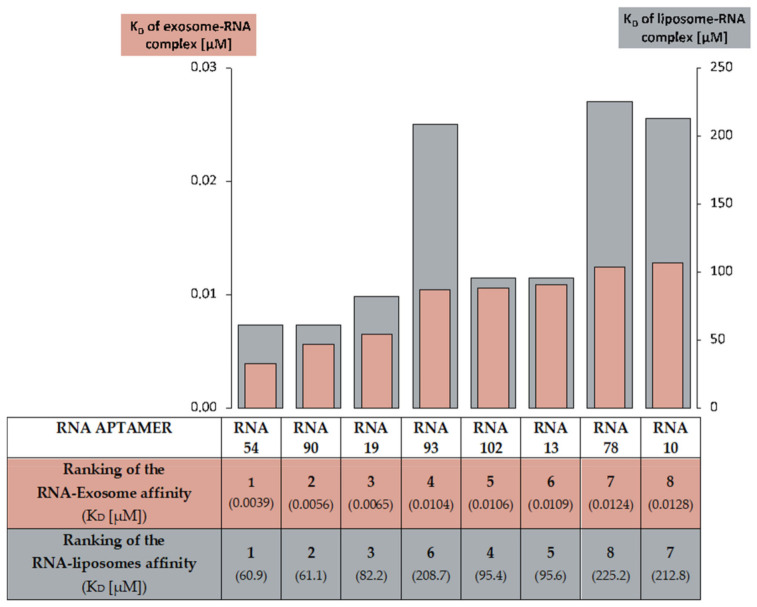
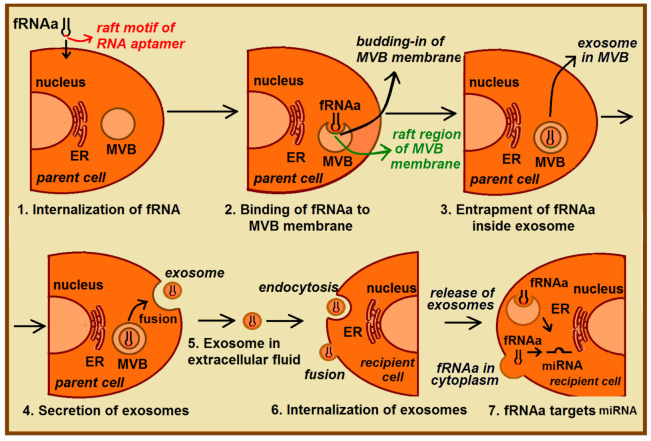
RNA motifs may promote interactions with exosomes (EXO-motifs) and lipid rafts (RAFT-motifs) that are enriched in exosomal membranes. These interactions can promote selective RNA loading into exosomes. We quantified the affinity between RNA aptamers containing various EXO- and RAFT-motifs and membrane lipid rafts in a liposome model of exosomes by determining the dissociation constants. Analysis of the secondary structure of RNA molecules provided data about the possible location of EXO- and RAFT-motifs within the RNA structure. The affinity of RNAs containing RAFT-motifs (UUGU, UCCC, CUCC, CCCU) and some EXO-motifs (CCCU, UCCU) to rafted liposomes is higher in comparison to aptamers without these motifs, suggesting direct RNA-exosome interaction. We have confirmed these results through the determination of the dissociation constant values of exosome-RNA aptamer complexes. RNAs containing EXO-motifs GGAG or UGAG have substantially lower affinity to lipid rafts, suggesting indirect RNA-exosome interaction via RNA binding proteins. Bioinformatics analysis revealed RNA aptamers containing both raft- and miRNA-binding motifs and involvement of raft-binding motifs UCCCU and CUCCC. A strategy is proposed for using functional RNA aptamers (fRNAa) containing both RAFT-motif and a therapeutic motif (e.g., miRNA inhibitor) to selectively introduce RNAs into exosomes for fRNAa delivery to target cells for personalized therapy.

Keywords: FRET spectroscopy; RNA aptamers; RNA motifs; exosomes; liposomes.


Conflict of interest statement

The authors declare no conflict of interest.

Figures

Figure 1
Figure 1
The interactions of YOYO-1-labeled RNA aptamers 54 and 78 with DOPC or RAFT liposomes. (A) Emission spectra of aptamer bound YOYO-1 (excitation at 466 nm), titrated with DOPC liposomes (0 µM–1500 µM) (left) and RAFT liposomes (0 µM–1000 µM) (right). The fluorescence intensity of YOYO-1 decreases with the increase in liposome concentration, for both aptamers 54 (top chart) and aptamer 78 (bottom) indicating the energy transfer to the membrane-bound acceptor (Liss Rhod PE). RNA aptamer concentration 0.25 µM, YOYO concentration 2.5 µM. (B) Change of YOYO-1 fluorescence during titration of RNA aptamer 54 (top) and RNA aptamer 78 (bottom) with DOPC liposomes (left) or RAFT liposomes (right). Fmax is the maximal YOYO-1 fluorescence obtained before acceptor-liposome titration. ΔF is the difference between measured fluorescence and Fmax (C). Reciprocal of YOYO-1 fluorescence change during titration with DOPC (in left) or RAFT (right) liposomes. The calculated KD values indicate stronger RNA aptamer interaction with RAFT liposomes. For RNA aptamer 54—membrane measurements (top), the KD values are 168.4 µM and 66.2 µM with the interaction with DOPC and RAFT liposomes, respectively; for RNA aptamer 78, the KD values are 530.0 µM and 188.5 µM for interaction with DOPC and RAFT liposomes, respectively. The regression line equation and the coefficient of determination (R2) are noted above the calculated KD value in the top-right corner of the chart.
Figure 1
Figure 1
The interactions of YOYO-1-labeled RNA aptamers 54 and 78 with DOPC or RAFT liposomes. (A) Emission spectra of aptamer bound YOYO-1 (excitation at 466 nm), titrated with DOPC liposomes (0 µM–1500 µM) (left) and RAFT liposomes (0 µM–1000 µM) (right). The fluorescence intensity of YOYO-1 decreases with the increase in liposome concentration, for both aptamers 54 (top chart) and aptamer 78 (bottom) indicating the energy transfer to the membrane-bound acceptor (Liss Rhod PE). RNA aptamer concentration 0.25 µM, YOYO concentration 2.5 µM. (B) Change of YOYO-1 fluorescence during titration of RNA aptamer 54 (top) and RNA aptamer 78 (bottom) with DOPC liposomes (left) or RAFT liposomes (right). Fmax is the maximal YOYO-1 fluorescence obtained before acceptor-liposome titration. ΔF is the difference between measured fluorescence and Fmax (C). Reciprocal of YOYO-1 fluorescence change during titration with DOPC (in left) or RAFT (right) liposomes. The calculated KD values indicate stronger RNA aptamer interaction with RAFT liposomes. For RNA aptamer 54—membrane measurements (top), the KD values are 168.4 µM and 66.2 µM with the interaction with DOPC and RAFT liposomes, respectively; for RNA aptamer 78, the KD values are 530.0 µM and 188.5 µM for interaction with DOPC and RAFT liposomes, respectively. The regression line equation and the coefficient of determination (R2) are noted above the calculated KD value in the top-right corner of the chart.
Figure 2
Figure 2
The range of KD values for binding RNA aptamers to DOPC and raft membranes. The box shows the interquartile range (IQR) of the KD measurements. The comparison of the median KD values (marked in red) for binding RNA aptamers to DOPC membranes is 232 µM (left) and to raft membranes is 113 µM (right), indicates stronger RNA aptamer interaction with raft membranes rather than disordered membranes. The whiskers (dotted line) restrict the KD value range and mark the minimal and maximal KD values. The circles in the top of the boxplot are the outliers (nDOPC = 20, nRAFT = 30). The symbol *** means that p < 0.001 (Mann–Whitney U test of differences in medians).
Figure 3
Figure 3
Comparison of the KD values for binding of RNA aptamers to RAFT liposomes. The KD values are the mean ± SE of 3–4 independent experiments.
Figure 4
Figure 4
Binding of human miRNAs to bifunctional RNA aptamers containing both raft- and miRNA-binding motifs. (A) RNA 19 interacting with miR-3605-5p. (B) RNA 54 interacting with miR-5699-5p. (C) RNA 102 interacting with miR-624-3p. The RNA aptamer’s raft-binding motifs are marked in blue, and the miRNA-binding motif is marked in purple. The miRNA reversed/complement motif is marked in red.
Figure 5
Figure 5
Comparison of the interaction of the strongest binding aptamer, RNA 54 (left), and the least strong, RNA 10 (right), to purified exosomes. (A) Change in the fluorescence of exosome-bound CTB-555 and fDiI during titration with RNA aptamer 54 (left) and RNA aptamer 11 (right). Fmax is the maximal CTB-555 and fDiI fluorescence obtained before titration with RNA acceptor. ΔF is the difference between measured fluorescence and Fmax. (B) Reciprocal of CTB-555 and fDiI fluorescence change during titration with RNA aptamer 54 (in left) and aptamer 10 (right). The regression line equation and the coefficient of determination (R2) are noted above the calculated KD value in the top-right corner of the chart.
Figure 6
Figure 6
A comparison of the RNA aptamer affinity to raft liposomes and to exosomes. The ranking of RNA-to-raft liposomes affinity was based on the RNA-liposome complex KD calculations. The ranking of RNA-to-exosomes affinity was based on KD for the RNA-exosome complex.
Figure 7
Figure 7
Proposed fRNAa delivery mediated by exosomes. The functional RNA aptamer (fRNAa) owns a therapeutic domain as well as RAFT-motif sequence and its delivery involves a few stages: (1) Internalization of the fRNAa by donor cells; (2) binding of fRNAa to the raft-like domains inside membrane of MVB; (3) entrapment of fRNAa inside ILV (exosomes), resulted from the budding-in process of MVB membrane; (4) secretion of exosomes by the fusion of MVB with the parent cell membrane; (5) exosomal transport of fRNAa in the extracellular fluids; (6) internalization of exosomes by recipient cell, resulted from the endocytosis or/and fusion of exosomes with plasma membrane; (7) release of exosome content, which allows fRNAa reach the target miRNA and induce desired effects inside the target cell.

Similar articles

Cited by

References

    1. Johnstone R.M., Adam M., Hammond J.R., Orr L., Turbide C. Vesicle formation during reticulocyte maturation. Association of plasma membrane activities with released vesicles (exosomes) J. Biol. Chem. 1987;262:9412–9420. doi: 10.1016/S0021-9258(18)48095-7. - DOI - PubMed
    1. Raposo G., Nijman H.W., Stoorvogel W., Liejendekker R., Harding C.V., Melief C.J.M., Geuze H.J. B lymphocytes secrete antigen-presenting vesicles. J. Exp. Med. 1996;183:1161–1172. doi: 10.1084/jem.183.3.1161. - DOI - PMC - PubMed
    1. Blanchard N., Lankar D., Faure F., Regnault A., Dumont C., Raposo G., Hivroz C. TCR Activation of human T cells induces the production of exosomes bearing the TCR/CD3/ζ Complex. J. Immunol. 2002;168:3235–3241. doi: 10.4049/jimmunol.168.7.3235. - DOI - PubMed
    1. Théry C., Regnault A., Garin J., Wolfers J., Zitvogel L., Ricciardi-Castagnoli P., Raposo G., Amigorena S. Molecular characterization of dendritic cell-derived exosomes: Selective accumulation of the heat shock protein hsc73. J. Cell Biol. 1999;147:599–610. doi: 10.1083/jcb.147.3.599. - DOI - PMC - PubMed
    1. Wolfers J., Lozier A., Raposo G., Regnault A., Théry C., Masurier C., Flament C., Pouzieux S., Faure F., Tursz T. Tumor-derived exosomes are a source of shared tumor rejection antigens for CTL cross-priming. Nat. Med. 2001;7:297–303. doi: 10.1038/85438. - DOI - PubMed

LinkOut - more resources