. 2022 Jan;15(1):130-142.
doi: 10.1038/s41385-021-00450-2. Epub 2021 Sep 8.

STAT1 coordinates intestinal epithelial cell death during gastrointestinal infection upstream of Caspase-8

Affiliations

STAT1 coordinates intestinal epithelial cell death during gastrointestinal infection upstream of Caspase-8

Iris Stolzer et al. Mucosal Immunol. 2022 Jan.

Abstract

Intestinal homeostasis and the maintenance of the intestinal epithelial barrier are essential components of host defense during gastrointestinal Salmonella Typhimurium infection. Both require a strict regulation of cell death. However, the molecular pathways regulating epithelial cell death have not been completely understood. Here, we elucidated the contribution of central mechanisms of regulated cell death and upstream regulatory components during gastrointestinal infection. Mice lacking Caspase-8 in the intestinal epithelium are highly sensitive towards bacterial induced enteritis and intestinal inflammation, resulting in an enhanced lethality of these mice. This phenotype was associated with an increased STAT1 activation during Salmonella infection. Cell death, barrier breakdown and systemic infection were abrogated by an additional deletion of STAT1 in Casp8ΔIEC mice. In the absence of epithelial STAT1, loss of epithelial cells was abolished which was accompanied by a reduced Caspase-8 activation. Mechanistically, we demonstrate that epithelial STAT1 acts upstream of Caspase-8-dependent as well as -independent cell death and thus might play a major role at the crossroad of several central cell death pathways in the intestinal epithelium. In summary, we uncovered that transcriptional control of STAT1 is an essential host response mechanism that is required for the maintenance of intestinal barrier function and host survival.


Conflict of interest statement

The authors declare no competing interests.

Figures
Fig. 1
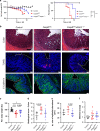
Fig. 1. Deletion of STAT1 ensures survival of Casp8ΔIEC mice during Salmonella Typhimurium infection.
A–D Casp8ΔIEC, Casp8ΔIECxStat1−/− mice and control mice were orally infected with Salmonella Typhimurium ΔaroA and analyzed at day 3 post infection. Pooled data of 4 individual experiments. A Casp8ΔIEC (n = 9), Casp8ΔIECxStat1−/− (n = 10) mice and control mice (n = 16) were orally infected with Salmonella Typhimurium ΔaroA. Relative body weight and Kaplan–Meier survival curve of infected animals. Error bars indicated +SD. B Representative images of caecum and colon cross sections at day 3 post infection with H&E staining (scale bar: caecum 200 μm; colon 100 μm). C Relative body weight at day 3 post infection. D Histological scores of H&E stained tissue cross sections. Error bars indicate ±SD. Statistical analyses: ANOVA with Tukey’s multiple comparisons test; NS p ≥ 0.05; *p < 0.05; **p < 0.01; ***p < 0.001; ****p < 0.0001.
Fig. 2
Fig. 2. Deletion of STAT1 restores epithelial integrity in Casp8ΔIEC mice.
A–D Casp8ΔIEC, Casp8ΔIECxStat1−/− mice and control mice were orally infected with Salmonella Typhimurium ΔaroA and analyzed at day 3 post infection. Pooled data of 4 individual experiments. A Representative images of colon cross sections immunohistochemically stained with antibody against E-Cadherin (green) or stained with TUNEL assay (red). Nuclei were counterstained with Hoechst 33342 (blue). Tissue gaps are indicated with asterisk and arrows (scale bar: 50 μm). B Representative images of colon cross sections immunohistochemically stained with antibody against Claudin-4 or ZO-1 (red) (scale bar: 75 μm). Nuclei were counterstained with Hoechst 33342 (blue). C Quantification of epithelial alterations. D Gene transcription analysis of colonic mRNA expression. Hprt was used as housekeeping gene. Gene expression levels are shown as fold changes. Error bars indicate ±SD Statistical analyses: One-way ANOVA with Tukey’s multiple comparisons test; NS p ≥ 0.05; *p < 0.05; **p < 0.01; ***p < 0.001; ****p < 0.0001.
Fig. 3
Fig. 3. STAT1 contributes to epithelial cell death during Citrobacter rodentium infection.
A-F Casp8ΔIEC, Casp8ΔIECxStat1−/− mice and control animals were orally infected with Citrobacter rodentium and analyzed at day 7 post infection. Pooled data of individual experiments (A, C n = 4; B, DF n = 2). A Casp8ΔIEC (n = 13), Casp8ΔIECxStat1−/− (n = 13) mice and control mice (n = 16) were orally infected with Citrobacter rodentium. Relative body weight and Kaplan–Meier survival curve of infected animals. Error bars indicated +SD. B Representative images of H&E stained colon cross sections (scale bar: 100 μm) or immunohistochemically stained with an antibody against E-Cadherin (green) or stained with TUNEL assay (red). Nuclei were counterstained with Hoechst 33342 (blue) (scale bar: 50 μm). C Rel. bodyweight at day 7 post infection. D Histological score of H&E stained tissue cross sections. E Quantification of epithelial alteration of E-Cadherin staining visualized in B. F Gene transcription analysis of colonic mRNA expression. Hprt was used as housekeeping gene. Gene expression level is shown as fold change. Error bars indicate ±SD. Statistical analyses: One-way AOVA with Tukey’s multiple comparisons test; NS p ≥ 0.05; *p < 0.05; **p < 0.01; ***p < 0.001; ****p < 0.0001.
Fig. 4
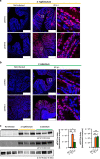
Fig. 4. STAT1 and STAT3 activation during Salmonella Typhimurium and Citrobacter rodentium infection.
Control animals (n ≥ 6) were infected with S. Typhimurium ΔaroA (A) or C. rodentium (B) sacrificed at day 3 post infection. Representative images of colon cross sections immunohistochemically stained with antibody against pSTAT1 (scale bar: 250 μm) or pSTAT3 (scale bar: 250 μm) (red). Nuclei were counterstained with Hoechst 33342 (blue). C Western Blot analysis and normalization of colonic tissue with antibodies against pSTAT1 and pSTAT3. β-Actin was used as loading control. Densitometry analysis for quantification (n = 3 per group). Error bars indicate +SD. Statistical analyses: One-way ANOVA with Tukey’s multiple comparisons test; NS p ≥ 0.05; *p < 0.05; **p < 0.01; ***p < 0.001.
Fig. 5
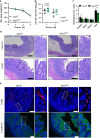
Fig. 5. Epithelial STAT1 signaling coordinates the host defense during Salmonella Typhimurium infection.
A–E Stat1ΔIEC mice and control littermates were orally infected with Salmonella Typhimurium (SL1344) and analyzed at day3 post infection. Pooled data of independent individual experiments (n ≥ 4). A Stat1ΔIEC mice (n = 11) and control (Stat1fl) littermates (n = 14) were orally infected with Salmonella Typhimurium. Relative body weight of infected animals Error bars indicated ± SD. B Bacterial burden of the first two days post infection. C Histological scores of H&E stained colonic tissue cross sections. Error bar + SD. NS p ≥ 0.05; *p < 0.05; **p < 0.01. D Representative images of caecum and colon cross sections with H&E staining (scale bar: caecum 200 μm; colon 100 μm). E Representative images of colon cross sections immunohistochemically stained with antibody against E-Cadherin (green; scale bar: 75 μm), or stained with TUNEL assay (red; scale bar: 100 μm). Nuclei were counterstained with Hoechst 33342 (blue).
Fig. 6
Fig. 6. Intestinal epithelial STAT1 signaling coordinate host cell death during wildtype Salmonella Typhimurium infection.
A–C Stat1ΔIEC mice and control (Stat1fl) littermates were orally infected with Salmonella Typhimurium (SL1344) and analyzed at day3 post infection. Experiments were repeated 3 times with similar results (pooled data). A Gene transcription analysis of colonic mRNA expression. Gapdh was used as housekeeping gene. Gene expression level is shown as fold change. Error bars indicate ±SD. Statistical analyses: Student’s t test; NS p ≥ 0.05; *p < 0.05; **p < 0.01; ***p < 0.001; ****p < 0.0001. B IL-22 serum ELISA. Error bars indicate ±SD. C Western blot analysis and normalization of colonic tissue with antibodies against cleaved Caspase-8. Erk was used as loading control. Densitometry analysis for quantification. D Schematic overview of cell death pathways altered by STAT1. Created with www.BioRender.com.

Similar articles

Cited by

References

    1. Kirk MD, et al. World Health Organization estimates of the global and regional disease burden of 22 foodborne bacterial, protozoal, and viral diseases, 2010: a data synthesis. PLoS Med. 2015;12:e1001921. - PMC - PubMed
    1. Grassl GA, Finlay BB. Pathogenesis of enteric Salmonella infections. Curr. Opin. Gastroenterol. 2008;24:22–26. - PubMed
    1. Santos RL, Tsolis RM, Baumler AJ, Adams LG. Pathogenesis of Salmonella-induced enteritis. Braz. J. Med Biol. Res. 2003;36:3–12. - PubMed
    1. Wemyss MA, Pearson JS. Host cell death responses to non-typhoidal salmonella infection. Front Immunol. 2019;10:1758. - PMC - PubMed
    1. Ingram JP, et al. A nonpyroptotic IFN-gamma-triggered cell death mechanism in nonphagocytic cells promotes salmonella clearance in vivo. J. Immunol. 2018;200:3626–3634. - PMC - PubMed

Publication types