Proviral Turnover During Untreated HIV Infection Is Dynamic and Variable Between Hosts, Impacting Reservoir Composition on ART
- PMID: 34489909
- PMCID: PMC8417368
- DOI: 10.3389/fmicb.2021.719153
Proviral Turnover During Untreated HIV Infection Is Dynamic and Variable Between Hosts, Impacting Reservoir Composition on ART
Abstract
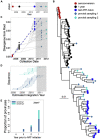
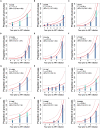
Human immunodeficiency virus (HIV) can persist as an integrated provirus, in a transcriptionally repressed state, within infected cells. This small yet enduring pool of cellular reservoirs that harbor replication-competent HIV is the main barrier to cure. Entry of viral sequences into cellular reservoirs begins shortly after infection, and cells containing integrated proviral DNA are extremely stable once suppressive antiretroviral therapy (ART) is initiated. During untreated HIV infection however, reservoir turnover is likely to be more dynamic. Understanding these dynamics is important because the longevity of the persisting proviral pool during untreated infection dictates reservoir composition at ART initiation. If the persisting proviral pool turns over slowly pre-ART, then HIV sequences seeded into it during early infection would have a high likelihood of persisting for long periods. However, if pre-ART turnover was rapid, the persisting proviral pool would rapidly shift toward recently circulating HIV sequences. One-way to estimate this turnover rate is from the age distributions of proviruses sampled shortly after therapy initiation: this is because, at the time of sampling, the majority of proviral turnover would have already occurred prior to ART. Recently, methods to estimate a provirus' age from its sequence have made this possible. Using data from 12 individuals with HIV subtype C for whom proviral ages had been determined phylogenetically, we estimated that the average proviral half-life during untreated infection was 0.78 (range 0.45-2.38) years, which is >15 times faster than that of proviral DNA during suppressive ART. We further show that proviral turnover during untreated infection correlates with both viral setpoint and rate of CD4+ T-cell decline during this period. Overall, our results support dynamic proviral turnover pre-ART in most individuals, which helps explain why many individuals' reservoirs are skewed toward younger HIV sequences. Broadly, our findings are consistent with the notion that active viral replication creates an environment less favorable to proviral persistence, while viral suppression creates conditions more favorable to persistence, where ART stabilizes the proviral pool by dramatically slowing its rate of decay. Strategies to inhibit this stabilizing effect and/or to enhance reservoir turnover during ART could represent additional strategies to reduce the HIV reservoir.
Keywords: HIV; persistence; proviral half-life; reservoir; within-host phylogenetic analysis.
Copyright © 2021 Brooks, Omondi, Liang, Sudderuddin, Jones, Joy, Brumme, Hunter and Brumme.
Conflict of interest statement
The authors declare that the research was conducted in the absence of any commercial or financial relationships that could be construed as a potential conflict of interest. The handling editor declared a past collaboration with the authors ZB and CB.
Figures


Similar articles
-
The replication-competent HIV reservoir is a genetically restricted, younger subset of the overall pool of HIV proviruses persisting during therapy, which is highly genetically stable over time.Res Sq [Preprint]. 2023 Aug 16:rs.3.rs-3259040. doi: 10.21203/rs.3.rs-3259040/v1. Res Sq. 2023. Update in: J Virol. 2024 Feb 20;98(2):e0165523. doi: 10.1128/jvi.01655-23 PMID: 37645749 Free PMC article. Updated. Preprint.
-
HIV Proviral Burden, Genetic Diversity, and Dynamics in Viremic Controllers Who Subsequently Initiated Suppressive Antiretroviral Therapy.mBio. 2021 Dec 21;12(6):e0249021. doi: 10.1128/mBio.02490-21. Epub 2021 Nov 16. mBio. 2021. PMID: 34781741 Free PMC article.
-
Intact HIV Proviruses Persist in Children Seven to Nine Years after Initiation of Antiretroviral Therapy in the First Year of Life.J Virol. 2020 Jan 31;94(4):e01519-19. doi: 10.1128/JVI.01519-19. Print 2020 Jan 31. J Virol. 2020. PMID: 31776265 Free PMC article.
-
HIV-1 Reservoir Persistence and Decay: Implications for Cure Strategies.Curr HIV/AIDS Rep. 2022 Jun;19(3):194-206. doi: 10.1007/s11904-022-00604-2. Epub 2022 Apr 11. Curr HIV/AIDS Rep. 2022. PMID: 35404007 Free PMC article. Review.
-
The role of integration and clonal expansion in HIV infection: live long and prosper.Retrovirology. 2018 Oct 23;15(1):71. doi: 10.1186/s12977-018-0448-8. Retrovirology. 2018. PMID: 30352600 Free PMC article. Review.
Cited by
-
HIV proviral genetic diversity, compartmentalization and inferred dynamics in lung and blood during long-term suppressive antiretroviral therapy.PLoS Pathog. 2022 Nov 4;18(11):e1010613. doi: 10.1371/journal.ppat.1010613. eCollection 2022 Nov. PLoS Pathog. 2022. PMID: 36331974 Free PMC article.
-
The replication-competent HIV reservoir is a genetically restricted, younger subset of the overall pool of HIV proviruses persisting during therapy, which is highly genetically stable over time.J Virol. 2024 Feb 20;98(2):e0165523. doi: 10.1128/jvi.01655-23. Epub 2024 Jan 12. J Virol. 2024. PMID: 38214547 Free PMC article.
-
The replication-competent HIV reservoir is a genetically restricted, younger subset of the overall pool of HIV proviruses persisting during therapy, which is highly genetically stable over time.Res Sq [Preprint]. 2023 Aug 16:rs.3.rs-3259040. doi: 10.21203/rs.3.rs-3259040/v1. Res Sq. 2023. Update in: J Virol. 2024 Feb 20;98(2):e0165523. doi: 10.1128/jvi.01655-23 PMID: 37645749 Free PMC article. Updated. Preprint.
-
HIV-1 diversity in viral reservoirs obtained from circulating T-cell subsets during early ART and beyond.PLoS Pathog. 2024 Sep 18;20(9):e1012526. doi: 10.1371/journal.ppat.1012526. eCollection 2024 Sep. PLoS Pathog. 2024. PMID: 39292732 Free PMC article.
-
HIV Proviral Burden, Genetic Diversity, and Dynamics in Viremic Controllers Who Subsequently Initiated Suppressive Antiretroviral Therapy.mBio. 2021 Dec 21;12(6):e0249021. doi: 10.1128/mBio.02490-21. Epub 2021 Nov 16. mBio. 2021. PMID: 34781741 Free PMC article.
References
-
- Archin N. M., Vaidya N. K., Kuruc J. A. D., Liberty A. L., Wiegand A., Kearney M. F., et al. (2012). Immediate antiviral therapy appears to restrict resting CD4 + cell HIV-1 infection without accelerating the decay of latent infection. Proc. Natl. Acad. Sci. U.S.A. 109 9523–9528. 10.1073/pnas.1120248109 - DOI - PMC - PubMed
Grants and funding
LinkOut - more resources
Full Text Sources
Research Materials

