. 2022 Jan;12(1):108-133.
doi: 10.1158/2159-8290.CD-21-0003. Epub 2021 Sep 3.

Low-Dose Radiotherapy Reverses Tumor Immune Desertification and Resistance to Immunotherapy

Affiliations

Low-Dose Radiotherapy Reverses Tumor Immune Desertification and Resistance to Immunotherapy

Fernanda G Herrera et al. Cancer Discov. 2022 Jan.

Abstract

Developing strategies to inflame tumors is critical for increasing response to immunotherapy. Here, we report that low-dose radiotherapy (LDRT) of murine tumors promotes T-cell infiltration and enables responsiveness to combinatorial immunotherapy in an IFN-dependent manner. Treatment efficacy relied upon mobilizing both adaptive and innate immunity and depended on both cytotoxic CD4+ and CD8+ T cells. LDRT elicited predominantly CD4+ cells with features of exhausted effector cytotoxic cells, with a subset expressing NKG2D and exhibiting proliferative capacity, as well as a unique subset of activated dendritic cells expressing the NKG2D ligand RAE1. We translated these findings to a phase I clinical trial administering LDRT, low-dose cyclophosphamide, and immune checkpoint blockade to patients with immune-desert tumors. In responsive patients, the combinatorial treatment triggered T-cell infiltration, predominantly of CD4+ cells with Th1 signatures. Our data support the rational combination of LDRT with immunotherapy for effectively treating low T cell-infiltrated tumors. SIGNIFICANCE: Low-dose radiation reprogrammed the tumor microenvironment of tumors with scarce immune infiltration and together with immunotherapy induced simultaneous mobilization of innate and adaptive immunity, predominantly CD4+ effector T cells, to achieve tumor control dependent on NKG2D. The combination induced important responses in patients with metastatic immune-cold tumors.This article is highlighted in the In This Issue feature, p. 1.


Figures

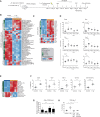
Figure 1. LDRT induces immune-cell infiltration in orthotopic ID8 tumors. A, Treatment schema of mice engrafted with intraperitoneal ID8 ovarian tumors. Arrow represents administration of LD-WART (1 Gy). B and C, NanoString analysis of LD-WART treated versus control tumors. MSigDB pathways (B) and intratumoral levels of cytokines and chemokines (C) are displayed as heat maps. Red, upregulated; blue, downregulated. D, mRNA levels of intratumoral cytokines and chemokines. E, Heat map of cell density changes in tumors based on NanoString analysis. The heat map legend applies to B, C, and E. F, Flow cytometry quantification of TILs. G, CD8+:Foxp3+ cell ratio by mIF imaging five days after LD-WART. H, Flow cytometry quantification of CD8+ TILs in control mice and mice subjected to IFNα receptor blockade or IFNγ depletion. Symbols represent individual tumors and bars the mean. Data are representative of three independent experiments and are presented as mean ± SEM. *, P ≤ 0.05; **, P < 0.01; ***, P < 0.001; ****, P < 0.0001; Student unpaired t test.
Figure 1.
LDRT induces immune-cell infiltration in orthotopic ID8 tumors. A, Treatment schema of mice engrafted with intraperitoneal ID8 ovarian tumors. Arrow represents administration of LD-WART (1 Gy). B and C, NanoString analysis of LD-WART treated versus control tumors. MSigDB pathways (B) and intratumoral levels of cytokines and chemokines (C) are displayed as heat maps. Red, upregulated; blue, downregulated. D, mRNA levels of intratumoral cytokines and chemokines. E, Heat map of cell density changes in tumors based on NanoString analysis. The heat map legend applies to B, C, and E. F, Flow cytometry quantification of TILs. G, CD8+:Foxp3+ cell ratio by mIF imaging five days after LD-WART. H, Flow cytometry quantification of CD8+ TILs in control mice and mice subjected to IFNα receptor blockade or IFNγ depletion. Symbols represent individual tumors and bars the mean. Data are representative of three independent experiments and are presented as mean ± SEM. *, P ≤ 0.05; **, P < 0.01; ***, P < 0.001; ****, P < 0.0001; Student unpaired t test.
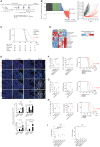
Figure 2. Metronomic radiotherapy enables combinatorial immunotherapy. A, Schema of in vivo study evaluating treatment by LD-WART (1 Gy) versus CIM versus RACIM. B, Left, waterfall plot representing the percentage change in tumor BLI levels at day 20 for mice treated in the different groups (RACIM, n = 36 mice; control, n = 41; CIM, n = 26; LD-WART, n = 24). Complete response (CR), PR (at least 30% decrease in BLI from baseline), SD, PD (at least 20% increase in BLI from baseline). Right, tumor growth curves evaluated by BLI. C, Kaplan–Meier analysis in representative mice treated in six different experiments (RACIM, n = 80 mice; control, n = 92; CIM, n = 30; LD-WART, n = 24). P values were determined by a one-sided log-rank Mantel–Cox test. D, Heat map of cell density changes in tumors based on NanoString analysis. E, mIF imaging reveals immune-cell infiltration in tumors at cycle 2, day 5 (20× magnification; DAPI nuclear counterstaining; images are representative of n = 5 mice/group). Number of cells per HPF plotted as mean ± SEM; P was calculated using unpaired two-tailed Student t tests. F–H, Immune-cell phenotypes evaluated on single-cell suspensions of control, RACIM, or RACIM one component, ID8 tumors (n = 5–7 mice per group). Kaplan–Meier analyses of overall survival following RACIM in the absence of anti–PD-1 (F) or anti-CTLA4 antibody, CP (G), or anti-CD40 agonist antibody (H) for n = 10 mice per group. P values were determined by a one-sided log-rank Mantel–Cox test. I, mRNA levels of Tnfa and Ifng in differently treated ID8 tumors. In vivo data are representative of three independent experiments. *, P ≤ 0.05; **, P < 0.01; ***, P < 0.001; ****, P < 0.0001.
Figure 2.
Metronomic radiotherapy enables combinatorial immunotherapy. A, Schema of in vivo study evaluating treatment by LD-WART (1 Gy) versus CIM versus RACIM. B, Left, waterfall plot representing the percentage change in tumor BLI levels at day 20 for mice treated in the different groups (RACIM, n = 36 mice; control, n = 41; CIM, n = 26; LD-WART, n = 24). Complete response (CR), PR (at least 30% decrease in BLI from baseline), SD, PD (at least 20% increase in BLI from baseline). Right, tumor growth curves evaluated by BLI. C, Kaplan–Meier analysis in representative mice treated in six different experiments (RACIM, n = 80 mice; control, n = 92; CIM, n = 30; LD-WART, n = 24). P values were determined by a one-sided log-rank Mantel–Cox test. D, Heat map of cell density changes in tumors based on NanoString analysis. E, mIF imaging reveals immune-cell infiltration in tumors at cycle 2, day 5 (20× magnification; DAPI nuclear counterstaining; images are representative of n = 5 mice/group). Number of cells per HPF plotted as mean ± SEM; P was calculated using unpaired two-tailed Student t tests. F–H, Immune-cell phenotypes evaluated on single-cell suspensions of control, RACIM, or RACIM one component, ID8 tumors (n = 5–7 mice per group). Kaplan–Meier analyses of overall survival following RACIM in the absence of anti–PD-1 (F) or anti-CTLA4 antibody, CP (G), or anti-CD40 agonist antibody (H) for n = 10 mice per group. P values were determined by a one-sided log-rank Mantel–Cox test. I, mRNA levels of Tnfa and Ifng in differently treated ID8 tumors. In vivo data are representative of three independent experiments. *, P ≤ 0.05; **, P < 0.01; ***, P < 0.001; ****, P < 0.0001.
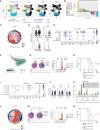
Figure 3. Low-dose irradiation and combinatorial immunotherapy expands tumor-rejecting CD4+ and CD8+ TILs exhibiting states of activation and exhaustion. A, UMAP plots of tumor lymphocyte scRNA-seq data (n = 3 tumors/treatment, n = 4 tumors pooled for control, all collected on day 5 of cycle 2). Left, reference map for all groups. Right, contour plots reveal cell density/group. Supervised T-cell state classification by TILPRED identifies functional T-cell subsets: Tpex, Tex, TEM, early activated (EA), Th1, Tfh, Treg, and naïve-like T cells. B, Fold change in T-cell subsets following RACIM versus CIM. C, Cord diagram of the Jaccard similarity coefficient shows the relative number of common TCRs shared between CD4+ T-cell subsets following RACIM. D, Violin plots representing the expression of various activation and cytotoxicity markers in CD4+ T-cell subsets. E, CD4+ T cells expressing indicated genes across subsets and their corresponding average expression (size of dot indicates the percentage of cells in each subset; expression intensity is indicated by color). F, Pseudotime trajectory analysis of CD4_Tpex, CD4_Tex, and Th1 clusters identified by unsupervised single-cell analysis. G, Left, SPICE graphic representing flow-cytometric analysis of GzmB and cytokine production by CD4+ TCF1−PD1+ TILs. Right, bar plots representing cytokine production by CD4+ TCF1−PD-1+ TOX+ cells after PMA/ionomycin or anti-CD3/anti-CD28 TCR stimulation. H, Kaplan–Meier analysis of overall survival of RACIM-treated mice, depleted or not of CD4+ T cells. P values determined by a one-sided log-rank Mantel–Cox test. I, The percentage of CD8+ T cells expressing indicated genes across subsets and their corresponding average expression (as in E). J, Violin plots showing expression of Ifng, Gzmb, and Prf1 in CD8+ T cells following CIM vs. RACIM. K, Bar plots representing the most clonally expanded CD8+ T-cell clonotypes (by TCR-seq) following RACIM treatment (TCRs in all three tumors: #1; in individual tumors: #2–4). L, Cord diagram of the Jaccard similarity coefficient shows the relative number of common TCRs between CD8+ T-cell subsets following RACIM. M, Left, SPICE graphic representing flow cytometric analysis of GzmB and cytokine production by CD8+PD-1+TCF1− TILs. Right: bar plots representing cytokine production by CD8+ TCF1−PD-1+TOX+ cells after PMA/ionomycin or anti-CD3/anti-CD28 TCR stimulation. N, Kaplan–Meier analysis of overall survival of RACIM-treated mice depleted or not of CD8+ T cells. P values were determined by a one-sided log-rank Mantel–Cox test. Data are representative of n = 3 biologically independent experiments (n = 5–10). *, P ≤ 0.05; **, P < 0.01; ***, P < 0.001; ****, P < 0.0001.
Figure 3.
Low-dose irradiation and combinatorial immunotherapy expands tumor-rejecting CD4+ and CD8+ TILs exhibiting states of activation and exhaustion. A, UMAP plots of tumor lymphocyte scRNA-seq data (n = 3 tumors/treatment, n = 4 tumors pooled for control, all collected on day 5 of cycle 2). Left, reference map for all groups. Right, contour plots reveal cell density/group. Supervised T-cell state classification by TILPRED identifies functional T-cell subsets: Tpex, Tex, TEM, early activated (EA), Th1, Tfh, Treg, and naïve-like T cells. B, Fold change in T-cell subsets following RACIM versus CIM. C, Cord diagram of the Jaccard similarity coefficient shows the relative number of common TCRs shared between CD4+ T-cell subsets following RACIM. D, Violin plots representing the expression of various activation and cytotoxicity markers in CD4+ T-cell subsets. E, CD4+ T cells expressing indicated genes across subsets and their corresponding average expression (size of dot indicates the percentage of cells in each subset; expression intensity is indicated by color). F, Pseudotime trajectory analysis of CD4_Tpex, CD4_Tex, and Th1 clusters identified by unsupervised single-cell analysis. G, Left, SPICE graphic representing flow-cytometric analysis of GzmB and cytokine production by CD4+ TCF1PD1+ TILs. Right, bar plots representing cytokine production by CD4+ TCF1PD-1+ TOX+ cells after PMA/ionomycin or anti-CD3/anti-CD28 TCR stimulation. H, Kaplan–Meier analysis of overall survival of RACIM-treated mice, depleted or not of CD4+ T cells. P values determined by a one-sided log-rank Mantel–Cox test. I, The percentage of CD8+ T cells expressing indicated genes across subsets and their corresponding average expression (as in E). J, Violin plots showing expression of Ifng, Gzmb, and Prf1 in CD8+ T cells following CIM vs. RACIM. K, Bar plots representing the most clonally expanded CD8+ T-cell clonotypes (by TCR-seq) following RACIM treatment (TCRs in all three tumors: #1; in individual tumors: #2–4). L, Cord diagram of the Jaccard similarity coefficient shows the relative number of common TCRs between CD8+ T-cell subsets following RACIM. M, Left, SPICE graphic representing flow cytometric analysis of GzmB and cytokine production by CD8+PD-1+TCF1 TILs. Right: bar plots representing cytokine production by CD8+ TCF1PD-1+TOX+ cells after PMA/ionomycin or anti-CD3/anti-CD28 TCR stimulation. N, Kaplan–Meier analysis of overall survival of RACIM-treated mice depleted or not of CD8+ T cells. P values were determined by a one-sided log-rank Mantel–Cox test. Data are representative of n = 3 biologically independent experiments (n = 5–10). *, P ≤ 0.05; **, P < 0.01; ***, P < 0.001; ****, P < 0.0001.
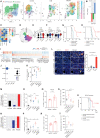
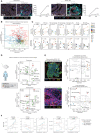
Figure 4. RACIM reprograms tumor APCs and enlists NKG2D as a key signal. A, UMAP plots of intratumoral myeloid cell scRNA-seq data (n = 3 tumors/treatment, n = 4 tumors pooled for control, all collected on day 5 of cycle 2). Left, reference map for all groups. Red, DCs; blue, monocytes; green, macrophages. Right, 29 myeloid states among groups. B, Fold change in myeloid cell subsets for RACIM versus CIM. C, Quantification of DC clusters among groups. D, Rose plot of differentially expressed genes corresponding to DC clusters among groups. E and F, Violin plots showing expression of Batf3 (E) and H2k1 and H2d1 (MHC-I; F) transcripts in cDC1 cells among groups. G and H, Kaplan–Meier analysis of control versus RACIM in Batf3−/− mice (G), and in wild-type (WT) mice (H) in the presence of fingolimod (FTY-720) treatment. P values were determined by a one-sided log-rank Mantel–Cox test. I, Heat map showing expression of the most representative genes for clusters 9, 19, and 21. Gene expression was normalized to median expression value per gene across all clusters shown in the heat map. J, Percentage of cells expressing Rae1, Ulbp1, H60b, and H60c, and average expression in the myeloid compartment by scRNA-seq (size of dot indicates the percentage of cells in each subset; expression level is indicated by color). K, RAE1 expression on intratumoral CD11b+CD11c+MHC-II+ cells determined by flow-cytometric analysis on day 5 of cycle 2. L, Left, mIF imaging reveals RAE1 expression (red) by CD11b+ cells (yellow; 20× magnification; DAPI nuclear counterstaining; representative of n = 5 mice/group). Right, number of CD11b+RAE+ cells per HPF plotted as mean ± SD; P was calculated using unpaired two-tailed Student t tests. M and N, The percentage of CD4+ and CD8+ exhausted T cells expressing NKG2D at the transcriptional (M and N, Klrk1 gene by scRNA-seq analysis) and protein levels (O and P, flow cytometry analysis) on day 5 of cycle 2. Q and R, The percentage of intratumoral Ki-67+proliferating CD4+TCF1+PD-1+ (Q) and CD8+TCF1−PD-1+ (R) cells upon RACIM on day 5 of cycle 2. S–T, NKG2D expression on intratumoral CD4+TCF1−PD-1+ (S) and CD8+TCF1−PD1+ (T) T cells determined by flow cytometry on day 5 of cycle 2 in control or RACIM or RACIM without ICB-treated tumors. U, RACIM survival with NKG2D blockade. P values were determined by a one-sided log-rank Mantel–Cox test. Data are representative of two to three independent experiments (n = 5–10 mice/group). Unless otherwise indicated, statistical analysis was performed using Student unpaired t test; error bars represent mean ± standard deviation. *, P ≤ 0.05; **, P < 0.01; ***, P < 0.001; ****, P < 0.0001.
Figure 4.
RACIM reprograms tumor APCs and enlists NKG2D as a key signal. A, UMAP plots of intratumoral myeloid cell scRNA-seq data (n = 3 tumors/treatment, n = 4 tumors pooled for control, all collected on day 5 of cycle 2). Left, reference map for all groups. Red, DCs; blue, monocytes; green, macrophages. Right, 29 myeloid states among groups. B, Fold change in myeloid cell subsets for RACIM versus CIM. C, Quantification of DC clusters among groups. D, Rose plot of differentially expressed genes corresponding to DC clusters among groups. E and F, Violin plots showing expression of Batf3 (E) and H2k1 and H2d1 (MHC-I; F) transcripts in cDC1 cells among groups. G and H, Kaplan–Meier analysis of control versus RACIM in Batf3−/− mice (G), and in wild-type (WT) mice (H) in the presence of fingolimod (FTY-720) treatment. P values were determined by a one-sided log-rank Mantel–Cox test. I, Heat map showing expression of the most representative genes for clusters 9, 19, and 21. Gene expression was normalized to median expression value per gene across all clusters shown in the heat map. J, Percentage of cells expressing Rae1, Ulbp1, H60b, and H60c, and average expression in the myeloid compartment by scRNA-seq (size of dot indicates the percentage of cells in each subset; expression level is indicated by color). K, RAE1 expression on intratumoral CD11b+CD11c+MHC-II+ cells determined by flow-cytometric analysis on day 5 of cycle 2. L, Left, mIF imaging reveals RAE1 expression (red) by CD11b+ cells (yellow; 20× magnification; DAPI nuclear counterstaining; representative of n = 5 mice/group). Right, number of CD11b+RAE+ cells per HPF plotted as mean ± SD; P was calculated using unpaired two-tailed Student t tests. M and N, The percentage of CD4+ and CD8+ exhausted T cells expressing NKG2D at the transcriptional (M and N, Klrk1 gene by scRNA-seq analysis) and protein levels (O and P, flow cytometry analysis) on day 5 of cycle 2. Q and R, The percentage of intratumoral Ki-67+proliferating CD4+TCF1+PD-1+ (Q) and CD8+TCF1PD-1+ (R) cells upon RACIM on day 5 of cycle 2. S–T, NKG2D expression on intratumoral CD4+TCF1PD-1+ (S) and CD8+TCF1PD1+ (T) T cells determined by flow cytometry on day 5 of cycle 2 in control or RACIM or RACIM without ICB-treated tumors. U, RACIM survival with NKG2D blockade. P values were determined by a one-sided log-rank Mantel–Cox test. Data are representative of two to three independent experiments (n = 5–10 mice/group). Unless otherwise indicated, statistical analysis was performed using Student unpaired t test; error bars represent mean ± standard deviation. *, P ≤ 0.05; **, P < 0.01; ***, P < 0.001; ****, P < 0.0001.
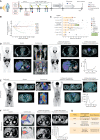
Figure 5. Low-dose irradiation plus ICB induces responses in advanced human immune-desert tumors. A, Therapeutic schema of the phase I RACIN study. B, Spider plot depicts the percentage change in the sum of targeted irradiated metastases compared with baseline. C, Swimmer plot depicts patients' response to RACIN over time; each bar, one patient; light orange, time on combination treatment; green, time on maintenance treatment; cohort 1: 0.5 Gy, cohort 2: 1 Gy; orange triangles, completed treatment; asterisk, treatment termination due to toxicity or progression; black circles, death. iRECIST v1.1 was used to indicate PR (iPR, green diamond), SD (iSD, light blue square), confirmed progressive disease (iCPD, maroon circle), or unconfirmed (iUPD, maroon empty circle). D, 68Ga-PSMA PET/CT images of irradiated tumors (white arrows) before and after treatment from a patient with metastatic castration-resistant prostate cancer having SD according to Prostate Cancer Clinical Trials Working Group 3 (PCWG3) but an important response on 68Ga-PSMA PET/CT images. Changes in PSA tumor marker. Progression observed outside the irradiated areas 24 weeks after treatment initiation. E, 18FDG-PET/CT images of irradiated tumors (white arrows) before and after treatment from a patient with high-grade serous ovarian carcinoma having by iRECIST iPD, but an important response on 18FDG-PET/CT imaging. Changes in the CA125 tumor marker. Progression outside the irradiated areas 24 weeks after treatment initiation. F, CT images of irradiated tumors (white arrows and circles) before and after treatment from a patient with gallbladder cancer having PR by iRECIST and 70% reduction from baseline in targeted irradiated lesions. Changes in the CA 19-9 tumor marker. Progression outside the irradiated areas 17 weeks after treatment initiation. G, Anatomic location of irradiated target and nontargeted lesions in responder patients and the anatomical location of tumor recurrence (D2, second dorsal vertebrae; D12, dorsal 12; R, right; L, left; LN, lymph node; liver segments identified with roman numbers III, IV, and V).
Figure 5.
Low-dose irradiation plus ICB induces responses in advanced human immune-desert tumors. A, Therapeutic schema of the phase I RACIN study. B, Spider plot depicts the percentage change in the sum of targeted irradiated metastases compared with baseline. C, Swimmer plot depicts patients' response to RACIN over time; each bar, one patient; light orange, time on combination treatment; green, time on maintenance treatment; cohort 1: 0.5 Gy, cohort 2: 1 Gy; orange triangles, completed treatment; asterisk, treatment termination due to toxicity or progression; black circles, death. iRECIST v1.1 was used to indicate PR (iPR, green diamond), SD (iSD, light blue square), confirmed progressive disease (iCPD, maroon circle), or unconfirmed (iUPD, maroon empty circle). D,68Ga-PSMA PET/CT images of irradiated tumors (white arrows) before and after treatment from a patient with metastatic castration-resistant prostate cancer having SD according to Prostate Cancer Clinical Trials Working Group 3 (PCWG3) but an important response on 68Ga-PSMA PET/CT images. Changes in PSA tumor marker. Progression observed outside the irradiated areas 24 weeks after treatment initiation. E,18FDG-PET/CT images of irradiated tumors (white arrows) before and after treatment from a patient with high-grade serous ovarian carcinoma having by iRECIST iPD, but an important response on 18FDG-PET/CT imaging. Changes in the CA125 tumor marker. Progression outside the irradiated areas 24 weeks after treatment initiation. F, CT images of irradiated tumors (white arrows and circles) before and after treatment from a patient with gallbladder cancer having PR by iRECIST and 70% reduction from baseline in targeted irradiated lesions. Changes in the CA 19-9 tumor marker. Progression outside the irradiated areas 17 weeks after treatment initiation. G, Anatomic location of irradiated target and nontargeted lesions in responder patients and the anatomical location of tumor recurrence (D2, second dorsal vertebrae; D12, dorsal 12; R, right; L, left; LN, lymph node; liver segments identified with roman numbers III, IV, and V).
Figure 6. Effect of low-dose irradiation on tumor immune landscape. A, TILs before and after LDRT revealed by mIF imaging in two representative responding tumors. Left, representative mIF images (20× magnification; CK, pancytokeratin); right, quantification of CD4+ and CD8+ cells. B, Scatter plot showing differential gene expression between baseline and post-irradiation biopsy in responding (x-axis) versus nonresponding tumors (y-axis). The log2 of the fold change in median gene expression (log2FC) is shown (positive values indicate upregulation post-LDRT). Genes displaying a significant change (unadjusted P < 0.05) are color-coded as shown in the legend. C, Line plots showing the progression of immune gene signature scores from baseline to post-LDRT biopsies in responding versus nonresponding tumors. D, Scatter plot showing differential immune signature score analysis between baseline and post-irradiation biopsy in responding human tumors (x-axis) versus responding mouse (RACIM) ID8 tumors (y-axis; top) and between nonresponding human versus nonresponding (CIM) mouse tumors (bottom). E, NanoString GeoMx analysis of intraepithelial tumor immune infiltrates vs. tumor stroma immune infiltrates in responding versus nonresponding tumors. The log2 of the fold change in the median of the signature score (log2FC) is shown. Immune signature score displaying a significant change (unadjusted P < 0.05) is color-coded as depicted in the legend of B. F, Comparison of TCR CDR3 diversity by clonality, Shannon diversity entropy, Gini coefficient, richness, and shared frequency in three patients with responding tumors.
Figure 6.
Effect of low-dose irradiation on tumor immune landscape. A, TILs before and after LDRT revealed by mIF imaging in two representative responding tumors. Left, representative mIF images (20× magnification; CK, pancytokeratin); right, quantification of CD4+ and CD8+ cells. B, Scatter plot showing differential gene expression between baseline and post-irradiation biopsy in responding (x-axis) versus nonresponding tumors (y-axis). The log2 of the fold change in median gene expression (log2FC) is shown (positive values indicate upregulation post-LDRT). Genes displaying a significant change (unadjusted P < 0.05) are color-coded as shown in the legend. C, Line plots showing the progression of immune gene signature scores from baseline to post-LDRT biopsies in responding versus nonresponding tumors. D, Scatter plot showing differential immune signature score analysis between baseline and post-irradiation biopsy in responding human tumors (x-axis) versus responding mouse (RACIM) ID8 tumors (y-axis; top) and between nonresponding human versus nonresponding (CIM) mouse tumors (bottom). E, NanoString GeoMx analysis of intraepithelial tumor immune infiltrates vs. tumor stroma immune infiltrates in responding versus nonresponding tumors. The log2 of the fold change in the median of the signature score (log2FC) is shown. Immune signature score displaying a significant change (unadjusted P < 0.05) is color-coded as depicted in the legend of B. F, Comparison of TCR CDR3 diversity by clonality, Shannon diversity entropy, Gini coefficient, richness, and shared frequency in three patients with responding tumors.

Comment in

  • Cancer Discov. 12:1.
  • Cancer Discov. 12:1.

Similar articles

Cited by

References

    1. Tumeh PC, Harview CL, Yearley JH, Shintaku IP, Taylor EJ, Robert Let al. . PD1 blockade induces responses by inhibiting adaptive immune resistance. Nature 2014;515:568–71. - PMC - PubMed
    1. Herbst RS, Soria JC, Kowanetz M, Fine GD, Hamid O, Gordon MSet al. . Predictive correlates of response to the anti-PD-L1 antibody MPDL3280A in cancer patients. Nature 2014;515:563–7. - PMC - PubMed
    1. Herrera FG, Bourhis J, Coukos G. Radiotherapy combination opportunities leveraging immunity for the next oncology practice. CA Cancer J Clin 2017;67:65–85. - PubMed
    1. Formenti SC, Rudqvist NP, Golden E, Cooper B, Wennerberg E, Lhuillier Cet al. . Radiotherapy induces responses of lung cancer to CTLA4 blockade. Nat Med 2018;24:1845–51. - PMC - PubMed
    1. Deng L, Liang H, Xu M, Yang X, Burnette B, Arina Aet al. . STING-dependent cytosolic DNA sensing promotes radiation-induced type I interferon-dependent antitumor immunity in immunogenic tumors. Immunity 2014;41:843–52. - PMC - PubMed

Publication types