

Comparison of the antiremodeling effects of losartan and mirabegron in a rat model of uremic cardiomyopathy
- PMID: 34471171
- PMCID: PMC8410807
- DOI: 10.1038/s41598-021-96815-5
Comparison of the antiremodeling effects of losartan and mirabegron in a rat model of uremic cardiomyopathy
Abstract
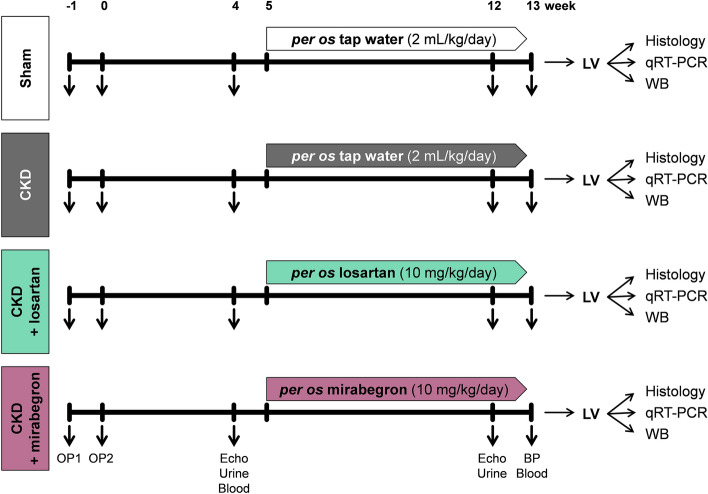
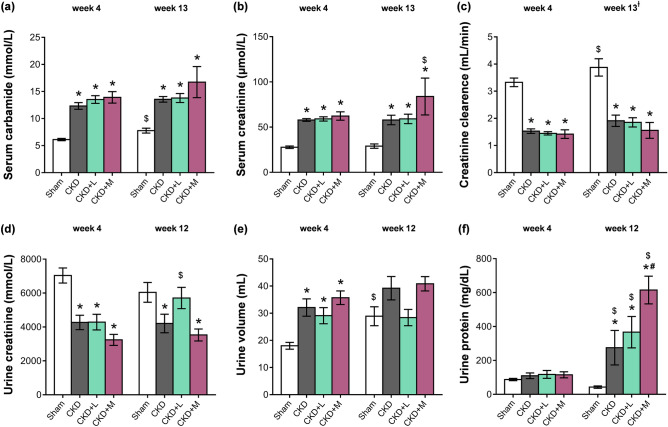
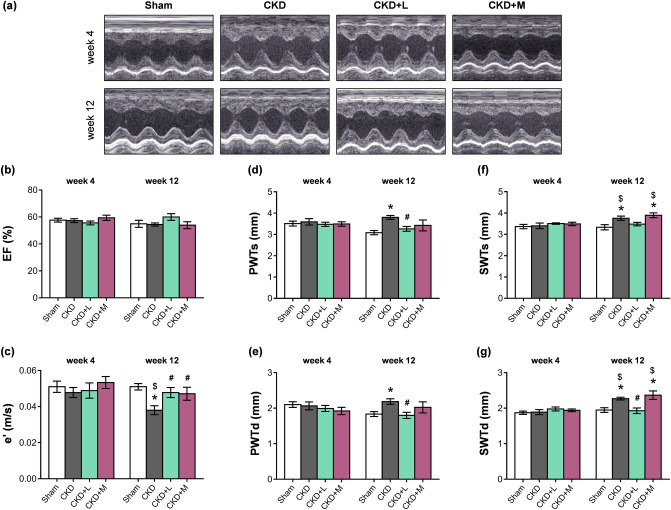
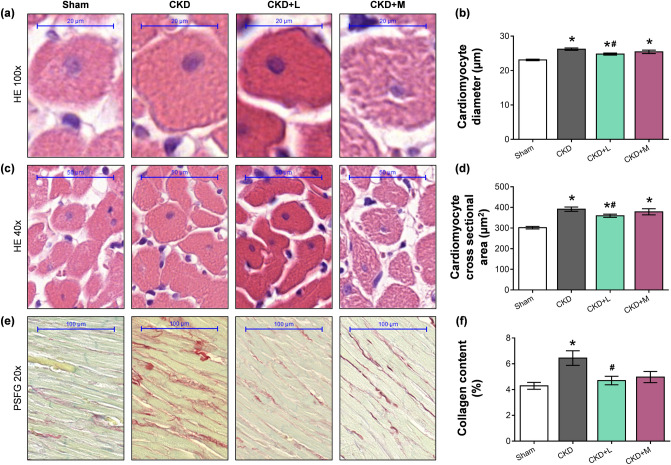
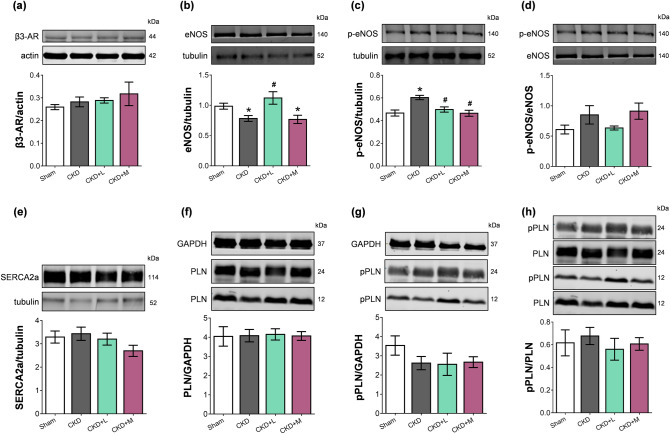
Uremic cardiomyopathy is characterized by diastolic dysfunction (DD), left ventricular hypertrophy (LVH), and fibrosis. Angiotensin-II plays a major role in the development of uremic cardiomyopathy via nitro-oxidative and inflammatory mechanisms. In heart failure, the beta-3 adrenergic receptor (β3-AR) is up-regulated and coupled to endothelial nitric oxide synthase (eNOS)-mediated pathways, exerting antiremodeling effects. We aimed to compare the antiremodeling effects of the angiotensin-II receptor blocker losartan and the β3-AR agonist mirabegron in uremic cardiomyopathy. Chronic kidney disease (CKD) was induced by 5/6th nephrectomy in male Wistar rats. Five weeks later, rats were randomized into four groups: (1) sham-operated, (2) CKD, (3) losartan-treated (10 mg/kg/day) CKD, and (4) mirabegron-treated (10 mg/kg/day) CKD groups. At week 13, echocardiographic, histologic, laboratory, qRT-PCR, and Western blot measurements proved the development of uremic cardiomyopathy with DD, LVH, fibrosis, inflammation, and reduced eNOS levels, which were significantly ameliorated by losartan. However, mirabegron showed a tendency to decrease DD and fibrosis; but eNOS expression remained reduced. In uremic cardiomyopathy, β3-AR, sarcoplasmic reticulum ATPase (SERCA), and phospholamban levels did not change irrespective of treatments. Mirabegron reduced the angiotensin-II receptor 1 expression in uremic cardiomyopathy that might explain its mild antiremodeling effects despite the unchanged expression of the β3-AR.
© 2021. The Author(s).
Conflict of interest statement
Single-Cell Technologies Ltd., Hungary, developed the Biology Image Analysis Software (BIAS). P.H. is the CEO, A.K. is a software architect, and F. K is a software engineer at Single-Cell Technologies Ltd.
Figures
Similar articles
-
Investigation of the Antiremodeling Effects of Losartan, Mirabegron and Their Combination on the Development of Doxorubicin-Induced Chronic Cardiotoxicity in a Rat Model.Int J Mol Sci. 2022 Feb 16;23(4):2201. doi: 10.3390/ijms23042201. Int J Mol Sci. 2022. PMID: 35216317 Free PMC article.
-
Role of the kisspeptin-KISS1R axis in the pathogenesis of chronic kidney disease and uremic cardiomyopathy.Geroscience. 2024 Apr;46(2):2463-2488. doi: 10.1007/s11357-023-01017-8. Epub 2023 Nov 21. Geroscience. 2024. PMID: 37987885 Free PMC article.
-
Antihypertensive and renal protective effects of renin-angiotensin system blockade in uremic rats treated with erythropoietin.Am J Hypertens. 2006 Dec;19(12):1286-92. doi: 10.1016/j.amjhyper.2006.06.019. Am J Hypertens. 2006. PMID: 17161776
-
Mirabegron, a β₃-adrenoceptor agonist for the potential treatment of urinary frequency, urinary incontinence or urgency associated with overactive bladder.IDrugs. 2010 Oct;13(10):713-22. IDrugs. 2010. PMID: 20878594 Review.
-
Sodium potassium adenosine triphosphatase (Na/K-ATPase) as a therapeutic target for uremic cardiomyopathy.Expert Opin Ther Targets. 2017 May;21(5):531-541. doi: 10.1080/14728222.2017.1311864. Epub 2017 Apr 3. Expert Opin Ther Targets. 2017. PMID: 28338377 Free PMC article. Review.
Cited by
-
Investigation of the Antiremodeling Effects of Losartan, Mirabegron and Their Combination on the Development of Doxorubicin-Induced Chronic Cardiotoxicity in a Rat Model.Int J Mol Sci. 2022 Feb 16;23(4):2201. doi: 10.3390/ijms23042201. Int J Mol Sci. 2022. PMID: 35216317 Free PMC article.
-
β3 adrenoceptor agonist mirabegron protects against right ventricular remodeling and drives Drp1 inhibition.Cardiovasc Diagn Ther. 2022 Dec;12(6):815-827. doi: 10.21037/cdt-22-274. Cardiovasc Diagn Ther. 2022. PMID: 36605081 Free PMC article.
-
The kisspeptin-1 receptor antagonist peptide-234 aggravates uremic cardiomyopathy in a rat model.Sci Rep. 2023 Aug 28;13(1):14046. doi: 10.1038/s41598-023-41037-0. Sci Rep. 2023. PMID: 37640761 Free PMC article.
-
Investigation of the Antihypertrophic and Antifibrotic Effects of Losartan in a Rat Model of Radiation-Induced Heart Disease.Int J Mol Sci. 2021 Nov 30;22(23):12963. doi: 10.3390/ijms222312963. Int J Mol Sci. 2021. PMID: 34884782 Free PMC article.
-
Chronic kidney disease may evoke anxiety by altering CRH expression in the amygdala and tryptophan metabolism in rats.Pflugers Arch. 2024 Feb;476(2):179-196. doi: 10.1007/s00424-023-02884-y. Epub 2023 Nov 22. Pflugers Arch. 2024. PMID: 37989901 Free PMC article.
References
Publication types
MeSH terms
Substances
LinkOut - more resources
Full Text Sources
Medical
Research Materials
