Comparative Study
. 2021 Oct 20;41(42):8790-8800.
doi: 10.1523/JNEUROSCI.1103-21.2021. Epub 2021 Sep 1.

Posterodorsal Medial Amygdala Regulation of Female Social Behavior: GABA versus Glutamate Projections

Affiliations
Comparative Study

Posterodorsal Medial Amygdala Regulation of Female Social Behavior: GABA versus Glutamate Projections

Caroline S Johnson et al. J Neurosci. .

Abstract

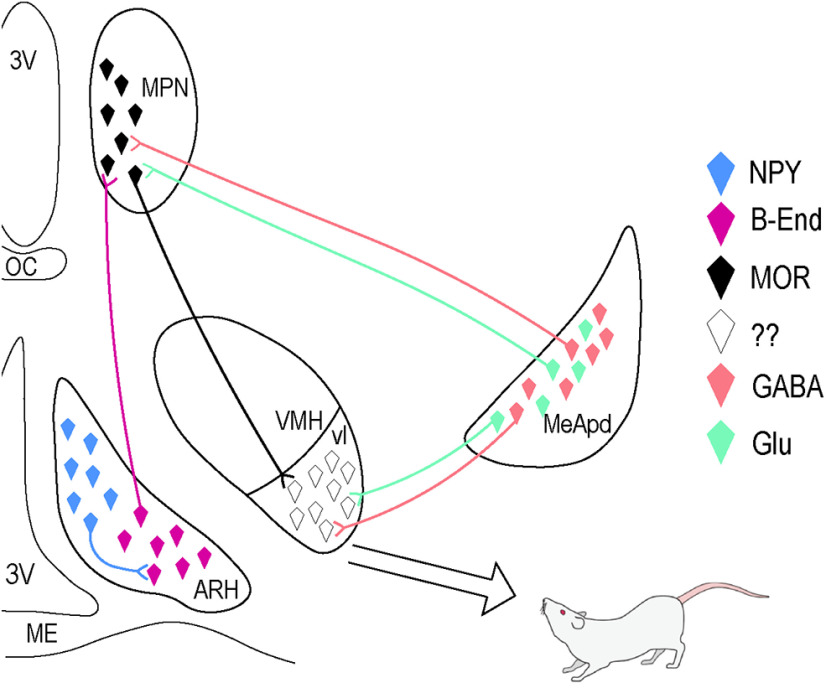
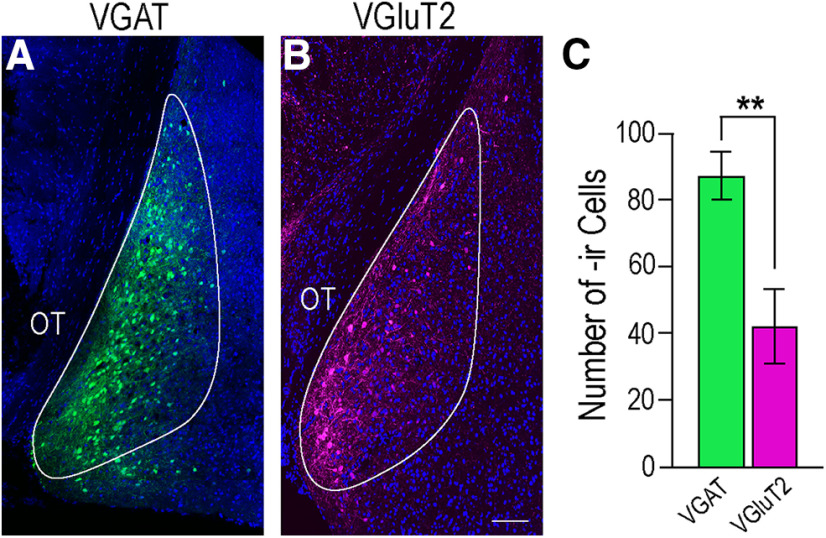
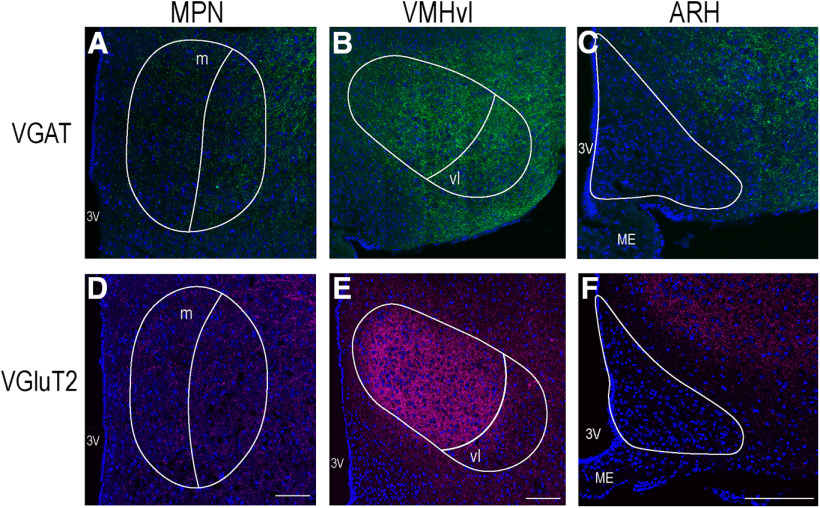
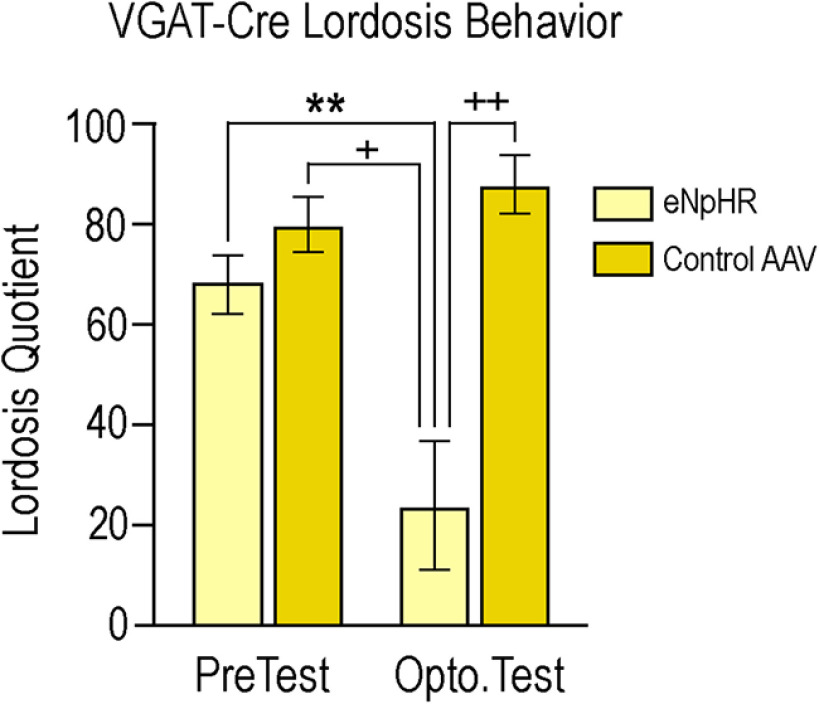
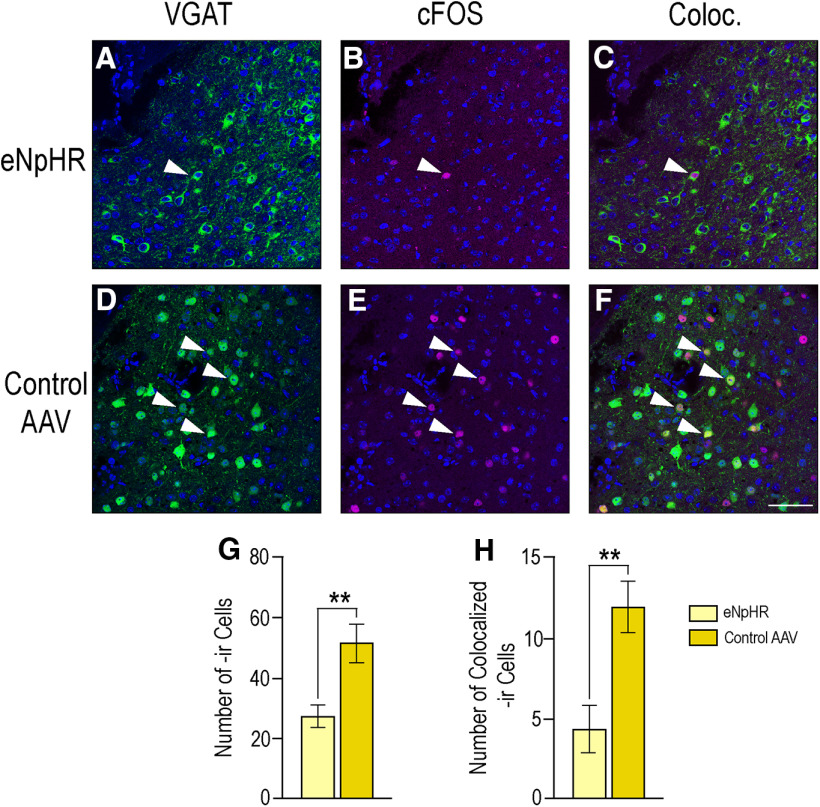
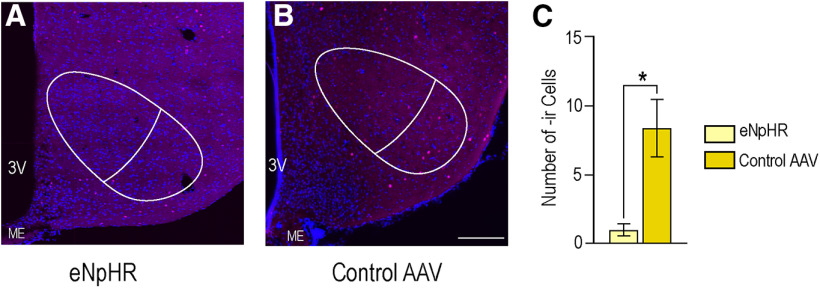
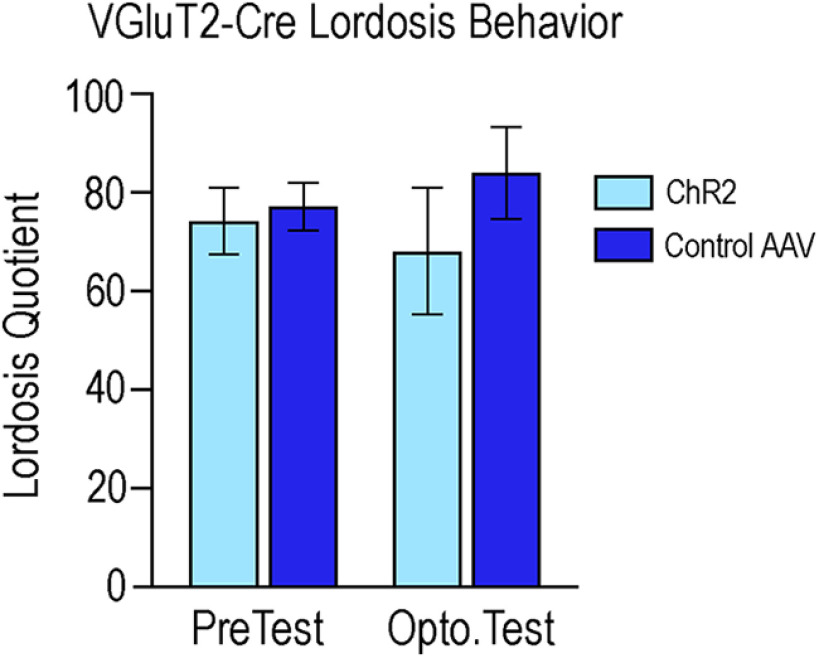
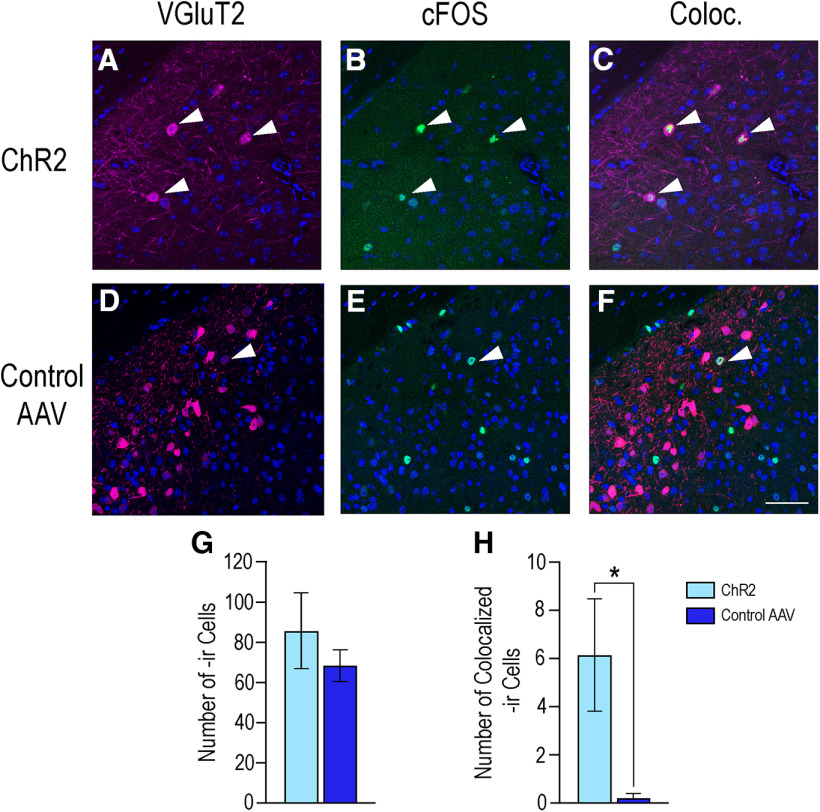
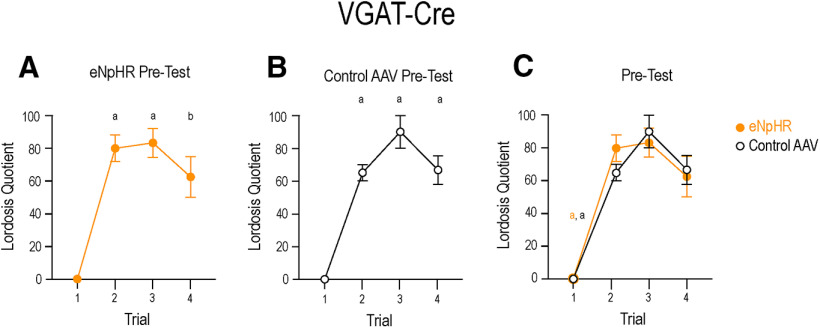
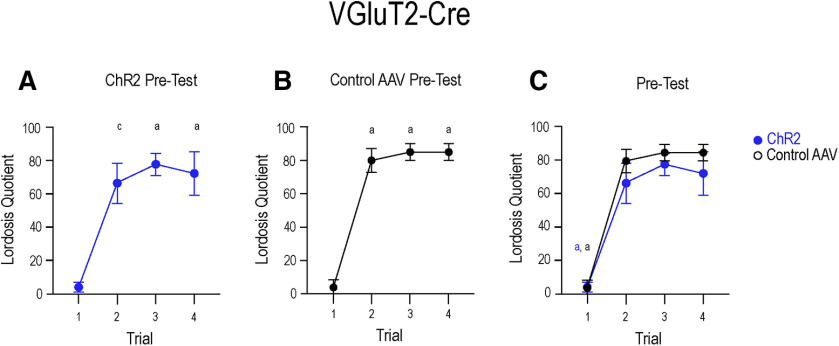
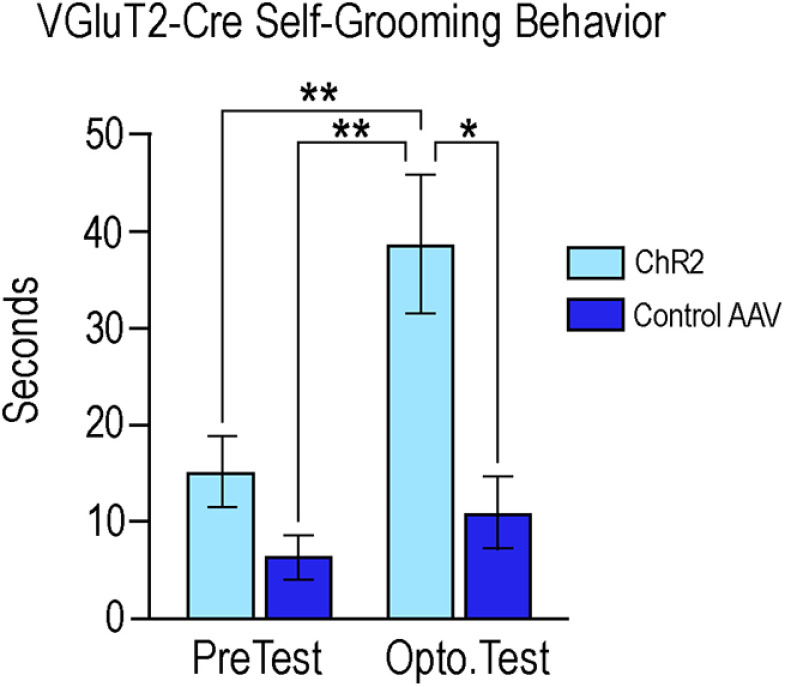
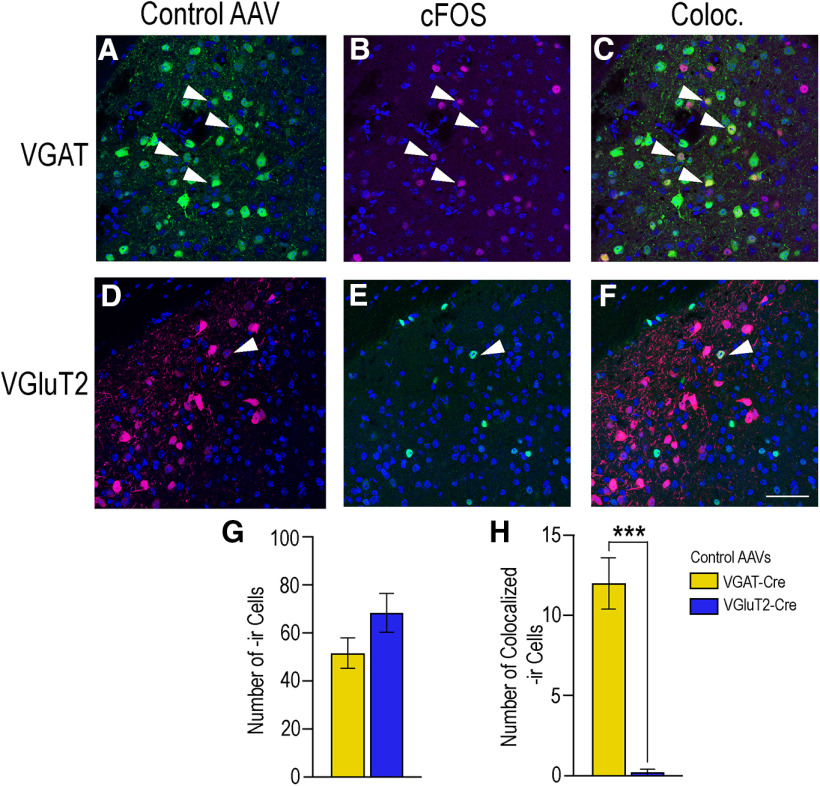
Social behaviors, including reproductive behaviors, often display sexual dimorphism. Lordosis, the measure of female sexual receptivity, is one of the most apparent sexually dimorphic reproductive behaviors. Lordosis is regulated by estrogen and progesterone (P4) acting within a hypothalamic-limbic circuit, consisting of the arcuate, medial preoptic, and ventromedial nuclei of the hypothalamus. Social cues are integrated into the circuit through the amygdala. The posterodorsal part of the medial amygdala (MeApd) is involved in sexually dimorphic social and reproductive behaviors, and sends projections to hypothalamic neuroendocrine regions. GABA from the MeApd appears to facilitate social behaviors, while glutamate may play the opposite role. To test these hypotheses, adult female vesicular GABA transporter (VGAT)-Cre and vesicular glutamate transporter 2 (VGluT2)-Cre mice were transfected with halorhodopsin (eNpHR)-expressing or channelrhodopsin-expressing adeno-associated viruses (AAVs), respectively, in the MeApd. The lordosis quotient (LQ) was measured following either photoinhibition of VGAT or photoexcitation of VGluT2 neurons, and brains were assessed for c-Fos immunohistochemistry (IHC). Photoinhibition of VGAT neurons in the MeApd decreased LQ, and decreased c-Fos expression within VGAT neurons, within the MeApd as a whole, and within the ventrolateral part of the ventromedial nucleus (VMHvl). Photoexcitation of VGluT2 neurons did not affect LQ, but did increase time spent self-grooming, and increased c-Fos expression within VGluT2 neurons in the MeApd. Neither condition altered c-Fos expression in the medial preoptic nucleus (MPN) or the arcuate nucleus (ARH). These data support a role for MeApd GABA in the facilitation of lordosis. Glutamate from the MeApd does not appear to be directly involved in the lordosis circuit, but appears to direct behavior away from social interactions.SIGNIFICANCE STATEMENT Lordosis, the measure of female sexual receptivity, is a sexually dimorphic behavior regulated within a hypothalamic-limbic circuit. Social cues are integrated through the amygdala, and the posterodorsal part of the medial amygdala (MeApd) is involved in sexually dimorphic social and reproductive behaviors. Photoinhibition of GABAergic neurons in the MeApd inhibited lordosis, while photoactivation of glutamate neurons had no effect on lordosis, but increased self-grooming. These data support a role for MeApd GABA in the facilitation of social behaviors and MeApd glutamate projections in anti-social interactions.


Figures

Figure 1.
Figure 1.
Hypothalamic-limbic lordosis circuit. Estradiol acts initially on neuropeptide Y (NPY) neurons in the ARH, which project to and activate POMC/β-endorphin (β-End) neurons. POMC/β-End neurons project to neurons containing μ-opioid receptor (MOR) in the MPN. The release of β-End onto MOR, a GPCR, activates and internalizes these receptors. This activation temporarily inhibits lordosis. Neurons from the MPN reach the VMHvl, the final integrative site in the hypothalamus. Inputs from posterodorsal part of the medial amygdala (MeApd) are GABAergic projection neurons, and also reach the VMHvl to integrate social information with the hormonal input and innervate the MPN. Glutamatergic neurons innervate the MPN and VMHvl as well. 3V, third ventricle; ME, median eminence; OC, optic chiasm. Adapted from Johnson et al. (2020).
Figure 2.
Figure 2.
VGAT and VGluT2 expression in the MeApd. Cells expressing either VGAT (green, A) or VGluT2 (magenta, B) were found medially in the MeApd. DAPI counterstain is indicated in blue, the MeApd is outlined in white in each image. C, More neurons expressed VGAT (87.20 ± 7.17, green bar) compared with VGluT2 (42.00 ± 11.22, magenta bar; p = 0.009). Values expressed as mean ± SEM; **p < 0.01. OT, optic tract. Scale bar: 100 µm.
Figure 3.
Figure 3.
Innervation of reproductively relevant hypothalamic nuclei. Both GABAergic (green, A–C) and glutamatergic (magenta, D–F) fibers originating from the MeApd innervate the MPN (A, D) and the VMHvl (B, E). The ARH is largely devoid of either GABAergic (C) or glutamatergic (F) innervation from the MeApd. GABAergic innervation to the MPN and VMH is fairly equal between subdivisions of the nuclei (A, B). Glutamate appears to innervate to the VMHvl to a lesser extent than the rest of the nucleus (E). DAPI counterstain in blue, neuroanatomical nuclei outlined in white. 3V, third ventricle; m, medial MPN; ME, median eminence; vl, ventromedial VMH. Scale bars: 100 µm.
Figure 4.
Figure 4.
Photoinhibition of eNpHR-expressing VGAT neurons attenuates lordosis. Photoinhibition of eNpHR (light yellow bars) significantly reduced LQ as compared with the initial pre-test condition (p = 0.009), as well as the pre-test (p = 0.001) and photoinhibition condition (p = 0.0003) in mice that received the control virus (dark yellow bars). Two-way ANOVA followed by Tukey's multiple comparisons post hoc test indicated a significant interaction (F(1,16) = 10.25, p = 0.006), and a main effect of viral treatment (F(1,16) = 21.89, p = 0.0003) and photoinhibition (F(1,16) = 4.911, p = 0.04). Values expressed as mean ± SEM; **p < 0.01, +p < 0.001, ++p < 0.0005.
Figure 5.
Figure 5.
Photoinhibition of eNpHR-expressing VGAT neurons decreases overall c-Fos-ir and c-Fos colocalization with VGAT neurons in the MeApd. Photomicrographs in the top row show the expression of VGAT (A), c-Fos (B), and the merge of these two (Coloc., C) in mice that received eNpHR. The bottom row shows the expression of VGAT (D), c-Fos (E), and merge of the two (Coloc., F) in mice that received the control virus. VGAT-ir depicted in green, c-Fos-ir in magenta, DAPI counterstain in blue. Colocalization appears in yellow. Arrows indicate colocalization of immunoreactivity within specific cells in the MeApd. G, Graph indicates that the total number of cells expressing c-Fos-ir was significantly attenuated in response to photoinhibition in mice that received eNpHR (27.4 ± 3.7; light yellow bars) compared with those mice that received the control virus (51.8 ± 6.4; dark yellow bars; p = 0.01). H, Graph shows that colocalization of c-Fos and VGAT was also significantly attenuated in the MeApd in mice that received eNpHR (4.4 ± 1.5) as compared with those mice that received the control virus (12.0 ±1.6; p = 0.008). Values expressed as mean ± SEM; **p < 0.01. Scale bar: 25 µm.
Figure 6.
Figure 6.
Photoinhibition of eNpHR-expressing VGAT neurons in the MeApd decreases c-Fos expression in the VMHvl. The number of cells expressing c-Fos-ir in the VMHvl was significantly reduced following photoinhibition of eNpHR (1.0 ± 0.4; A) as compared with the control virus (8.4 ± 2.1; p = 0.02; B). c-Fos-ir, magenta; DAPI, blue. Neuroanatomical outlines in white. C, In graph, light yellow bars represent mice that received eNpHR, dark yellow bars represent mice that received the control virus. Values expressed as mean ± SEM; *p < 0.05. Scale bar: 100 µm.
Figure 7.
Figure 7.
Photoexcitation of ChR2-expressing VGluT2 neurons did not affect lordosis behavior. No differences in LQ were detected in any condition, determined by a two-way ANOVA followed by Tukey's multiple comparisons post hoc test. Photoexcitation of ChR2-expressing VGluT2 neurons (light blue bars) in the MeApd did not result in differences between any condition, including no interaction (F(1,20) = 0.445, p = 0.51), main effect of viral treatment (F(1,20) = 0.936, p = 0.35), or photoexcitation (F(1,20) = 0.001, p = 0.97). Mice that received the control virus are represented with dark blue bars.
Figure 8.
Figure 8.
Photoexcitation of ChR2-expressing VGluT2 neurons did not alter overall c-Fos-ir but did reduce colocalization with VGluT2 neurons. Photomicrographs in the top row are of the expression of VGluT2 (A), c-Fos (B), and the colocalization of the two (Coloc., C) in the MeApd in mice that received ChR2. The bottom row shows the expression of VGluT2 (D), c-Fos (E), and colocalization (Coloc., F) in the MeApd of mice that received the control virus. VGluT2-ir is depicted in magenta, c-Fos-ir in green, DAPI counterstain in blue. Arrows indicate colocalization of immunoreactivity within specific cells in the MeApd. G, Graph shows that there was no difference in total c-Fos expression between mice that received ChR2 (85.7 ± 18.9; light blue bars) and those that received the control virus (68.6 ± 8.07, p = 0.49; dark blue bars). However, photoexcitation of ChR2 (graph H) resulted in an increase of c-Fos expression within VGluT2 neurons (6.14 ± 2.32) as compared with the control mice (0.20 ± 0.20; p = 0.04). Values expressed as mean ± SEM; *p < 0.05. Scale bar: 25 µm.
Figure 9.
Figure 9.
All VGAT-Cre mice displayed a progressive increase in LQ. Mice transfected with eNpHR (A) or the control virus (B) display a progressive increase in LQ score from the first sexual experience. A between-subjects one-way ANOVA indicated a significant effect of sexual experience on the LQ scores of mice that received eNpHR (F(3,17) = 32.10; p < 0.0001). The LQ score of trial 1 was significantly lower than trials 2–4. There were no differences in LQ scores between trials 2–4. Similarly, repeated sexual experience resulted in an increase in LQ scores displayed by mice that received the control virus (F(3,9) = 75.25; p < 0.0001). Again, trial 1 was significantly lower than trials 2–4, while there were no difference in LQ scores between trials 2, 3, and 4. C, A two-way ANOVA indicated that trials 2–4 were not different between the groups. Trial 1 of the eNpHR group was significantly less than trial 2, 3, or 4 of both the eNpHR group and the control group (yellow a). Trial 1 of the control group was significantly less than trial 2, 3, or 4 of both the control group and the eNpHR group (black a). There was no difference between the first trial of either group. Yellow indicates eNpHR group, black indicates control AAV group. Data presented as mean ± SEM; ap < 0.0001, bp = 0.0001.
Figure 10.
Figure 10.
VGluT2-Cre mice displayed a progressive increase in LQ. Mice transfected with ChR2 (A) or the control virus (B) display a progressive increase in LQ score from the first sexual experience. A between-subjects one-way ANOVA indicated a significant effect of sexual experience on the LQ scores of mice that received ChR2 (F(3,14) = 23.42; p < 0.0001). As seen with the VGAT experiment, the LQ score displayed in trial 1 was significantly lower than trials 2–4. There were no differences in LQ scores between trials 2, 3, and 4. Again, repeated sexual experience resulted in an increase in LQ scores in mice that received the control virus (F(3,11) = 60.24; p < 0.0001). Trial 1 was significantly lower than trials 2–4, while there were no difference in LQ scores between trials 2, 3, and 4. C, A two-way ANOVA indicated that trials 2–4 were not different between the groups. Mice that received ChR2 displayed significantly lower LQ scores in trial 1 than in trial 2, 3, or 4 of both the ChR2 group and the control group (blue a). Trial 1 of the control group was significantly less than trial 2, 3, or 4 of both the control group and the ChR2 group (black a). There was no difference between the first trial of either group. Blue indicates ChR2 group, black indicates control AAV group. Data presented as mean ± SEM; ap < 0.0001, cp = 0.0005.
Figure 11.
Figure 11.
Photoexcitation of ChR2-expressing VGluT2 neurons promotes self-grooming. Photoexcitation of ChR2-expressing VGluT2 (light blue bars) neurons significantly increased the total time in seconds that mice spent self-grooming (38.62 ± 7.20) as compared with the pre-test condition (15.10 ± 3.67; p = 0.006), as well as to both the pre-test (6.54 ± 2.12; p = 0.003) and photoexcitation test (10.92 ± 3.80; p = 0.01) of the control group (dark blue bars). A two-way ANOVA followed by Tukey's multiple comparisons post hoc test indicated no significant interaction (F(1,80) = 2.33, p = 0.13), but a main effect of viral treatment (F(1,80) = 8.54, p = 0.005) and photoexcitation (F(1,80) = 5.02, p = 0.02). Values expressed as mean ± SEM; *p < 0.05, **p < 0.01.
Figure 12.
Figure 12.
Activation of VGAT and VGluT2 neurons in the MeApd during sexual receptivity. Images in the top row show VGAT (green, A), c-Fos (magenta, B), and the colocalization of the two (C) in the MeApd. Images in the bottom row show VGluT2 (magenta, D), c-Fos (green, E), and colocalization (F). In sexually receptive control mice, c-Fos expression in the MeApd was not different between control VGAT-Cre mice (51.80 ± 6.35; B) and control VGluT2-Cre mice (68.60 ± 8.07; D). In these control mice, c-Fos colocalization was significantly greater in VGAT-Cre mice (12.00 ± 1.61; G) than in VGluT2-Cre mice (0.20 ± 0.20, p = 0.002; H). DAPI counterstain in blue. Arrows indicate colocalization of immunoreactivity within cells in the MeApd. Yellow bars represent VGAT-Cre, blue bars represent VGluT2-Cre. Values expressed as mean ± SEM; ***p < 0.005. Scale bar: 25 µm.

Similar articles

Cited by

References

    1. Beach FA (1948) Hormones and behavior. New York: Paul B Hoeber.
    1. Bian X (2013) Physiological and morphological characterization of GABAergic neurons in the medial amygdala. Brain Res 1509:8–19. 10.1016/j.brainres.2013.03.012 - DOI - PubMed
    1. Bian X, Yanagawa Y, Chen WR, Luo M (2008) Cortical-like functional organization of the pheromone-processing circuits in the medial amygdala. J Neurophysiol 99:77–86. 10.1152/jn.00902.2007 - DOI - PubMed
    1. Blundell J, Blaiss CA, Etherton MR, Espinosa F, Tabuchi K, Walz C, Bolliger MF, Südhof TC, Powell CM (2010) Neuroligin-1 deletion results in impaired spatial memory and increased repetitive behavior. J Neurosci 30:2115–2129. 10.1523/JNEUROSCI.4517-09.2010 - DOI - PMC - PubMed
    1. Bullitt E (1990) Expression of c-fos-like protein as a marker for neuronal activity following noxious stimulation in the rat. J Comp Neurol 296:517–530. 10.1002/cne.902960402 - DOI - PubMed

Publication types

MeSH terms

Substances