Fatty Acid Metabolism-Related lncRNAs Are Potential Biomarkers for Predicting the Overall Survival of Patients With Colorectal Cancer
- PMID: 34458145
- PMCID: PMC8386021
- DOI: 10.3389/fonc.2021.704038
Fatty Acid Metabolism-Related lncRNAs Are Potential Biomarkers for Predicting the Overall Survival of Patients With Colorectal Cancer
Erratum in
-
Corrigendum: Fatty Acid Metabolism-Related lncRNAs Are Potential Biomarkers for Predicting the Overall Survival of Patients With Colorectal Cancer.Front Oncol. 2022 Jan 5;11:831864. doi: 10.3389/fonc.2021.831864. eCollection 2021. Front Oncol. 2022. PMID: 35071024 Free PMC article.
Abstract
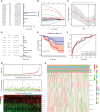
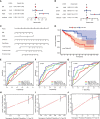
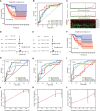
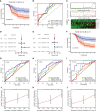
Abnormal metabolism, including abnormal fatty acid metabolism, is an emerging hallmark of cancer. The current study sought to investigate the potential prognostic value of fatty acid metabolism-related long noncoding RNAs (lncRNAs) in colorectal cancer (CRC). To this end, we obtained the gene expression data and clinical data of patients with CRC from The Cancer Genome Atlas (TCGA) database. Through gene set variation analysis (GSVA), we found that the fatty acid metabolism pathway was related to the clinical stage and prognosis of patients with CRC. After screening differentially expressed RNAs, we constructed a fatty acid metabolism-related competing endogenous RNA (ceRNA) network based on the miRTarBase, miRDB, TargetScan, and StarBase databases. Next, eight fatty acid metabolism-related lncRNAs included in the ceRNA network were identified to build a prognostic signature with Cox and least absolute shrinkage and selection operator (LASSO) regression analyses, and a nomogram was established based on the lncRNA signature and clinical variables. The signature and nomogram were further validated by Kaplan-Meier survival analysis, Cox regression analysis, calibration plots, receiver operating characteristic (ROC) curves, decision curve analysis (DCA). Besides, the TCGA internal and the quantitative real-time polymerase chain reaction (qRT-PCR) external cohorts were applied to successfully validate the robustness of the signature and nomogram. Finally, in vitro assays showed that knockdown of prognostic lncRNA TSPEAR-AS2 decreased the triglyceride (TG) content and the expressions of fatty acid synthase (FASN) and acetyl-CoA carboxylase 1 (ACC1) in CRC cells, which indicated the important role of lncRNA TSPEAR-AS2 in modulating fatty acid metabolism of CRC. The result of Oil Red O staining showed that the lipid content in lncRNA TSPEAR-AS2 high expression group was higher than that in lncRNA TSPEAR-AS2 low expression group. Our study may provide helpful information for fatty acid metabolism targeting therapies in CRC.
Keywords: ceRNA network; colorectal cancer; fatty acid metabolism; long noncoding RNA; nomogram; signature.
Copyright © 2021 Peng, Xu, Wen, Zhang, Wang, Liu, Zhao, Wang, Liu and Zhang.
Conflict of interest statement
The authors declare that the research was conducted in the absence of any commercial or financial relationships that could be construed as a potential conflict of interest.
Figures


Similar articles
-
Identification and Validation of Six Autophagy-related Long Non-coding RNAs as Prognostic Signature in Colorectal Cancer.Int J Med Sci. 2021 Jan 1;18(1):88-98. doi: 10.7150/ijms.49449. eCollection 2021. Int J Med Sci. 2021. PMID: 33390777 Free PMC article.
-
Development of a novel hypoxia-immune-related LncRNA risk signature for predicting the prognosis and immunotherapy response of colorectal cancer.Front Immunol. 2022 Sep 14;13:951455. doi: 10.3389/fimmu.2022.951455. eCollection 2022. Front Immunol. 2022. PMID: 36189298 Free PMC article.
-
Prognostic value of lncRNAs related to fatty acid metabolism in lung adenocarcinoma and their correlation with tumor microenvironment based on bioinformatics analysis.Front Oncol. 2022 Oct 10;12:1022097. doi: 10.3389/fonc.2022.1022097. eCollection 2022. Front Oncol. 2022. PMID: 36300102 Free PMC article.
-
Identification of a competing endogenous RNA network associated with prognosis of pancreatic adenocarcinoma.Cancer Cell Int. 2020 Jun 11;20:231. doi: 10.1186/s12935-020-01243-6. eCollection 2020. Cancer Cell Int. 2020. PMID: 32536819 Free PMC article. Review.
-
Lipid Metabolism Interplay in CRC-An Update.Metabolites. 2022 Feb 26;12(3):213. doi: 10.3390/metabo12030213. Metabolites. 2022. PMID: 35323656 Free PMC article. Review.
Cited by
-
LncRNAs-circRNAs as Rising Epigenetic Binary Superstars in Regulating Lipid Metabolic Reprogramming of Cancers.Adv Sci (Weinh). 2024 Jan;11(1):e2303570. doi: 10.1002/advs.202303570. Epub 2023 Nov 8. Adv Sci (Weinh). 2024. PMID: 37939296 Free PMC article. Review.
-
circCAPRIN1 interacts with STAT2 to promote tumor progression and lipid synthesis via upregulating ACC1 expression in colorectal cancer.Cancer Commun (Lond). 2023 Jan;43(1):100-122. doi: 10.1002/cac2.12380. Epub 2022 Nov 3. Cancer Commun (Lond). 2023. PMID: 36328987 Free PMC article.
-
Comprehensive analysis of fatty acid metabolism-related gene signatures for predicting prognosis in patients with prostate cancer.PeerJ. 2023 Jan 10;11:e14646. doi: 10.7717/peerj.14646. eCollection 2023. PeerJ. 2023. PMID: 36643625 Free PMC article.
-
Fatty acid metabolism-related enzymes in colorectal cancer metastasis: from biological function to molecular mechanism.Cell Death Discov. 2024 Aug 5;10(1):350. doi: 10.1038/s41420-024-02126-9. Cell Death Discov. 2024. PMID: 39103344 Free PMC article. Review.
-
Regulatory Role of Fatty Acid Metabolism-Related Long Noncoding RNA in Prostate Cancer: A Computational Biology Study Analysis.J Oncol. 2023 Feb 14;2023:9736073. doi: 10.1155/2023/9736073. eCollection 2023. J Oncol. 2023. PMID: 36824662 Free PMC article.
References
LinkOut - more resources
Full Text Sources
Miscellaneous

