. 2021 Jul 28;13(8):1478.
doi: 10.3390/v13081478.

How Epstein-Barr Virus and Kaposi's Sarcoma-Associated Herpesvirus Are Maintained Together to Transform the Same B-Cell

Affiliations

How Epstein-Barr Virus and Kaposi's Sarcoma-Associated Herpesvirus Are Maintained Together to Transform the Same B-Cell

Arthur U Sugden et al. Viruses. .

Abstract

Epstein-Barr virus (EBV) and Kaposi's sarcoma-associated herpesvirus (KSHV) independently cause human cancers, and both are maintained as plasmids in tumor cells. They differ, however, in their mechanisms of segregation; EBV partitions its genomes quasi-faithfully, while KSHV often clusters its genomes and partitions them randomly. Both viruses can infect the same B-cell to transform it in vitro and to cause primary effusion lymphomas (PELs) in vivo. We have developed simulations based on our measurements of these replicons in B-cells transformed in vitro to elucidate the synthesis and partitioning of these two viral genomes when in the same cell. These simulations successfully capture the biology of EBV and KSHV in PELs. They have revealed that EBV and KSHV replicate and partition independently, that they both contribute selective advantages to their host cell, and that KSHV pays a penalty to cluster its genomes.

Keywords: EBV; KSHV; dual-infection; model.


Conflict of interest statement

The authors declare no conflict of interest.

Figures

Figure 1
Figure 1
The different computational steps in developing simulations of the replication and partitioning of Epstein–Barr virus (EBV) in cells (upper left), of Kaposi’s sarcoma-associated herpesvirus (KSHV) in cells (upper right), and of both replicons in the same cells (below) are depicted. The parameters used at the different stages of the cell cycle are shown and defined in the Materials and Methods. Whether they have been determined by experiments in vitro, in silico, or set as a simulation parameter is detailed in Table 1. The red dots represent EBV replicons, the blue dots represent KSHV replicons, and their sizes reflect single or clustered molecules. The shades of these colors identify the parental cell from which each replicon is segregated. Cells that lose all viral genomes leave the cell cycle to die.
Figure 2
Figure 2
The distribution of the fraction of numbers of plasmids per cell in EBV is shown. This distribution was calculated from the findings of Nanbo et al. [1] following infection of primary B-cells with EBV at a multiplicity of infection of 2 after 50 generations of growth in culture. Not shown is the fraction of cells with zero plasmids per cell that die.
Figure 3
Figure 3
The distribution of the fraction of cells with given numbers of EBV plasmids per cell under positive selection is shown. (A) A distribution of the same form as in Figure 2 is depicted, but now calculated with a term for a positive selection. This positive selection is represented as an offset sigmoid function as follows: F(x)=2(eaxeax+1)1, where x equals the number of EBV plasmids per cell and “a” is the coefficient for positive selective as shown in Figure 3B. In the depicted distribution, “a” was set optimally to 0.1, so that the distribution mirrors that found in cells after 100 generations of growth in culture [16]. (B) The contribution to the number of plasmids per cell derived by altering computationally the coefficient of positive selection in the offset sigmoid function. The probability of a cell replicating each generation on the Y-axis is increased as a function of the number of plasmids per cell on the X-axis such that, as the coefficient decreases, the effect of positive selection more strongly selects for higher numbers of plasmids per cell.
Figure 4
Figure 4
The distribution of KSHV plasmids per cell requires the addition of the modeling of clusters of plasmids and their associated breakup. (A) The distribution of KSHV plasmids per cell with no selection. Two bars at the right show the fraction of simulated cells with unrealistically high numbers of plasmids per cell. (B) The CRP is entered for each plasmid with a probability of 0.8 (as described in the findings of Chiu et al. [2]). This breaks up clusters, assigning each resulting cluster to the first resulting breakup cluster, and is passed then to successive clusters until a new cluster is formed. This process is represented here with the relative probabilities of forming each size of cluster. (C) The CRP produces multiple resulting clusters, the number of which is defined by the “α” parameter. The optimum value of “α” was identified to be 0.5 [2]. (D) Varying “α” also affects the resulting cluster sizes, the largest of which are represented here.
Figure 5
Figure 5
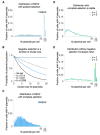
The distributions of KSHV with additional forms of selection are shown. (A) A distribution in the same form as Figure 4A, but now calculated with a term for positive selection. The positive selection coefficient and terms are identical to those for EBV, as shown in Figure 3B. Positive selection increases the fraction of cells with unrealistically high numbers of plasmids per cell. (B) To model more accurately the results from [16], negative selection was modeled as an exponential decay function describing the probability that any plasmid in a cluster is duplicated as a function of the cluster size. The function was in the form of F(x)=debx in which “x” is the size of the cluster; “d” is the default duplication probability; and “b” is a variable parameter, which we computationally varied and ultimately optimized to be 0.07. (C) A distribution in the same form as Figure 4A and Figure 5A, but now calculated with both positive and negative selection. Note that negative selection operating only on clusters eliminates unrealistically high numbers of plasmids per cell. (D) In the presence of a positive selective advantage that acts on cells and a negative selective disadvantage that acts on clusters of plasmids, the distribution of plasmids per cell comes to a stable equilibrium regardless of starting conditions. In this case, the blue distribution represents a population that began with each cell containing one plasmid per cell (μ = 1). The green distribution began with a population of two plasmids per cell (μ = 2). (E) Without KSHV paying a penalty for forming clusters, the population does not reach a stable equilibrium. Instead, more cells accumulate ever-increasing numbers of plasmids per cell (μ = 1 or 2).
Figure 6
Figure 6
Simulations based on the numbers of KSHV plasmids per cell measured by PCR accurately predict the distribution of clusters per cell measured by FISH [16]. (A) Simulations reproduce the mean number of plasmids per cell (blue dot: simulated mean, gray dot: measurements in vitro). As described above, adjusting only the selective advantage coefficient is sufficient to match the mean copy number of plasmids per cell. Here, the coefficient was set optimally to 0.07, which reproduced the mean number of plasmids per cell identified in vitro by qPCR after 20 generations of burn-in. The simulation was run for 30 generations to confirm that the distribution was in equilibrium. (B) The mean number of simulated clusters per cell closely matched the counts of plasmids clusters in vitro via FISH [2].

Similar articles

Cited by

References

    1. Nanbo A., Sugden A., Sugden B. The coupling of synthesis and partitioning of EBV’s plasmid replicon is revealed in live cells. EMBO J. 2007;26:4252–4262. doi: 10.1038/sj.emboj.7601853. - DOI - PMC - PubMed
    1. Chiu Y.-F., Sugden A.U., Fox K., Hayes M., Sugden B. Kaposi’s sarcoma–associated herpesvirus stably clusters its genomes across generations to maintain itself extrachromosomally. J. Cell Biol. 2017;216:2745–2758. doi: 10.1083/jcb.201702013. - DOI - PMC - PubMed
    1. Nador R.G., Cesarman E., Chadburn A., Dawson D.B., Ansari M., Sald J., Knowles D.M. Primary effusion lymphoma: A distinct clinicopathologic entity associated with the Kaposi’s sarcoma-associated herpes virus. Blood. 1996;88:645–656. doi: 10.1182/blood.V88.2.645.bloodjournal882645. - DOI - PubMed
    1. Cesarman E., Knowles D.M. The role of Kaposi’s sarcoma-associated herpesvirus (KSHV/HHV-8) in lymphoproliferative diseases. Semin. Cancer Biol. 1999;9:165–174. doi: 10.1006/scbi.1998.0118. - DOI - PubMed
    1. Lurain K., Polizzotto M.N., Aleman K., Bhutani M., Wyvill K.M., Gonçalves P.H., Ramaswami R., Marshall V.A., Miley W., Steinberg S.M., et al. Viral, immunologic, and clinical features of primary effusion lymphoma. Blood. 2019;133:1753–1761. doi: 10.1182/blood-2019-01-893339. - DOI - PMC - PubMed

Publication types

MeSH terms

LinkOut - more resources