. 2021 Aug 7;22(16):8512.
doi: 10.3390/ijms22168512.

The Changes in the p53 Protein across the Animal Kingdom Point to Its Involvement in Longevity

Affiliations

The Changes in the p53 Protein across the Animal Kingdom Point to Its Involvement in Longevity

Martin Bartas et al. Int J Mol Sci. .

Abstract

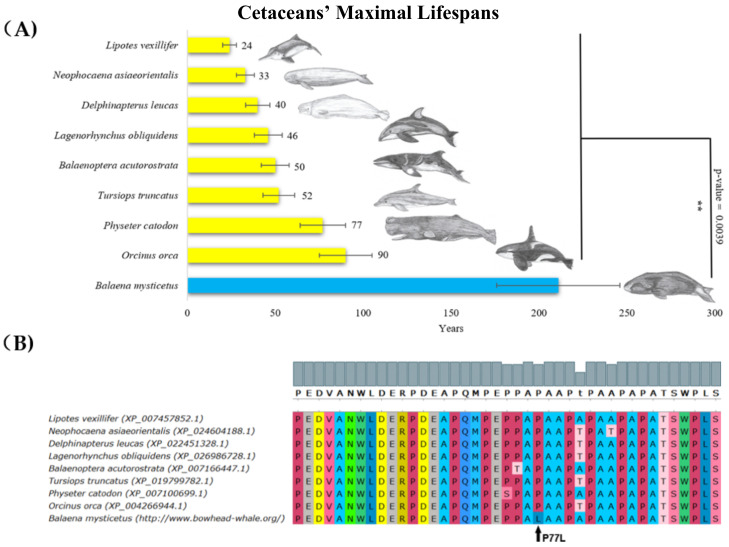
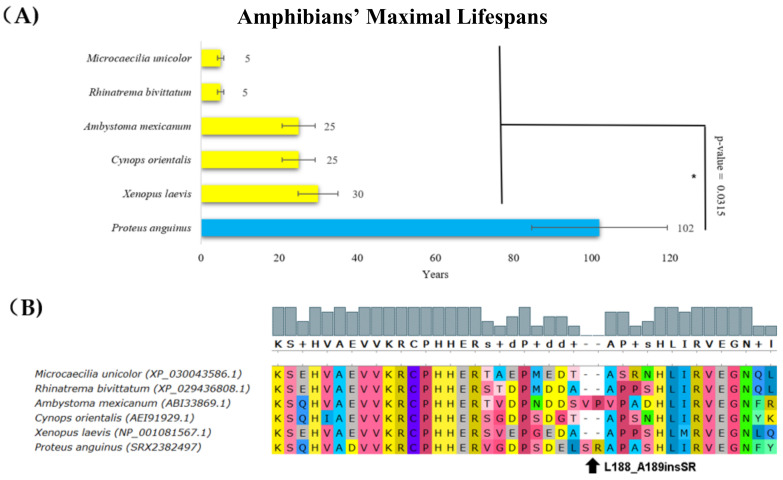
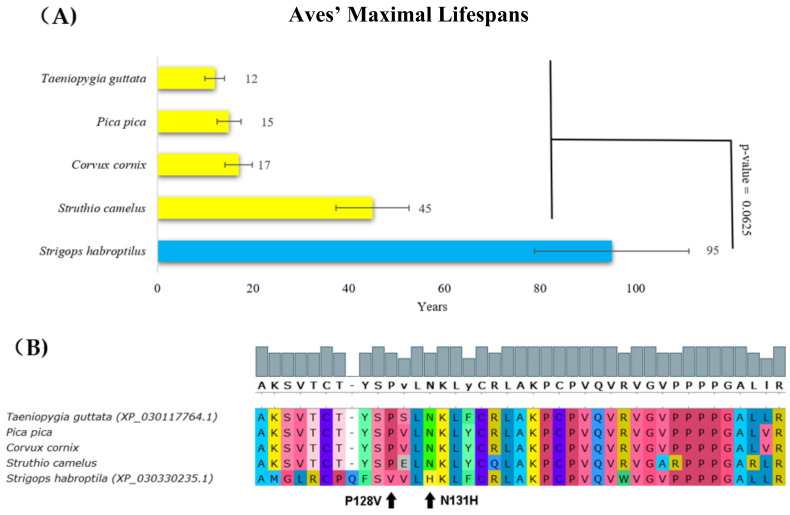
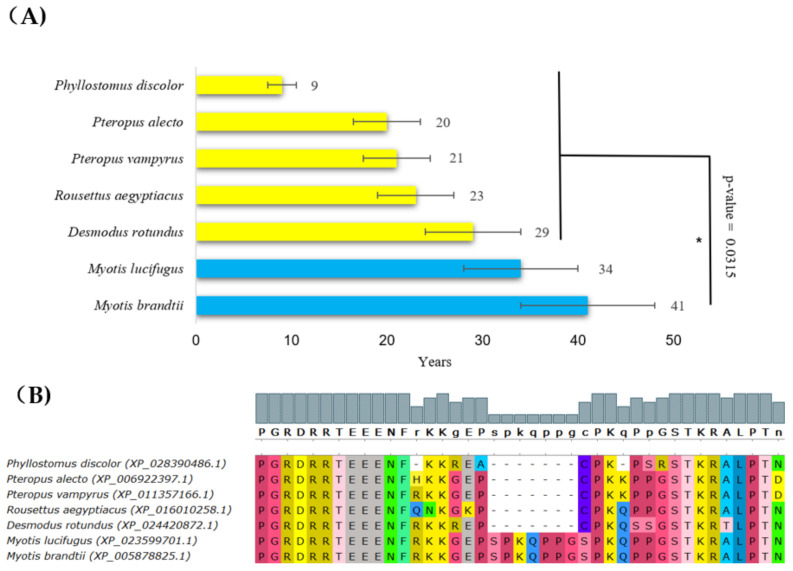
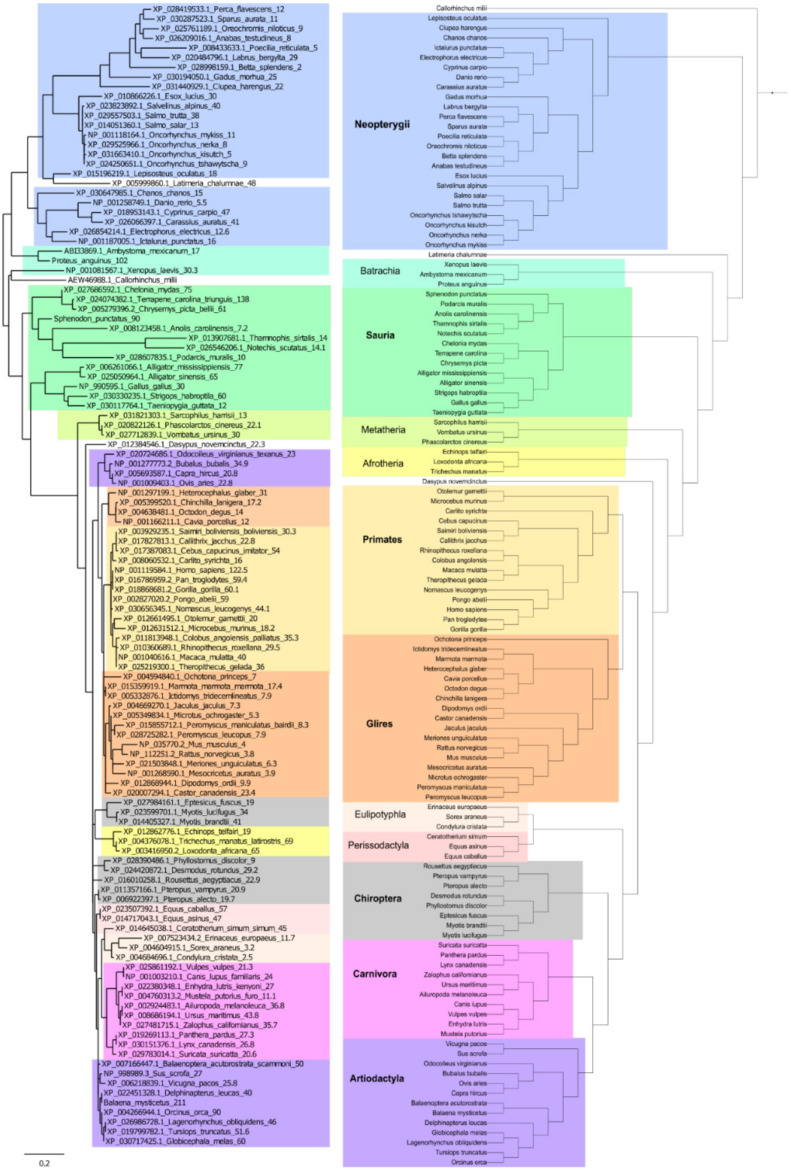
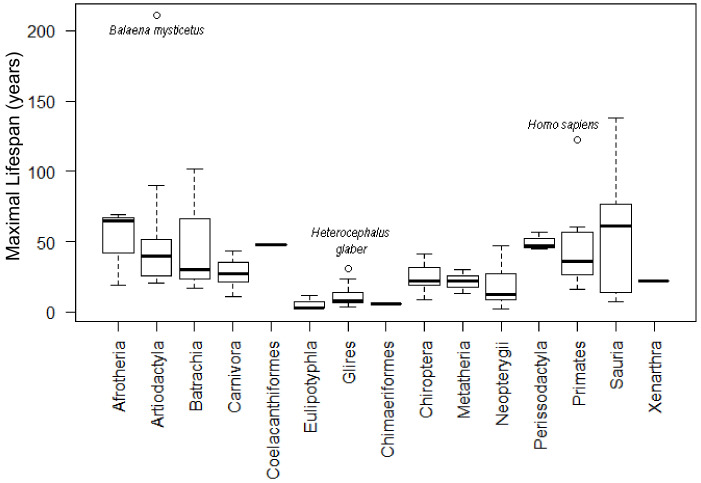
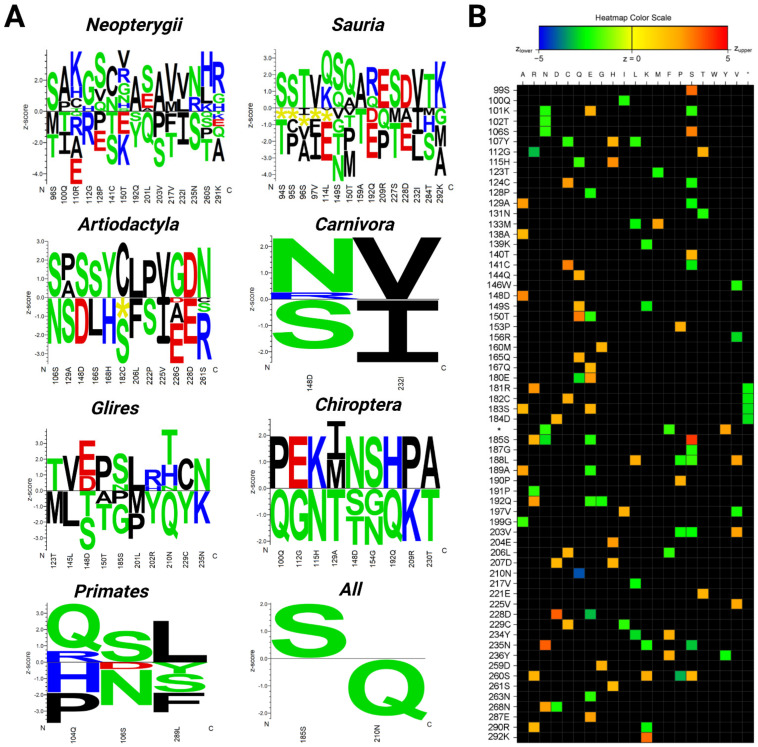
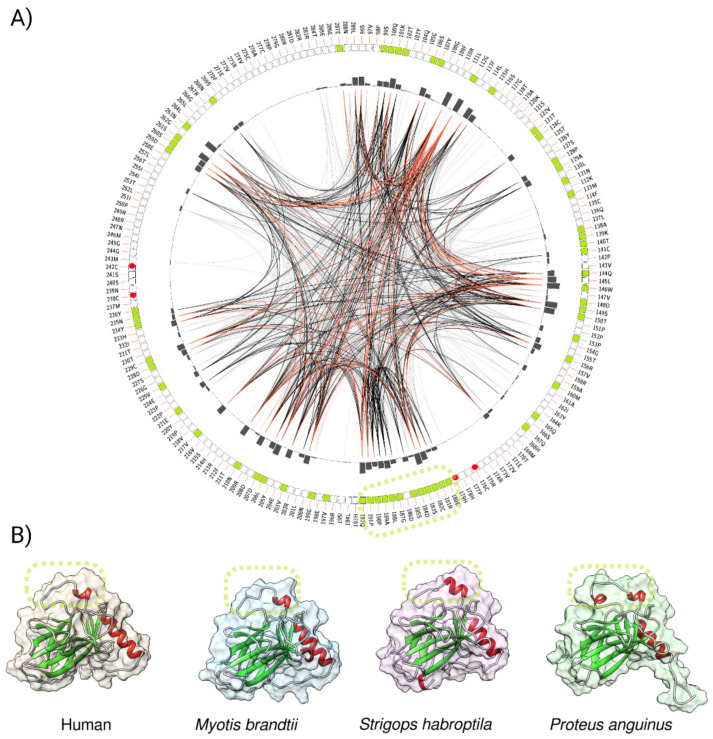
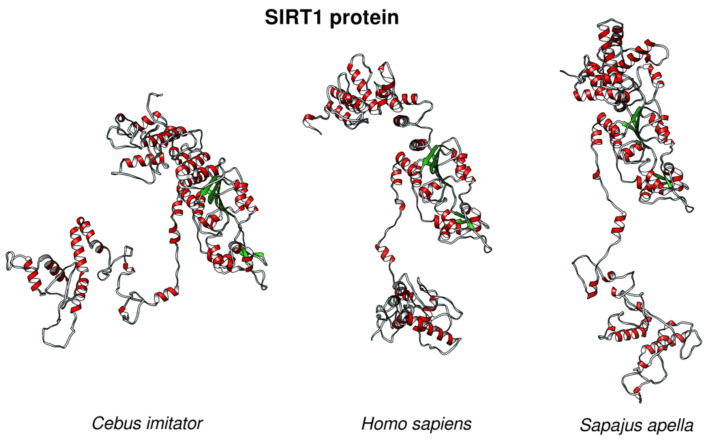
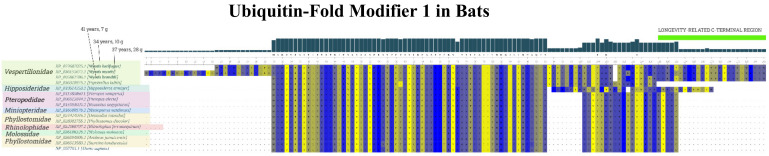
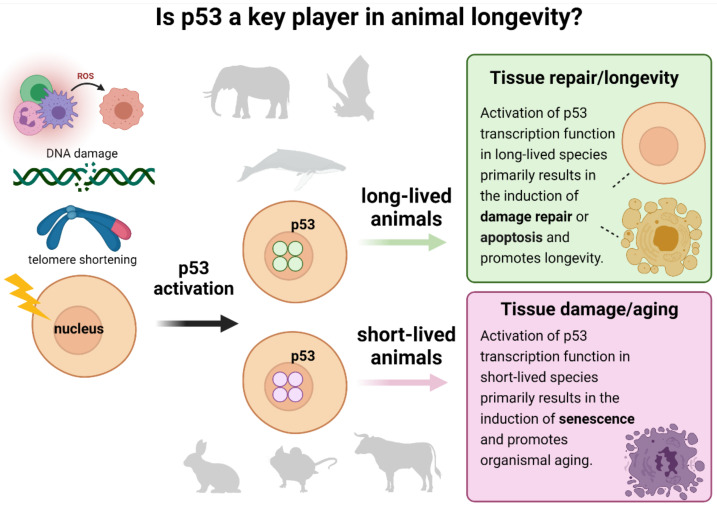
Recently, the quest for the mythical fountain of youth has produced extensive research programs that aim to extend the healthy lifespan of humans. Despite advances in our understanding of the aging process, the surprisingly extended lifespan and cancer resistance of some animal species remain unexplained. The p53 protein plays a crucial role in tumor suppression, tissue homeostasis, and aging. Long-lived, cancer-free African elephants have 20 copies of the TP53 gene, including 19 retrogenes (38 alleles), which are partially active, whereas humans possess only one copy of TP53 and have an estimated cancer mortality rate of 11-25%. The mechanism through which p53 contributes to the resolution of the Peto's paradox in Animalia remains vague. Thus, in this work, we took advantage of the available datasets and inspected the p53 amino acid sequence of phylogenetically related organisms that show variations in their lifespans. We discovered new correlations between specific amino acid deviations in p53 and the lifespans across different animal species. We found that species with extended lifespans have certain characteristic amino acid substitutions in the p53 DNA-binding domain that alter its function, as depicted from the Phenotypic Annotation of p53 Mutations, using the PROVEAN tool or SWISS-MODEL workflow. In addition, the loop 2 region of the human p53 DNA-binding domain was identified as the longest region that was associated with longevity. The 3D model revealed variations in the loop 2 structure in long-lived species when compared with human p53. Our findings show a direct association between specific amino acid residues in p53 protein, changes in p53 functionality, and the extended animal lifespan, and further highlight the importance of p53 protein in aging.

Keywords: aging; comparative analysis; longevity; p53; protein sequence.


Conflict of interest statement

The authors declare no conflict of interest. The funders had no role in the design of the study; in the collection, analyses, or interpretation of data; in the writing of the manuscript; or in the decision to publish the results.

Figures

Figure 1
Figure 1
Lifespan of species in the Cetacea order and the corresponding p53 sequence changes. (A) Comparison of cetaceans’ maximal lifespans in years. The bowhead whale’s (Baleana mysticetus’s) maximal lifespan was more than twice the maximal lifespan of the rest of Cetacea (Wilcoxon one-sided signed-rank test was used, ** p-value < 0.01). (B) Multiple sequence protein alignments of p53 proline-rich region, performed in MUSCLE with default parameters [47], colors in “UGENE” style.
Figure 2
Figure 2
Lifespan of species in amphibians and the corresponding p53 sequence changes. (A) Comparison of amphibians’ maximal lifespans in years. The olm’s (Proteus anguinus’s) maximal lifespan was more than three times higher than the maximal lifespan of other amphibians (Wilcoxon one-sided signed-rank test, * p-value < 0.05). (B) Multiple protein alignments of the p53 dimerization region. The olm (Proteus anguinus) had an insertion that is two amino acid residues long following amino acid residue 188 (related to human p53 canonical sequence). The sequence of the p53 homolog from Proteus anguinus was determined using transcriptomic data from the SRA Archive (SRX2382497). The methods and color schemes are the same as in Figure 1B.
Figure 3
Figure 3
Lifespans of species in the Aves order and the corresponding p53 sequence changes. (A) Comparison of Aves’ maximal lifespans in years. The kakapo’s (Strigops habroptila’s) maximal lifespan was more than twice the maximal lifespan of other Aves (Wilcoxon one-sided signed-rank test). (B) Multiple protein alignments representing the partial p53 core domain of the accessible Aves sequences. Sequences of all avian p53 homologs were determined using transcriptomic data from the SRA Archive, except for Strigops habroptila, where the p53 sequence was known (XP_030330235.1). The methods and color schemes are the same as in Figure 1B.
Figure 4
Figure 4
Lifespans of species in the Chiroptera order and the corresponding p53 sequence changes. (A) Comparison of Chiropteras’ maximal lifespans in years. The bats’, Myotis brandtii’s and Myotis lucifugus’s maximal lifespans were significantly longer compared with other sequenced bats (Wilcoxon one-sided signed-rank test, * p-value < 0.05). (B) Multiple protein alignments of the C-terminal part of the p53 core domain of accessible Chiroptera sequences. Methods and color schemes are the same as in Figure 1B.
Figure 5
Figure 5
The p53-based and contemporary phylogenetic trees. Comparison of the p53 protein tree (left) and the real phylogenetic tree (right). The protein tree was built using the Phylogeny.fr platform. Organismal phylogeny was reconstructed using PhyloT and visualized in iTOL (see the Materials and Methods section for details). The same color backgrounds represent the same phylogenetic groups.
Figure 6
Figure 6
Representation of lifespans for all tested phylogenetic groups.
Figure 7
Figure 7
Correlation of the most commonly altered p53 amino acid residues with the maximal lifespans of the analyzed species. (A) Logos quantifying the strength of the p53 core domain residue association (related to the human aa 94–293 according to the p53 canonical sequence) with the maximal lifespan in years in the analyzed subgroups of animals. Amino acid residues on the positive y-axis were significantly associated with the prolonged lifespan phenotype and residues on the negative y-axis were significantly associated with the shorter lifespan phenotype (significance threshold p-value ≤ 0.05). The height of each letter representing the strength of the statistical association between the residue and the data set phenotype. The amino acids are colored according to their chemical properties as follows: acidic (DE): red, basic (HKR): blue, hydrophobic (ACFILMPVW): black, and neutral (GNQSTY): green. (B) Heatmap visualization of the strength of the residue association (without a Bonferroni correction). The color scale ranges from blue (z < −5) to red (z > 5). Each column corresponds to one of the 20 proteinogenic amino acids and each row to a position in the submitted multiple sequence alignment (Supplementary Materials File S4). * Indicates site of the amino acid insertion.
Figure 8
Figure 8
A graphic representation of the positions of the p53 amino acids’ linked to longevity in the animal kingdom. (A) Mutual information to infer the convergent evolution of p53 core domains. A circos plot is a sequential circular representation of the multiple sequence alignment and the information it contains. Green boxes in the outer circle indicate the positions of the amino acids’ changes correlating with longevity. The dashed oval highlights the longest region associated with longevity, which spans the loop 2 (L2, residues 180–192) region of human p53 DBD including S185. Lines connect pairs of positions with mutual information greater than 6.5 [51]. Red edges represent the top 5%, black represents between 70 and 95%, and gray edges account for the remaining 70%. (B) p53 core domains of three different, long-lived organisms compared to humans, as modeled by trRosetta.
Figure 9
Figure 9
The 3D structures of SIRT1 proteins from long-lived species compared to Homo sapiens. SIRT1 structures from Cebus imitator (XP_017357564.1), Homo sapiens (NP_001135970.1), and Sapajus apella SIRT1 (XP_032108492.1) showed differences in the protein structures in the given species.
Figure 10
Figure 10
Sequence alignment of UFM1 proteins in bat species and humans. The 20-amino-acid-long extension of the C-terminal end in three long-living bats is depicted in light green. Multiple sequence protein alignments of UFM1 reference protein sequences were performed in MUSCLE with default parameters [47]; the colors express strand propensity.
Figure 11
Figure 11
Proposed p53-centric theory of extreme longevity. Cell damage caused by ROS, DNA damage, telomere shortening, or other factors activates p53 to enable DNA repair and/or apoptosis. On the other hand, a high activity of p53 promotes organismal aging, thus shortening the lifespan. We hypothesize that long-lived animals developed the “improved” p53 proteins, which are less active than in their short-lived counterparts but still may sufficiently contribute to DNA damage repair and apoptosis in species that are exposed to environmental genotoxic stresses.

Similar articles

Cited by

References

    1. Whittemore K., Vera E., Martínez-Nevado E., Sanpera C., Blasco M.A. Telomere Shortening Rate Predicts Species Life Span. Proc. Natl. Acad. Sci. USA. 2019;116:15122–15127. doi: 10.1073/pnas.1902452116. - DOI - PMC - PubMed
    1. Hughes B.G., Hekimi S. Many Possible Maximum Lifespan Trajectories. Nature. 2017;546:E8. doi: 10.1038/nature22786. - DOI - PubMed
    1. Barbi E., Lagona F., Marsili M., Vaupel J.W., Wachter K.W. The Plateau of Human Mortality: Demography of Longevity Pioneers. Science. 2018;360:1459–1461. doi: 10.1126/science.aat3119. - DOI - PMC - PubMed
    1. Hägg S., Jylhävä J. Sex Differences in Biological Aging with a Focus on Human Studies. eLife. 2021;10:e63425. doi: 10.7554/eLife.63425. - DOI - PMC - PubMed
    1. Harman D. Aging: A Theory Based on Free Radical and Radiation Chemistry. J. Gerontol. 1956;11:298–300. doi: 10.1093/geronj/11.3.298. - DOI - PubMed

Substances