. 2021 Aug 13;10(8):1286.
doi: 10.3390/antiox10081286.

EPR Study of KO2 as a Source of Superoxide and BMPO-OH/OOH Radical That Cleaves Plasmid DNA and Detects Radical Interaction with H2S and Se-Derivatives

Affiliations

EPR Study of KO2 as a Source of Superoxide and BMPO-OH/OOH Radical That Cleaves Plasmid DNA and Detects Radical Interaction with H2S and Se-Derivatives

Anton Misak et al. Antioxidants (Basel). .

Abstract

Superoxide radical anion (O2•-) and its derivatives regulate numerous physiological and pathological processes, which are extensively studied. The aim of our work was to utilize KO2 as a source of O2•- and the electron paramagnetic resonance (EPR) spin trapping 5-tert-butoxycarbonyl-5-methyl-1-pyrroline N-oxide (BMPO) technique for the preparation of BMPO-OOH and/or BMPO-OH radicals in water solution without DMSO. The method distinguishes the interactions of various compounds with BMPO-OOH and/or BMPO-OH radicals over time. Here, we show that the addition of a buffered BMPO-HCl mixture to powdered KO2 formed relatively stable BMPO-OOH and BMPO-OH radicals and H2O2, where the BMPO-OOH/OH ratio depended on the pH. At a final pH of ~6.5-8.0, the concentration of BMPO-OOH radicals was ≥20 times higher than that of BMPO-OH, whereas at pH 9.0-10.0, the BMPO-OH radicals prevailed. The BMPO-OOH/OH radicals effectively cleaved the plasmid DNA. H2S decreased the concentration of BMPO-OOH/OH radicals, whereas the selenium derivatives 1-methyl-4-(3-(phenylselanyl) propyl) piperazine and 1-methyl-4-(4-(phenylselanyl) butyl) piperazine increased the proportion of BMPO-OH over the BMPO-OOH radicals. In conclusion, the presented approach of using KO2 as a source of O2•-/H2O2 and EPR spin trap BMPO for the preparation of BMPO-OOH/OH radicals in a physiological solution could be useful to study the biological effects of radicals and their interactions with compounds.

Keywords: EPR spectra simulation; KO2; antioxidants; cleavage DNA; hydrogen sulfide; radical; selenium-derivatives; superoxide; •BMPO-OOH spin adduct.


Conflict of interest statement

The authors declare no conflict of interest.

Figures

Scheme 1
Scheme 1
Synthesis of compound RSe-1. (a)The first step of synthesis involves the alkylation of 1-methylpiperazine with 1-bromo-3-chlropropane to produce 1-(3-chloropropyl)-4-methylpiperazine in the presence of K2CO3 and acetone at room temperature. (b) 1-(3-chloropropyl)-4-methylpiperazine is subsequently reacted with diphenyl diselenide in an inert environment of N2, in the presence of NaBH4 and absolute ethanol at room temperature to obtain RSe-1 as final product.
Scheme 2
Scheme 2
Synthesis of compound RSe-2. (a)The first step of synthesis involves the Se-alkylation of 1-bromo-4-chlorobutane with diphenyl diselenide in an inert environment of N2, in the presence of NaBH4 and absolute ethanol at room temperature to obtain (4-chlorobutyl)(phenyl)selane. (b) In the second step (4-chlorobutyl)(phenyl)selane is reacted with 1-methylpiperazine in the presence of K2CO3 and acetone at room temperature to obtain RSe-2 as final product.
Figure 1
Figure 1
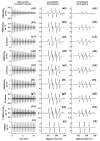
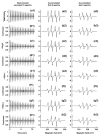
Representative pH-dependent EPR spectra of BMPO adducts after the addition of 20 mmol L−1 BMPO + HCl to powdered KO2 (final 40 mmol L−1 KO2). (a1i1) Collection of 15 EPR spectra of BMPO adducts arranged back-to-back, each 42 s, with a starting acquisition of 100 ± 15 s after sample preparation. (a2i2) The first to fifth accumulated spectra and (a3i3) last five accumulated spectra. HCl was added to BMPO (20 mmol L−1) in a buffer for the final required pH and the solution was added to powdered KO2. (a1a3) pH 9.0; (b1b3) pH 7.7 and (c1c3) continuation; (d1d3) pH 6.5 and (e1e3) continuation; (f1f3) pH 2.0 and (g1g3) continuation. (h1h3) BMPO adducts after the addition of 5 mmol L−1 BMPO + HCl to powdered KO2 (final 10 mM KO2) at pH 7.4. (i1i3) The EPR spectra of stable radical TEMPOL (20 µmol L−1). Intensities of (a1h1) time-dependent EPR spectra and (a2h3) the detailed spectra are approximately comparable. For details of the sample preparation, see Procedure 2 in Supplementary Materials.
Figure 2
Figure 2
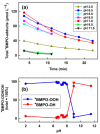
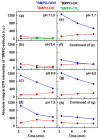
(a) Time and pH dependencies of the total BMPO adduct radical concentration of the BMPO + HCl/KO2 (20/40 in mmol L−1) mixture. Each point represents the average of five accumulated subsequent EPR spectra. Time starts after the addition of BMPO + HCl to powdered KO2. (b) pH-dependent normalized integral EPR intensity of individual BMPO-OOH and BMPO-OH components elucidated from the simulation of the first experimental EPR spectrum recorded 100 ± 15 s after the addition of BMPO + HCl to powdered KO2. Spectral simulation is described in Section 3.2. Spectral components: BMPO-OOH (blue) and BMPO-OH (red). The sum of individual BMPO adducts of the first spectra was normalized to 100%. Each pair (blue and red) of two complementary points represents the individual sample preparation.
Figure 3
Figure 3
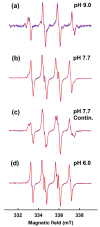
Representative normalized experimental EPR spectra of BMPO adducts along with their simulations using the hfcc summarized in Table 1. Only the experimental spectra of the sixth to tenth accumulated spectra are shown (blue, measured 5.2–8.7 min after sample preparation); the simulated spectra are red. (a) pH 9.0, (b) pH 7.7, (c) continued measurement during 15.7–19.2 min, and (d) pH 6.0.
Figure 4
Figure 4
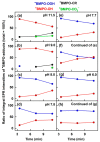
Comparison of time and pH-dependent normalized integral EPR intensity of individual BMPO adducts elucidated from the simulation of experimental EPR spectra. Spectral components: BMPO-OOH (blue), BMPO-OH (red), BMPO-CR (black), BMPO-CO2- (green) at (a) pH 11.5 (pH was adjusted by NaOH), (b) pH 9.0, (c) pH 8.0, (d) pH 7.8, and (e) pH 7.7; (f) continued measurement of (e) for the next 11 min; (g) pH 6.0 and (h) continued measurement of (g) for the next 11 min. Each point represents the average of five accumulated subsequent EPR spectra. Time starts after the addition of BMPO + HCl to powdered KO2. The sum of individual BMPO adducts of accumulated spectra was normalized to 100%. For details of the sample preparation, see Procedure 2 in Supplementary Materials.
Figure 5
Figure 5
Comparison of pH-dependent absolute integral EPR intensity (total quantity of radicals in r.u.) of individual BMPO adducts elucidated from the simulation of the experimental EPR spectra. Spectral components: BMPO-OOH (blue), BMPO-OH (red), BMPO-CR (black) and BMPO-CO2 (green) formed after dissolution of KO2 (final 40 mmol L−1) in 50 mmol L−1 phosphate buffer containing BMPO (20 mmol L−1) at (a) pH 11.5, (b) pH 9.0, (c) pH 8.0, (d) pH 7.8, (e) pH 7.7 and (f) continued measurement of (e), (g) pH 6.0 and (h) continued measurement of (g).
Figure 6
Figure 6
Effects of the compounds on the EPR spectra of BMPO adducts prepared through the addition of BMPO + HCl to powdered KO2. Final concentrations: BMPO + HCl/KO2 (20/40 in mmol L−1) in a 50 mmol L−1 phosphate buffer at pH 7.4. The arrangement of the spectra is the same as in Figure 1. (a1b3) Control EPR spectra and (c1d3) EPR spectra in the presence of 100 µmol L−1 Na2S, (e1f3) 100 µmol L−1 RSe-1, and (g1h3) 100 µmol L−1 RSe-2. For details of the sample preparation, see Procedure 3 in Supplementary Materials.
Figure 7
Figure 7
Effects of the compounds on the EPR spectra of BMPO adducts prepared through the addition of BMPO + HCl to powdered KO2. Final concentrations: BMPO + HCl/KO2 (20/40 in mmol L−1) in 50 mmol L−1 phosphate buffer at pH 6.7. The arrangement of the spectra is the same as in Figure 1. (a1a3) Control EPR spectra and (b1b3) EPR spectra in the presence of 100 µmol L−1 Na2S, (c1c3) 100 µmol L−1 RSe-1, and (d1d3) 100 µmol L−1 RSe-2. For details of sample preparation, see Procedure 3 in Supplementary Materials.
Figure 8
Figure 8
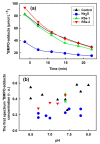
(a) Time dependencies of the total BMPO adduct radical concentration of the BMPO + HCl/KO2 (20/40 in mmol L−1) mixture (pH 7.4) with 100 µmol L−1 Na2S (blue), 100 µmol L−1 RSe-1 (green), and 100 µmol L−1 RSe-2 (red), as well as without any of these (black). Each point represents the average of five accumulated subsequent EPR spectra. Time starts after the addition of BMPO + HCl to powdered KO2. (b) The pH dependence of the integral EPR intensity of the total BMPO adducts (r.u.) of the first spectrum measured at 100 ± 15 s after the addition of BMPO + HCl to powdered KO2. Symbols have same meaning as in (a). Each point represents individual sample preparation.
Figure 9
Figure 9
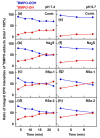
Time dependence of the integral EPR intensity normalized to 100% of the individual BMPO-OOH and BMPO-OH adducts elucidated from the simulation of the experimental EPR spectra shown in Figure 6; Figure 7, at pH 7.4 (ad) and pH 6.7 (eh). Time started when BMPO + HCl was added to KO2. Spectral components: BMPO-OOH (blue) and BMPO-OH (red). (a,e) Control; (b,f) 100 µmol L−1 Na2S; (c,g) 100 µmol L−1 RSe-1; (d,h) 100 µmol L−1 RSe-2. Each point represents the average of five accumulated subsequent EPR spectra.
Figure 10
Figure 10
pH-dependent normalized integral EPR intensity of individual BMPO-OOH and BMPO-OH components elucidated from the simulation of the first experimental EPR spectrum recorded 100 ± 15 s after the addition of BMPO + HCl to powdered KO2. Spectral components: control BMPO-OOH (blue) and BMPO-OH (red) are from Figure 2b; 100 µmol L−1 Na2S (cyan and pink); 100 µmol L−1 RSe-1 (dark green and green), and 100 µmol L−1 RSe-2 (black and dark yellow). Each pair of complementary colors, BMPO-OOH and BMPO-OH, represents an individual sample preparation. The sum of the individual spectra of BMPO adducts was normalized to 100%.
Figure 11
Figure 11
pH-dependent EPR spectra of the BMPO adduct after the addition of BMPO to powdered KO2, followed by the adjustment of the final pH by HCl. The arrangement of the spectra is the same as in Figure 1. BMPO in the phosphate buffer was added to powdered KO2 and vortexed, and 30 s later, HCl was added to adjust the final solution pH. (a1a3) pH 10.3; (b1b3) pH 8.5; (c1c3) pH 7.3 and (d1d3) continued of (c1–c3); (e1e3) pH 6.5. Intensities of (a1e1) time-dependent EPR spectra and (a2e2,a3e3) detailed spectra are approximately comparable. Molar ratio of BMPO/KO2 was 20/40 (in mmol L−1), except for (a1a3), where the ratio was 56/56 (in mmol L−1). For details of the sample preparation, see Procedure 4 in Supplementary Materials.
Figure 12
Figure 12
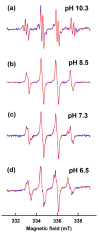
Representative normalized experimental EPR spectra of BMPO adducts along with their simulations. Arrangement of experimental and simulated spectra is the same as in Figure 3. EPR spectra at (a) pH 10.3, (b) pH 8.5, (c) pH 7.3, and (d) pH 6.5. Sample preparation: BMPO in the buffer was added to powdered KO2 and vortexed, and 30 s later HCl was added to adjust the final pH of the solution.
Figure 13
Figure 13
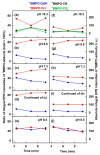
(Left column) Comparison of time- and pH-dependent normalized integral EPR intensity of individual BMPO adducts elucidated from the simulation of the experimental EPR spectra. Spectral components: BMPO-OOH (blue), BMPO-OH (red), BMPO-CR (black), and BMPO-CO2 (green) at (a) pH 10.3, (b) pH 8.5, and (c) pH 7.3; (d) continued measurement of (c) for another 11 min; (e) pH 6.5. Each point represents the average of five accumulated subsequent EPR spectra. Time starts after the addition of BMPO to powdered KO2. The sum of the individual BMPO adducts of the accumulated spectra was normalized to 100%. (Right column) (fj) Comparison of time- and pH-dependent absolute integral EPR intensity (total quantity of radicals in r.u.) of individual BMPO adducts of normalized integral EPR intensity shown in the left column.
Figure 14
Figure 14
Potency of compounds to induce pDNA cleavage at pH 6.5 (green), 7.4 (red), 8.0 (cyan), and 8.5 pH (pink) in a 25 mmol L−1 sodium phosphate buffer and 50 µmol L−1 DTPA at 37 °C. Control without and with 150 µmol L−1 FeCl2; controls with 5 mmol L−1 BMPO, 5 mmol L−1 H2O2, 10 mmol L−1 KO2, and 5 mmol L−1 H2O2 + 10 mmol L−1 KO2. Sample (BMPO + HCL) + KO2: BMPO (final 5 mmol L−1) in a phosphate buffer adjusted by HCl (to get required pH of BMPO/KO2 mixture) was added to powdered KO2 (final 10 mmol L−1), then the mixture was added to the pDNA solution (see Procedure 6 in Supplementary Materials). Sample (BMPO + HCL) + KO2 adjusted to pH 7.4: solutions were prepared as for previous samples with various pH levels, but HCl or NaOH were added to the pDNA solution to standardize the pH to 7.4 (see Procedure 7 in Supplementary Materials). Sample (Buffer + HCl) + KO2 + BMPO: phosphate buffer adjusted by HCl was added to powder KO2 (final 10 mmol L−1), followed by the addition of BMPO (final 5 mmol L−1) 10 s later, and the mixture was applied to the pDNA solution (see Procedure 8 in Supplementary Materials). The final concentration of pDNA was 0.2 µg in 20 µL. IR of nc DNA form represents the relative intensity of the nicked circular pDNA. Data represent values from individual samples. Horizontal black marks indicate means ± SD.

Similar articles

References

    1. Carroll L., Pattison D.I., Davies J.B., Anderson R.F., Lopez-Alarcon C., Davies M.J. Superoxide radicals react with peptide-derived tryptophan radicals with very high rate constants to give hydroperoxides as major products. Free Radic. Biol. Med. 2018;118:126–136. doi: 10.1016/j.freeradbiomed.2018.02.033. - DOI - PubMed
    1. Chiste R.C., Freitas M., Mercadante A.Z., Fernandes E. Superoxide Anion Radical: Generation and Detection in Cellular and Non-Cellular Systems. Curr. Med. Chem. 2015;22:4234–4256. doi: 10.2174/0929867322666151029104311. - DOI - PubMed
    1. Hayyan M., Hashim M.A., AlNashef I. Superoxide Ion: Generation and Chemical Implications. Chem. Rev. 2016;116:3029–3085. doi: 10.1021/acs.chemrev.5b00407. - DOI - PubMed
    1. Zhao H., Joseph J., Zhang H., Karoui H., Kalyanaraman B. Synthesis and biochemical applications of a solid cyclic nitrone spin trap: A relatively superior trap for detecting superoxide anions and glutathiyl radicals. Free Radic. Biol. Med. 2001;31:599–606. doi: 10.1016/S0891-5849(01)00619-0. - DOI - PubMed
    1. Bézière N., Hardy M., Poulhès F., Karoui H., Tordo P., Ouari O., Frapart Y.-M., Rockenbauer A., Boucher J.-L., Mansuy D., et al. Metabolic stability of superoxide adducts derived from newly developed cyclic nitrone spin traps. Free Radic. Biol. Med. 2014;67:150–158. doi: 10.1016/j.freeradbiomed.2013.10.812. - DOI - PubMed