. 2021 Sep 7;60(35):2637-2651.
doi: 10.1021/acs.biochem.1c00316. Epub 2021 Aug 26.

Rapid 2H NMR Transverse Relaxation of Perdeuterated Lipid Acyl Chains of Membrane with Bound Viral Fusion Peptide Supports Large-Amplitude Motions of These Chains That Can Catalyze Membrane Fusion

Affiliations

Rapid 2H NMR Transverse Relaxation of Perdeuterated Lipid Acyl Chains of Membrane with Bound Viral Fusion Peptide Supports Large-Amplitude Motions of These Chains That Can Catalyze Membrane Fusion

Ujjayini Ghosh et al. Biochemistry. .

Abstract

An early step in cellular infection by a membrane-enveloped virus like HIV or influenza is joining (fusion) of the viral and cell membranes. Fusion is catalyzed by a viral protein that typically includes an apolar "fusion peptide" (fp) segment that binds the target membrane prior to fusion. In this study, the effects of nonhomologous HIV and influenza fp's on lipid acyl chain motion are probed with 2H NMR transverse relaxation rates (R2's) of a perdeuterated DMPC membrane. Measurements were made between 35 and 0 °C, which brackets the membrane liquid-crystalline-to-gel phase transitions. Samples were made with either HIV "GPfp" at pH 7 or influenza "HAfp" at pH 5 or 7. GPfp induces vesicle fusion at pH 7, and HAfp induces more fusion at pH 5 vs 7. GPfp bound to DMPC adopts an intermolecular antiparallel β sheet structure, whereas HAfp is a monomer helical hairpin. The R2's of the no peptide and HAfp, pH 7, samples increase gradually as temperature is lowered. The R2's of GPfp and HAfp, pH 5, samples have very different temperature dependence, with a ∼10× increase in R2CD2 when temperature is reduced from 25 to 20 °C and smaller but still substantial R2's at 10 and 0 °C. The large R2's with GPfp and HAfp, pH 5, are consistent with large-amplitude motions of lipid acyl chains that can aid fusion catalysis by increasing the population of chains near the aqueous phase, which is the chain location for transition states between membrane fusion intermediates.


Figures
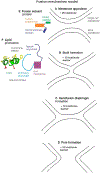
Figure 1.
Figure 1.
Fusion mechanism model. Panels A-D display membrane states during fusion. In the absence of fusion subunit protein, calculations suggest that ~25 kcal/mole energy is required to closely-appose two membranes and that there are ~10 kcal/mole barriers to formation of each of the three subsequent states. The membrane apposition energy may be reduced by the thermostable hairpin structure of the soluble ectodomain of the viral fusion protein subunit in conjunction with the fusion peptide bound to the target membrane and the transmembrane domain in the viral membrane (panel E). Both monomer and trimer forms of the hairpin have been reported and the trimer would have three fusion peptides and three transmembrane domains. The barrier for the apposed membranes → stalk step (A →B) may be reduced by perturbation of the acyl chains of the target membrane lipids near the fusion peptide. Panel F shows a schematic model of one type of perturbation that is suggested by molecular dynamics simulations of membrane with monomer HAfp. These simulations show larger motional amplitudes and higher probability of protrusion, i.e. location of the lipid acyl chain closer to the aqueous phase. The HAfp in panel F is represented as the semi-closed helical hairpin structure located in the outer leaflet of the target cell membrane with some hydrophobic sidechains in the membrane interior and some polar sidechains in the aqueous phase.
Figure 2.
Figure 2.
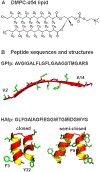
Panel A displays the chemical structure of DMPC-d54 lipid with D ≡ 2H. Panel B displays sequences and structural models of GPfp and HAfp based on data for peptide without the rest of the protein. A few residues are identified in the models. One strand of a GPfp intermolecular antiparallel β sheet is displayed. The sheets have distributions of adjacent strand registries that include the residue 1→16/16→1 and 1→17/17→1 registries. HAfp is a monomeric helical hairpin with populations of closed and semi-closed structures. The closed structure is based on PDB 2KXA.
Figure 3.
Figure 3.
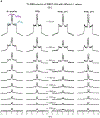
2H NMR spectra of samples with DMPC-d54 at different temperatures and different relaxation times ≡ τ. The pulse sequence is the solid-echo sequence π/2 − τa − π/2 − τb - acquisition so that τ = τa + τb + 22 μs. Each sample contained either DMPC-d54 without peptide (left columns) or DMPC-d54 with peptide and peptide:DMPC-d54 = 1:25 molar ratio (right columns). For each of the A-D panels, the displayed spectra have similar lineshapes for the shortest-time τ = 63 μs spectra. This similarity indicates similar order parameters of the four samples and similar amplitudes of motions with frequencies >100 kHz. For the same column within a panel, each spectrum is the sum of the same number of scans, where 500 is a typical number. For the same column within a panel, each spectrum is processed with the same exponential line broadening, and the typical broadening is 100 Hz for panel A, 500 Hz for panel B, and 1000 Hz for panels C and D. The −C2H3 “horns” and −C2H2 horn regions are identified for the 35 °C no peptide spectrum at shortest τ, where the horns are peaks corresponding to the most probable θ = 90° orientation with respect to the NMR field.
Figure 3.
Figure 3.
2H NMR spectra of samples with DMPC-d54 at different temperatures and different relaxation times ≡ τ. The pulse sequence is the solid-echo sequence π/2 − τa − π/2 − τb - acquisition so that τ = τa + τb + 22 μs. Each sample contained either DMPC-d54 without peptide (left columns) or DMPC-d54 with peptide and peptide:DMPC-d54 = 1:25 molar ratio (right columns). For each of the A-D panels, the displayed spectra have similar lineshapes for the shortest-time τ = 63 μs spectra. This similarity indicates similar order parameters of the four samples and similar amplitudes of motions with frequencies >100 kHz. For the same column within a panel, each spectrum is the sum of the same number of scans, where 500 is a typical number. For the same column within a panel, each spectrum is processed with the same exponential line broadening, and the typical broadening is 100 Hz for panel A, 500 Hz for panel B, and 1000 Hz for panels C and D. The −C2H3 “horns” and −C2H2 horn regions are identified for the 35 °C no peptide spectrum at shortest τ, where the horns are peaks corresponding to the most probable θ = 90° orientation with respect to the NMR field.
Figure 4.
Figure 4.
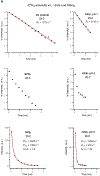
Fittings of 2H NMR spectral intensity (I) vs. relaxation time (τ) to determine R2’s ≡ transverse relaxation rates. Plots and fittings are for: (A) −C2H2 data of no peptide and HAfp, pH 7 at 25 °C and of GPfp and HAfp, pH 5 at 20 °C; (B) −C2H2 data of no peptide and HAfp, pH 7 at 20 °C and of GPfp and HAfp, pH 5 at 10 °C; and (C) −C2H3 data. The data are black squares and are based on integrated intensities from spectra displayed in: (A) Fig. 3B; (B) Fig. 3C; and (C) Fig. 3B and C. The best-fits are displayed in red. The fittings in panels A and B are grouped together because of similar lineshapes and linewidths of the respective Fig. 3B and C spectra. Most data are fitted to ln(I) = ln(I0) − (R2 × τ) where ln(I0) and R2 ≡ transverse relaxation rate are fitting parameters. For the GPfp and HAfp, pH 5 −C2H2 data at 20 C, the fitting is based on I = [Af × exp(−R2,f × τ)] + [As × exp(−R2,s × τ)] where Af, R2,f, As, and R2,s are fitting parameters. Best-fit parameters with uncertainties are also displayed in Table 1, and Fig. S1 has the integration windows that were used to determine the intensities that are fitted.
Figure 4.
Figure 4.
Fittings of 2H NMR spectral intensity (I) vs. relaxation time (τ) to determine R2’s ≡ transverse relaxation rates. Plots and fittings are for: (A) −C2H2 data of no peptide and HAfp, pH 7 at 25 °C and of GPfp and HAfp, pH 5 at 20 °C; (B) −C2H2 data of no peptide and HAfp, pH 7 at 20 °C and of GPfp and HAfp, pH 5 at 10 °C; and (C) −C2H3 data. The data are black squares and are based on integrated intensities from spectra displayed in: (A) Fig. 3B; (B) Fig. 3C; and (C) Fig. 3B and C. The best-fits are displayed in red. The fittings in panels A and B are grouped together because of similar lineshapes and linewidths of the respective Fig. 3B and C spectra. Most data are fitted to ln(I) = ln(I0) − (R2 × τ) where ln(I0) and R2 ≡ transverse relaxation rate are fitting parameters. For the GPfp and HAfp, pH 5 −C2H2 data at 20 C, the fitting is based on I = [Af × exp(−R2,f × τ)] + [As × exp(−R2,s × τ)] where Af, R2,f, As, and R2,s are fitting parameters. Best-fit parameters with uncertainties are also displayed in Table 1, and Fig. S1 has the integration windows that were used to determine the intensities that are fitted.
Figure 5.
Figure 5.
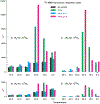
Bar plots of temperature-dependent transverse relaxation rates (R2) and differences in rates (ΔR2). Panels A and B display R2’s for −C2H2 and −C2H3, respectively, and panels C and D display ΔR2’s for −C2H2 and −C2H3, respectively, where ΔR2 = R2,peptideR2,no peptide. The R2’s are for DMPC-d54 without peptide and with peptide:DMPC-d54 molar ratio = 1:25. The R2 values and their uncertainties are numerically presented in Table 1 with additional rate analyses in Figs. S1 and S2. The −C2H2 R2’s are typically for the most intense region of the −C2H2 spectrum that does not overlap with the −C2H3 signals. For −C2H2 of GPfp and HAfp, pH 5 at 20 °C, the R2’s are for the dominant fast components of the bi-exponential decays. At 35, 30, and 25 °C, each ΔR2 is calculated using R2,peptide and R2,no peptide at the given temperature, based on predominant liquid-crystalline phase at these temperatures. At 20, 10, and 0 °C, each ΔR2 for HAfp, pH 7 is also the difference between R2’s at the given temperature, based on a predominant gel phase and on similar spectral lineshapes and linewidths at each temperature (Figs. 3C, D and S1). At 20, 10, and 0 °C, each ΔR2 for GPfp and HAfp, pH 5 is calculated using the R2,no peptide at 25, 20, and 10 °C, respectively. This is based on similar spectral lineshapes and linewidths and therefore similar phases and amplitudes of fast-motions of the peptide and no peptide samples (Fig. 3B, C, and D).

Similar articles

Cited by

References

    1. White JM, Delos SE, Brecher M, and Schornberg K (2008) Structures and mechanisms of viral membrane fusion proteins: Multiple variations on a common theme, Crit. Rev. Biochem. Mol. Biol 43, 189–219. - PMC - PubMed
    1. Boonstra S, Blijleven JS, Roos WH, Onck PR, van der Giessen E, and van Oijen AM (2018) Hemagglutinin-mediated membrane fusion: A biophysical perspective, Ann. Revs. Biophys 47, 153–173. - PubMed
    1. Tang T, Bidon M, Jaimes JA, Whittaker GR, and Daniel S (2020) Coronavirus membrane fusion mechanism offers a potential target for antiviral development, Antiviral Research 178, 104792. - PMC - PubMed
    1. Pabis A, Rawle RJ, and Kasson PM (2020) Influenza hemagglutinin drives viral entry via two sequential intramembrane mechanisms, Proc. Natl. Acad. Sci. U.S.A 117, 7200–7207. - PMC - PubMed
    1. Kim CS, Epand RF, Leikina E, Epand RM, and Chernomordik LV (2011) The final conformation of the complete ectodomain of the HA2 subunit of Influenza Hemagglutinin can by itself drive low pH-dependent fusion, J. Biol. Chem 286, 13226–13234. - PMC - PubMed

Publication types

MeSH terms