. 2021 Nov 1;32(21):ar25.
doi: 10.1091/mbc.E21-06-0295. Epub 2021 Aug 25.

RUSC2 and WDR47 oppositely regulate kinesin-1-dependent distribution of ATG9A to the cell periphery

Affiliations

RUSC2 and WDR47 oppositely regulate kinesin-1-dependent distribution of ATG9A to the cell periphery

Carlos M Guardia et al. Mol Biol Cell. .

Abstract

Autophagy-related protein 9 (ATG9) is a transmembrane protein component of the autophagy machinery that cycles between the trans-Golgi network (TGN) in the perinuclear area and other compartments in the peripheral area of the cell. In mammalian cells, export of the ATG9A isoform from the TGN into ATG9A-containing vesicles is mediated by the adaptor protein 4 (AP-4) complex. However, the mechanisms responsible for the subsequent distribution of these vesicles to the cell periphery are unclear. Herein we show that the AP-4-accessory protein RUSC2 couples ATG9A-containing vesicles to the plus-end-directed microtubule motor kinesin-1 via an interaction between a disordered region of RUSC2 and the kinesin-1 light chain. This interaction is counteracted by the microtubule-associated protein WDR47. These findings uncover a mechanism for the peripheral distribution of ATG9A-containing vesicles involving the function of RUSC2 as a kinesin-1 adaptor and WDR47 as a negative regulator of this function.


Figures
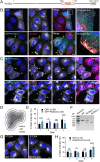
FIGURE 1:
FIGURE 1:
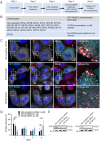
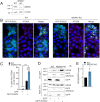
RUSC2 controls the cytoplasmic distribution of ATG9A. (A) Schematic representation of full-length human RUSC2 indicating the RUN (1031–1175) and SH3 (1447–1516) domains. (B) HeLa cells were transiently transfected with plasmids encoding GFP or GFP-RUSC2 (cyan), immunostained for endogenous ATG9A (red), and counterstained for nuclei (DAPI) (blue). Cells were imaged by confocal microscopy. Single channels are shown in inverted grayscale with nuclei in blue. Scale bars: 10 μm. Images on the rightmost column are fivefold enlargements of the boxed areas. (C) HeLa cells transiently overexpressing GFP-RUSC2 (cyan) were immunostained for endogenous ATG9A (red) together with TfR or CD63 (magenta), counterstained with DAPI (blue), and imaged by confocal microscopy. Scale bars: 10 μm. Single-channel images are shown in inverted grayscale with DAPI staining in blue. The arrows in panels B and C point to GFP-RUSC2 and ATG9A at vertices of transfected cells. (D) Schematic representation of shell analysis in which the cytoplasm was divided in four regions, with 1 being the most peripheral and 4 being the most central. (E) Quantification of the distribution of ATG9A in GFP- and GFP–RUSC2-overexpressing cells by shell analysis from experiments such as that shown in panel B. Results are expressed as the percentage of the total intensity in each shell region. Values are the mean ± SD from the indicated number of cells (n) in three independent experiments. The statistical significance of the differences was determined using two-way ANOVA followed by Sidak’s multiple comparison test. *p < 0.05; ****p < 0.0001; ns p > 0.05, not significant. (F) PCR analysis of genomic DNA from RUSC2+/+ (WT), RUSC2+/– and RUSC2–/– (RUSC2-KO) cells using the primers shown in Supplemental Figure S1F. The positions of DNA size markers are indicated on the left. (G) WT and RUSC2-KO HeLa cells were immunostained for endogenous ATG9A and counterstained for nuclei with DAPI (blue). Cells were imaged by confocal microscopy. Scale bar: 10 μm. (H) Quantification of the distribution of ATG9A in WT and RUSC2-KO cells by shell analysis, as described for panels D and E.
FIGURE 2:
FIGURE 2:
KD of KIF5B prevents RUSC2-induced redistribution of ATG9A to cell vertices. (A) Flowchart of siRNA screen. (B) Summary of results from siRNA screen. Representative immunofluorescence microscopy images are shown in panel C and Supplemental Figure S2. (C) HeLa cells treated with nontargeting, KIF1B, or KIF5B siRNAs were transiently transfected with a plasmid encoding GFP-RUSC2 (cyan) according to the protocol in panel A, immunostained for endogenous ATG9A (red), counterstained for nuclei (DAPI) (blue), and examined by confocal microscopy. Scale bars: 10 μm. Single-channel images are shown in inverted grayscale with DAPI staining in blue. Images on the rightmost column are fivefold enlargements of the boxed areas in the merge panels. Arrows point to GFP-RUSC2 and ATG9A at vertices of transfected cells. (D) Quantification of the distribution of ATG9A by shell analysis (see scheme in Figure 1D). Values are the mean ± SD from the number of cells (n) indicated in the figure in three independent experiments. The statistical significance of the differences was determined using two-way ANOVA followed by Sidak’s multiple comparison test. ***p < 0.001; ns p > 0.05, not significant. (E) Immunoblot analysis of whole-cell lysates from WT HeLa cells treated with non-targeting, KIF1B, or KIF5B siRNAs and from KIF1B- or KIF5B-KO HeLa cells. Immunoblots were probed with antibodies to KIF1B, KIF5B, or β-actin (loading control). The positions of molecular mass markers (in kDa) are indicated on the left.
FIGURE 3:
FIGURE 3:
KO of KIF5B prevents RUSC2-induced redistribution of ATG9A to cell vertices. (A) KIF1B-KO or KIF5B-KO HeLa cells were transiently transfected with a plasmid encoding GFP-RUSC2 (cyan), immunostained for endogenous ATG9A (red), counterstained for nuclei (DAPI) (blue), and imaged by confocal microscopy. Scale bars: 10 μm. Single-channel images are shown in inverted grayscale with DAPI staining in blue. Images on the rightmost column are fivefold enlargements of the boxed areas in the merge panels. Arrows point to GFP-RUSC2 and ATG9A at vertices of KIF1B-KO cells. Notice that KIF5B KO prevents GFP–RUSC2-induced redistribution to cell vertices. (B) Quantification of the distribution of ATG9A by shell analysis (see scheme in Figure 1D) in KIF1B-KO and KIF5B-KO cells overexpressing GFP-RUSC2 from experiments such as those in panel A. Values are the mean ± SD from the number of cells (n) indicated in the figure from three independent experiments. The statistical significance of the differences was determined using two-way ANOVA followed by Sidak’s multiple comparison test. ***p < 0.001; ns p > 0.05, not significant.
FIGURE 4:
FIGURE 4:
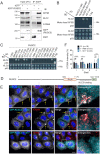
Interaction of RUSC2 with KLC2 drives ATG9A to cell vertices. (A) Coimmuno­precipitation of KIF5B, KLC2, and ATG9A with tGFP-RUSC2. Lysates of HeLa cells transfected with plasmids encoding tGFP or tGFP-RUSC2 were subjected to immunoprecipitation (IP) with antibody to the tGFP tag followed by immunoblotting (IB) with antibodies to the indicated proteins. The positions of molecular mass markers (in kDa) are indicated on the left. (B) Y2H analysis of the interaction of Gal4-AD fusions to different fragments of RUSC2, AP–4-μ4 and the SV40 large T antigen (T-Ag) (control) and Gal4-BD fusions to full-length KLC2, motorless KIF5B and p53 (control). Growth in the absence of histidine (–His) is indicative of interactions. Growth in the presence of histidine (+His) is a control for viability and seeding of double transformants. Images shown are representative of three independent experiments. In addition to the interaction of RUSC2 with kinesin-1, the coimmunoprecipitation analyses showed an interaction of RUSC2 with ATG9A (panel A) and the Y2H analyses an interaction of the AP–4-μ4 subunit with KLC2 (panel B). These latter interactions were not further characterized. (C) Y2H analysis of the interaction of 1) a series of RUSC2 fragments, SKIP 1–603 (control), or T-Ag (control) fused to the Gal4 AD with 2) KLC2 or p53 (control) fused to the Gal4 BD. Interactions were assessed as described for panel B. (D) Schematic representation of full-length GFP-RUSC2 indicating the region that interacts with KLC2 (amino acids 1266–1441). (E) HeLa cells were transfected with plasmids encoding GFP-tagged full-length or truncated RUSC2 constructs (cyan), immunostained for endogenous ATG9A (red), counterstained for nuclei (DAPI) (blue), and imaged by confocal microscopy. Scale bars: 10 μm. Single-channel images are shown in inverted grayscale with DAPI staining in blue. Arrows point to GFP-RUSC2 (WT and 1–1466) and ATG9A at vertices of transfected cells. Images on the rightmost column are fivefold enlargements of the boxed areas in the merge panels. (F) Quantification of the distribution of ATG9A by shell analysis (see scheme in Figure 1D) in HeLa cells overexpressing full-length (FL) or truncated forms of GFP-RUSC2. Values are the mean ± SD from the number of cells (n) indicated in the figure in three independent experiments. The statistical significance of the differences was determined using two-way ANOVA followed by Sidak’s multiple comparison test. *p < 0.05; ***p < 0.001; ns p > 0.05, not significant.
FIGURE 5:
FIGURE 5:
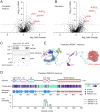
Identification of WDR47 as a RUSC2 interactor. (A, B) Volcano plots showing the results of affinity purification and mass spectrometry analysis of RUSC2 interactors from cells cultured for 2 h in complete (A) or starvation (B) medium. Analyses were performed in triplicate. (C) Immunoblot analysis showing coimmunoprecipitation of endogenous WDR47 with tGFP-RUSC2. Lysates of HeLa cells stably transduced with lentiviral plasmids encoding tGFP or tGFP-RUSC2 were immunoprecipitated with antibody to tGFP followed by SDS–PAGE and immunoblotting with antibodies to the indicated proteins. The positions of molecular mass markers are indicated on the left. (D) Domain organization, conservation, secondary structure, and CC prediction of WDR47. Conservation was calculated on the ConSeq server (Berezin et al., 2004) using default search values. Consensus secondary structure prediction was done using the MLRC, DSC and PHD methods at the NPS@ server (https://npsa-prabi.ibcp.fr/cgi-bin/npsa_automat.pl?page=/NPSA/npsa_seccons.html). Coiled coils were predicted using COILS (Lupas et al., 1991). (E) Automated structure prediction of WDR47 by the Robetta server (https://robetta.bakerlab.org/). The known folded LisH-CTLH and WDR40 repeat domains are highlighted as surfaces on the structure. Notice the two predicted folded sequences corresponding to the D1 and D2 domains, and the CCs CC1 and CC2.
FIGURE 6:
FIGURE 6:
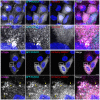
Partial colocalization of WDR47 with RUSC2 and ATG9A at cell vertices. HeLa cells were cotransfected with plasmids encoding GFP-RUSC2 (cyan) and mCherry or mCherry-WDR47 (red), immunostained for endogenous ATG9A (magenta), counterstained with DAPI (blue), and imaged by confocal microscopy. Scale bar: 10 μm. Single-channel images are shown in inverted grayscale with DAPI staining in blue. Images in the second and fourth rows are fivefold enlargements of the boxed areas in the first and third rows, respectively. Notice the partial colocalization of mCherry-WDR47 with GFP-RUSC2 and ATG9A at cell vertices (arrows).
FIGURE 7:
FIGURE 7:
WDR47 depletion enhances RUSC2-induced redistribution of ATG9A to cell vertices. (A) Immunoblot analysis of WDR47-KO HeLa cells. The positions of molecular mass larkers (in kDa) are indicated at left. (B) WT or WDR47-KO HeLa cells were transfected with plasmids encoding GFP-tagged RUSC2 (cyan), immunostained for endogenous ATG9A (magenta), counterstained with DAPI (blue), and imaged by confocal microscopy. Scale bars: 10 μm. Asterisks indicate transfected cells with GFP-RUSC2 and ATG9A at vertices. (C) Quantification of the percentage of cells with ATG9A at cell vertices in WT and WDR47-KO HeLa cells overexpressing either GFP or GFP-RUSC2. Values are the mean ± SD from at least 100 cells per sample in three independent experiments. The statistical significance of the differences was determined using two-way ANOVA followed by Tukey’s multiple comparison test. ****p < 0.0001. Notice the increase in the proportion of cells with ATG9A at vertices of WDR47-KO cells. (D) Immunoblot analysis showing increased coimmunoprecipitation of KIF5B with tGFP-RUSC2 in WDR47-KO compared with WT cells. Lysates of WT or WDR47-KO HeLa cells transfected with plasmids encoding tGFP or tGFP-RUSC2 were immunoprecipitated using antibody to tGFP followed by SDS–PAGE and immunoblotting with antibodies to endogenous KIF5B. The positions of molecular mass markers (in kDa) are indicated on the left. (E) Quantification of the blots from the coimmunoprecipitation experiment shown in panel D. Values represent levels of KIF5B relative to coimmunoprecipitated tGFP-RUSC2 after subtraction of background KIF5B from the tGFP control lanes. Values are the mean ± SD from four independent experiments. The statistical significance of the differences was determined using Student’s t test. **p < 0.01.
FIGURE 8:
FIGURE 8:
Proposed mechanism of transport of ATG9A-containing vesicles to the cell periphery. ATG9A is sorted into ATG9A vesicles by interaction of its N-terminal cytosolic domain with the μ4 subunit of AP-4 (Mattera et al., 2017). RUSC2 binds to AP-4 (Davies et al., 2018) and recruits kinesin-1 via interaction of its second disordered domain within KLC2 (this study). AP-4 dissociates from ATG9A vesicles (before or after kinesin-1 recruitment), but RUSC2 remains bound to the vesicles (Davies et al., 2018), possibly via interaction with ATG9A (this study). Kinesin-1 drives ATG9A vesicles toward the cell periphery (this study), likely for delivery to PAS or endosomes. WDR47 interacts with RUSC2, reducing the coupling to kinesin-1 and impairing movement of ATG9A vesicles toward the cell periphery (this study). This system allows for the regulated distribution of ATG9A toward the cell periphery. RUSC2 and WDR47 are shown as dimers for symmetry with kinesin-1, although there is currently no evidence for the dimerization of these proteins.

Similar articles

Cited by

References

    1. Abou Jamra R, Philippe O, Raas-Rothschild A, Eck SH, Graf E, Buchert R, Borck G, Ekici A, Brockschmidt FF, Nöthen MM, et al. (2011). Adaptor protein complex 4 deficiency causes severe autosomal-recessive intellectual disability, progressive spastic paraplegia, shy character, and short stature. Am J Hum Genet 88, 788–795. - PMC - PubMed
    1. Alwadei AH, Benini R, Mahmoud A, Alasmari A, Kamsteeg E-J, Alfadhel M (2016). Loss-of-function mutation in RUSC2 causes intellectual disability and secondary microcephaly. Dev Med Child Neurol 58, 1317–1322. - PubMed
    1. Bayer M, Fischer J, Kremerskothen J, Ossendorf E, Matanis T, Konczal M, Weide T, Barnekow A (2005). Identification and characterization of Iporin as a novel interaction partner for rab1. BMC Cell Biol 6, 15. - PMC - PubMed
    1. Behne R, Teinert J, Wimmer M, D’Amore A, Davies AK, Scarrott JM, Eberhardt K, Brechmann B, Chen IP, Buttermore ED, et al. (2020). Adaptor protein complex 4 deficiency: a paradigm of childhood-onset hereditary spastic paraplegia caused by defective protein trafficking. Hum Mol Genet 29, 320–334. - PMC - PubMed
    1. Bejarano E, Murray JW, Wang X, Pampliega O, Yin D, Patel B, Yuste A, Wolkoff AW, Cuervo AM (2018). Defective recruitment of motor proteins to autophagic compartments contributes to autophagic failure in aging. Aging Cell 17, e12777. - PMC - PubMed

Publication types

MeSH terms

LinkOut - more resources