. 2021 Sep 20;49(16):9174-9193.
doi: 10.1093/nar/gkab690.

Formation of artificial chromosomes in Caenorhabditis elegans and analyses of their segregation in mitosis, DNA sequence composition and holocentromere organization

Affiliations

Formation of artificial chromosomes in Caenorhabditis elegans and analyses of their segregation in mitosis, DNA sequence composition and holocentromere organization

Zhongyang Lin et al. Nucleic Acids Res. .

Abstract

To investigate how exogenous DNA concatemerizes to form episomal artificial chromosomes (ACs), acquire equal segregation ability and maintain stable holocentromeres, we injected DNA sequences with different features, including sequences that are repetitive or complex, and sequences with different AT-contents, into the gonad of Caenorhabditis elegans to form ACs in embryos, and monitored AC mitotic segregation. We demonstrated that AT-poor sequences (26% AT-content) delayed the acquisition of segregation competency of newly formed ACs. We also co-injected fragmented Saccharomyces cerevisiae genomic DNA, differentially expressed fluorescent markers and ubiquitously expressed selectable marker to construct a less repetitive, more complex AC. We sequenced the whole genome of a strain which propagates this AC through multiple generations, and de novo assembled the AC sequences. We discovered CENP-AHCP-3 domains/peaks are distributed along the AC, as in endogenous chromosomes, suggesting a holocentric architecture. We found that CENP-AHCP-3 binds to the unexpressed marker genes and many fragmented yeast sequences, but is excluded in the yeast extremely high-AT-content centromeric and mitochondrial DNA (> 83% AT-content) on the AC. We identified A-rich motifs in CENP-AHCP-3 domains/peaks on the AC and on endogenous chromosomes, which have some similarity with each other and similarity to some non-germline transcription factor binding sites.


Figures

Figure 1.
Figure 1.
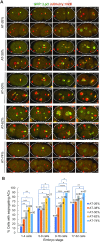
The relationship between AT-contents of injected DNA sequences and AC segregation rates. Ten 1.2-kb long, random sequences were synthesized for each AT-content, including 26% AT, 38% AT, 50% AT, 62% AT and 74% AT. Each sequence has a 18-bp LacI binding site, the LacO sequence (AATTGTGAGCGCTCACAA), at both ends. The 10 random sequences with a specific AT% were combined, and injected as a mix at 100 ng/μl. (A) Representative embryos expressing GFP::LacI (green) and mCherry::H2B (red) and carrying ACs with different AT% are shown by live-cell time-lapse imaging. Double yellow arrowheads point to the AC undergoing segregation (either lagging or successfully segregated) from 1-cell to 4-cell stage. The time (mm:ss) is indicated on the top right of images. Scale bar represents 5 μm. (B) Quantification of the percentage of cells with segregating ACs, among all dividing cells containing ACs, after injection of synthetic DNA fragment pools with different AT-contents. The number of cells (n) analyzed was indicated. Fisher's exact test was used to test for significance. *P < 0.05, **P < 0.01, ***P < 0.001 and ****P < 0.0001.
Figure 2.
Figure 2.
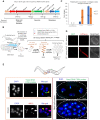
Construction of a complex, propagated artificial chromosome in C. elegans using fragmented yeast genomic DNA and marker genes. (A) A schematic map of the co-injection markers, NeoR, gfp::h2b, and mCherry (NGM), PCR-amplified from plasmid WYYp228. The purified PCR product (0.5 ng/μl) was used in the co-injection mix with fragmented yeast genomic DNA (150 ng/μl). The antibiotic resistance gene (NeoR) is driven by the ubiquitous rps-27 promoter. gfp::h2b is driven by the germline mex-5 promoter, and mCherry is driven by the somatic, body wall muscle myo-3 promoter. The scale bar (in bp) is shown. (B) A schematic diagram of the experimental approach used to generate and select a complex, propagated artificial chromosome in C. elegans for downstream whole-genome sequencing and chromatin immunoprecipitation followed by sequencing analysis (ChIP-seq). (C) Quantification of a unique endogenous locus on Chromosome II (9565795:9565963), mCherry marker, and yeast rDNA copy number in strains (L2.1 and L2.2) with an AC by quantitative PCR. L2.1 and L2.2 are different F2 progenies from the same F1 produced by an injected worm. Genomic DNA was obtained from dauer worms on starved plates. The gene copy number is normalized to the unique endogenous locus, which is assumed to have two copies (before DNA replication) in the diploid organism. Error bars indicate 95% confidence interval (CI) for the mean. (D) Representative marker gene expression in embryos and adult worms from strain L2.1. (E) The propagated AC (yellow arrowhead) was stained in oocytes and embryos by FISH probes made from yeast genomic DNA. The AC, often smaller than the endogenous chromosomes, lacks AIR-2 signal in the oocytes. DNA was stained by DAPI. In the multi-cell embryos, the propagated ACs aligned at the metaphase plate and segregated with endogenous chromosomes in anaphase and telophase. Scale bar represents 2 and 5 μm in the oocytes and embryos, respectively.
Figure 3.
Figure 3.
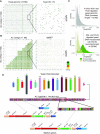
De novo assembly results suggested that this AC is mostly formed by random non-homologous end-joining of the injected fragmented yeast genomic DNA and the NGM markers. (A) Whole genome alignment of assembled AC contigs to the yeast genome (Chromosome I to XVI) shows that the sequence of each contig is a random combination of short DNA fragments from different yeast chromosomes. The alignment between the largest contig tig8258 and yeast chromosome XV is magnified on the right. (B) Self-alignment of the contigs of the assembled AC shows that some short sequences are incorporated multiple times in different or the same contig. The alignment between the largest contig tig8528 and another contig tig8267 is magnified on the right. (C) Upper panel: a histogram plot of the DNA fragment lengths distribution density from in silico AfaI- and PvuII-digested budding yeast genome (summed-length 12 Mb). Bottom panel: histogram plots of the sequence length distribution density of sequences incorporated into the AC (summed-length ∼4.32 Mb, corresponding to larger fragments) and sequences that did not incorporate into the AC (summed-length ∼7.79 Mb, corresponding to smaller fragments). Dashed lines indicate the mean lengths. (D) A schematic representation of the distribution of yeast sequence fragments and the co-injection markers NGM (Prps-27::NeoR::unc-54 3′ UTR; Pmex5::gfp::tbb-2 3′ UTR; Pmyo-3::mCherry:: unc-54 3′ UTR) on the largest assembled contig tig8258. DNA fragments belong to individual yeast chromosomes and NGM marker genes are indicated by different colors. The full NGM marker sequences, or fragments inserted are shown in details below.
Figure 4.
Figure 4.
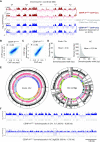
The CENP-AHCP-3 domains/peaks on the endogenous chromosomes and on the prorogated AC. (A) Representative enrichment of CENP-AHCP-3 and CENP-AHCP-3 domains/peaks on chromosome I by current ChIP-seq replicates and previous ChIP-chip replicates. (B) The localization of CENP-AHCP-3 enrichment on endogenous chromosomes between two ChIP-seq replicates are highly correlated. (C) The localization of CENP-AHCP-3 enrichment on endogenous chromosomes detected by ChIP-seq is highly correlated to previous ChIP-chip results (18). The signal for each data set represents the average of two independent replicates. (D) Histogram plots of CENP-AHCP-3 domain/peak sizes in endogenous chromosomes (left panel) and in AC (right panel). (E) Circos plot of CENP-AHCP-3 domains/peaks on all endogenous chromosomes (left panel) and on all 49 AC contigs, including the longest contig tig8258 (right panel). The outside circle shows the CENP-AHCP-3 domains/peaks called by MACS2. Y-axis is the signal value (overall enrichment) for the domains/peaks. The inside circle indicate the CENP-AHCP-3 domains/peaks density in 10-kb windows. (F) Representative CENP-AHCP-3 enrichment in a 800-kb region in endogenous Chromosome II (7200–8000 kb) and in AC contig tig8258 (200–1000 kb). CENP-AHCP-3 domains/peaks were indicated as grey bars. The dashed box (1 319 126–1 347 939 bp) indicates the region enriched with yeast mitochondrial DNA (the zoom-in is shown in Figure 5A). (G) Dot plots of AT-content (%) of each CENP-AHCP-3 domain/peak against its size in endogenous chromosomes (left panel) and in AC (right panel). The 2D density plots were indicated by contour lines (bin = 7). The linear regression line to the scatter plot model was shown with 95% confidence region (grey shading). The average C. elegans genomic and AC AT-contents are indicated by the blue dotted lines, respectively. (H) The empirical cumulative distribution functions (ECDF) of interval distances between CENP-AHCP-3 domains/peaks on endogenous chromosomes (blue) and AC (red). (I) The CENP-AHCP-3 enrichment profiles and heatmaps of the 2-kb flanking regions surrounding the center of each CENP-AHCP-3 domain/peak for endogenous chromosomes and AC. Consensus CENP-AHCP-3 domains/peaks are separated into four clusters by k-means clustering. The profile plots (upper panel) show the average ChIP signals of each cluster. The ChIP signals of each domain/peak are shown in the clustered heatmaps (lower panel), in which the color coding on the right indicates the log2 CENP-AHCP-3 ratio. The schematic on the left and right show the possible distribution of CENP-AHCP-3 nucleosomes interspaced in between H3 nucleosomes.
Figure 4.
Figure 4.
The CENP-AHCP-3 domains/peaks on the endogenous chromosomes and on the prorogated AC. (A) Representative enrichment of CENP-AHCP-3 and CENP-AHCP-3 domains/peaks on chromosome I by current ChIP-seq replicates and previous ChIP-chip replicates. (B) The localization of CENP-AHCP-3 enrichment on endogenous chromosomes between two ChIP-seq replicates are highly correlated. (C) The localization of CENP-AHCP-3 enrichment on endogenous chromosomes detected by ChIP-seq is highly correlated to previous ChIP-chip results (18). The signal for each data set represents the average of two independent replicates. (D) Histogram plots of CENP-AHCP-3 domain/peak sizes in endogenous chromosomes (left panel) and in AC (right panel). (E) Circos plot of CENP-AHCP-3 domains/peaks on all endogenous chromosomes (left panel) and on all 49 AC contigs, including the longest contig tig8258 (right panel). The outside circle shows the CENP-AHCP-3 domains/peaks called by MACS2. Y-axis is the signal value (overall enrichment) for the domains/peaks. The inside circle indicate the CENP-AHCP-3 domains/peaks density in 10-kb windows. (F) Representative CENP-AHCP-3 enrichment in a 800-kb region in endogenous Chromosome II (7200–8000 kb) and in AC contig tig8258 (200–1000 kb). CENP-AHCP-3 domains/peaks were indicated as grey bars. The dashed box (1 319 126–1 347 939 bp) indicates the region enriched with yeast mitochondrial DNA (the zoom-in is shown in Figure 5A). (G) Dot plots of AT-content (%) of each CENP-AHCP-3 domain/peak against its size in endogenous chromosomes (left panel) and in AC (right panel). The 2D density plots were indicated by contour lines (bin = 7). The linear regression line to the scatter plot model was shown with 95% confidence region (grey shading). The average C. elegans genomic and AC AT-contents are indicated by the blue dotted lines, respectively. (H) The empirical cumulative distribution functions (ECDF) of interval distances between CENP-AHCP-3 domains/peaks on endogenous chromosomes (blue) and AC (red). (I) The CENP-AHCP-3 enrichment profiles and heatmaps of the 2-kb flanking regions surrounding the center of each CENP-AHCP-3 domain/peak for endogenous chromosomes and AC. Consensus CENP-AHCP-3 domains/peaks are separated into four clusters by k-means clustering. The profile plots (upper panel) show the average ChIP signals of each cluster. The ChIP signals of each domain/peak are shown in the clustered heatmaps (lower panel), in which the color coding on the right indicates the log2 CENP-AHCP-3 ratio. The schematic on the left and right show the possible distribution of CENP-AHCP-3 nucleosomes interspaced in between H3 nucleosomes.
Figure 5.
Figure 5.
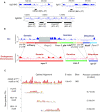
The CENP-AHCP-3 distribution pattern on the propagated AC. (A) CENP-AHCP-3 does not localize on the yeast centromeric sequences, CEN4 and CEN10, and yeast mitochondrial DNA (MT) (the dashed box in Figure 4F) in the propagated AC. CENP-AHCP-3 domains were indicated as grey bars. (B) The log2 CENP-AHCP-3 ratio on marker genes is averaged from 10–29 copies (Supplementary Table S9). CENP-AHCP-3 on the AC is enriched in the somatic mCherry marker, partially excluded in the silenced germline gfp::h2b region, and excluded in the ubiquitous NeoR drug resistance gene marker. The corresponding endogenous genes with the same promoters were analyzed and shown in parallel. Non-distinguishable reads that mapped to both endogenous and AC promoter or 3′ UTR regions were excluded from the analysis and the region with all reads removed was shaded. (C) The sequence of a 29-bp CENP-AHCP-3 motif: AAAARRAARARAADVAAAAAAARARRAAA, is identified at 965 sites on the AC, where R represents A or G; D represents A or G or T; V represents A or C or G. The e-value estimates the expected occurrence of motifs with the same size and frequency in a similarly sized set of random sequences. Toggle error bars indicate the confidence level of a motif based on the number of sites used in its creation. The motifs found in the UniPROBE database with a significant match to the CENP-AHCP-3 motif on the AC are shown. The P-value indicates the significance of the similarity between CENP-AHCP-3 motif and TF motif.
Figure 6.
Figure 6.
A schematic diagram of the holocentromere localization in C. elegans embryos. CENP-AHCP-3 occupancy has an inverse correlation with germline transcription in endogenous chromatin (based on Gassmann et al., 2012 (18), shown on the left top); CENP-AHCP-3 colocalizes with transcription HOT sites, where TFs occupy the centromeric regions after cells exit mitosis or without CENP-AHCP-3 expression, for maintaining the centromere positions (based on Steiner et al. (56), shown on the right); CENP-AHCP-3 was excluded from transcription active regions that are preferably bound by TFs that are highly expressed in germline, but CENP-AHCP-3 can occupy the transcriptionally inactive regions that are preferably bound by non-germline expressed TFs (based on current study).

Similar articles

Cited by

References

    1. Sirvent N., Forus A., Lescaut W., Burel F., Benzaken S., Chazal M., Bourgeon A., Vermeesch J.R., Myklebost O., Turc-Carel C.et al. .. Characterization of centromere alterations in liposarcomas. Genes Chromosomes Cancer. 2000; 29:117–129. - PubMed
    1. Burrack L.S., Berman J.. Neocentromeres and epigenetically inherited features of centromeres. Chromosome Res. 2012; 20:607–619. - PMC - PubMed
    1. Marshall O.J., Chueh A.C., Wong L.H., Choo K.H.. Neocentromeres: new insights into centromere structure, disease development, and karyotype evolution. Am. J. Hum. Genet. 2008; 82:261–282. - PMC - PubMed
    1. Hahnenberger K.M., Baum M.P., Polizzi C.M., Carbon J., Clarke L.. Construction of functional artificial minichromosomes in the fission yeast Schizosaccharomyces pombe. PNAS. 1989; 86:577–581. - PMC - PubMed
    1. Baker R.E., Rogers K.. Genetic and genomic analysis of the AT-rich centromere DNA element II of Saccharomyces cerevisiae. Genetics. 2005; 171:1463–1475. - PMC - PubMed

Publication types

Substances