. 2021 Sep 29;41(39):8134-8149.
doi: 10.1523/JNEUROSCI.1930-20.2021. Epub 2021 Aug 20.

Tuberous Sclerosis Complex (TSC) Inactivation Increases Neuronal Network Activity by Enhancing Ca2+ Influx via L-Type Ca2+ Channels

Affiliations

Tuberous Sclerosis Complex (TSC) Inactivation Increases Neuronal Network Activity by Enhancing Ca2+ Influx via L-Type Ca2+ Channels

Chihiro Hisatsune et al. J Neurosci. .

Abstract

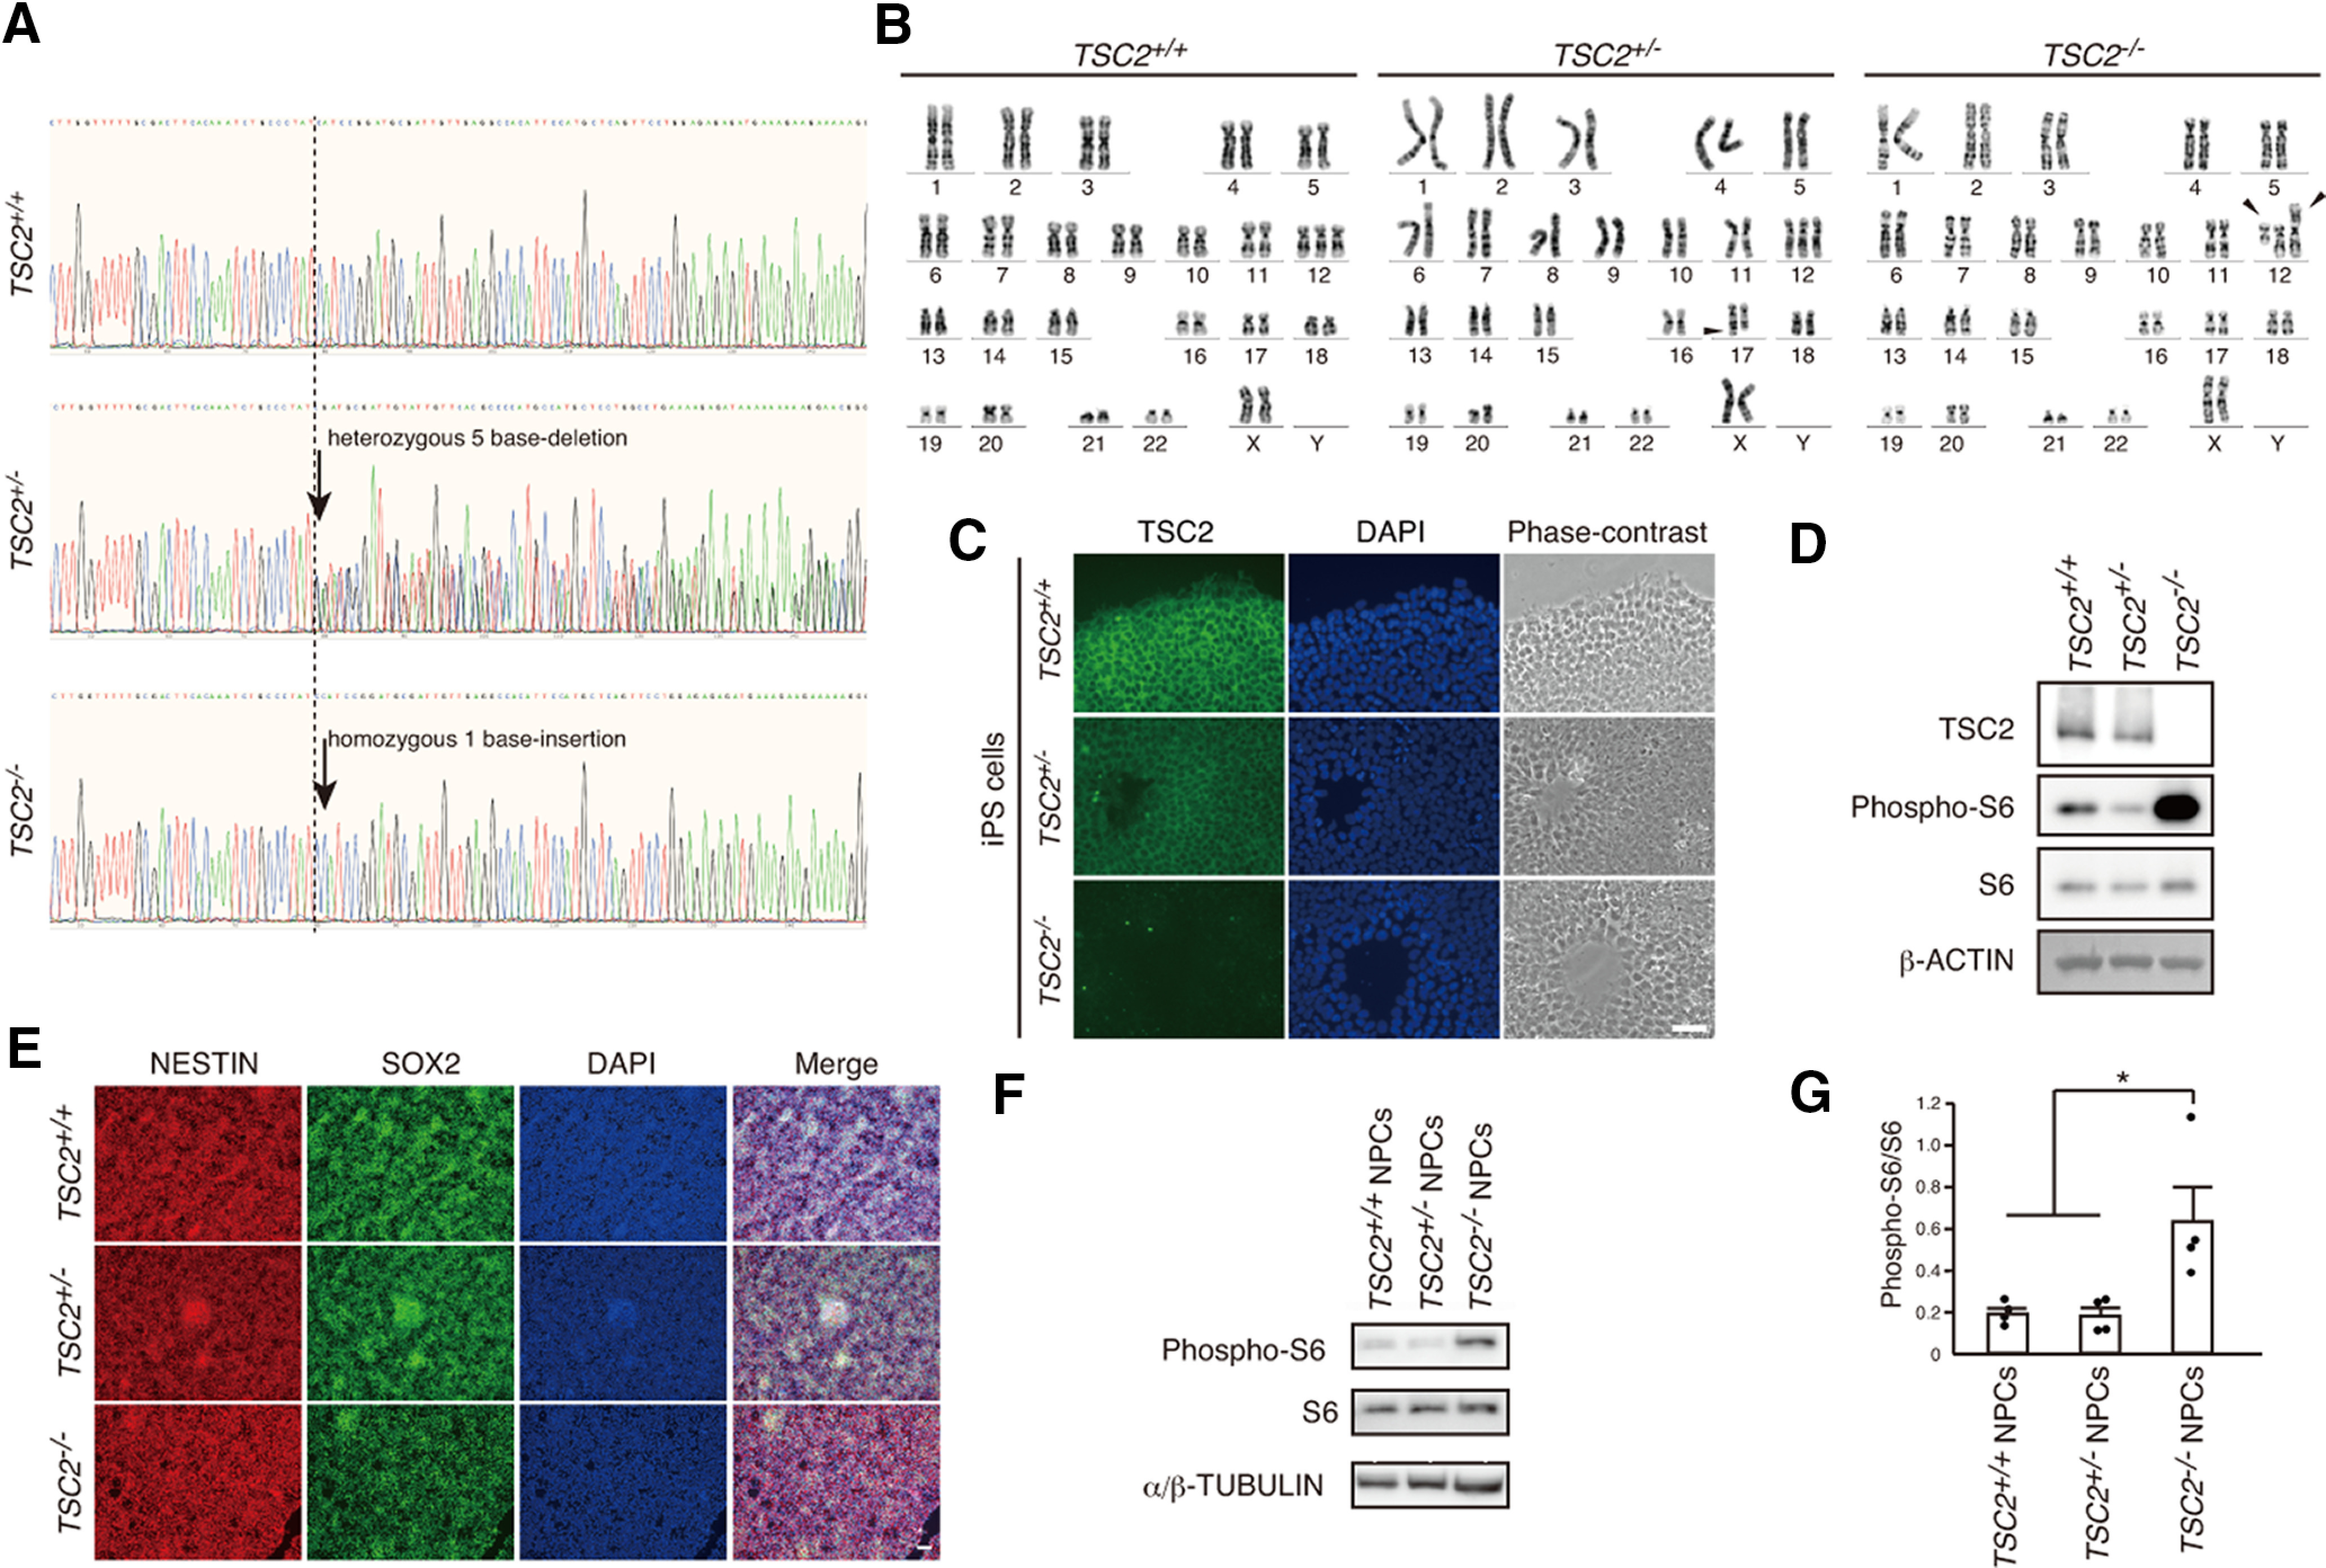
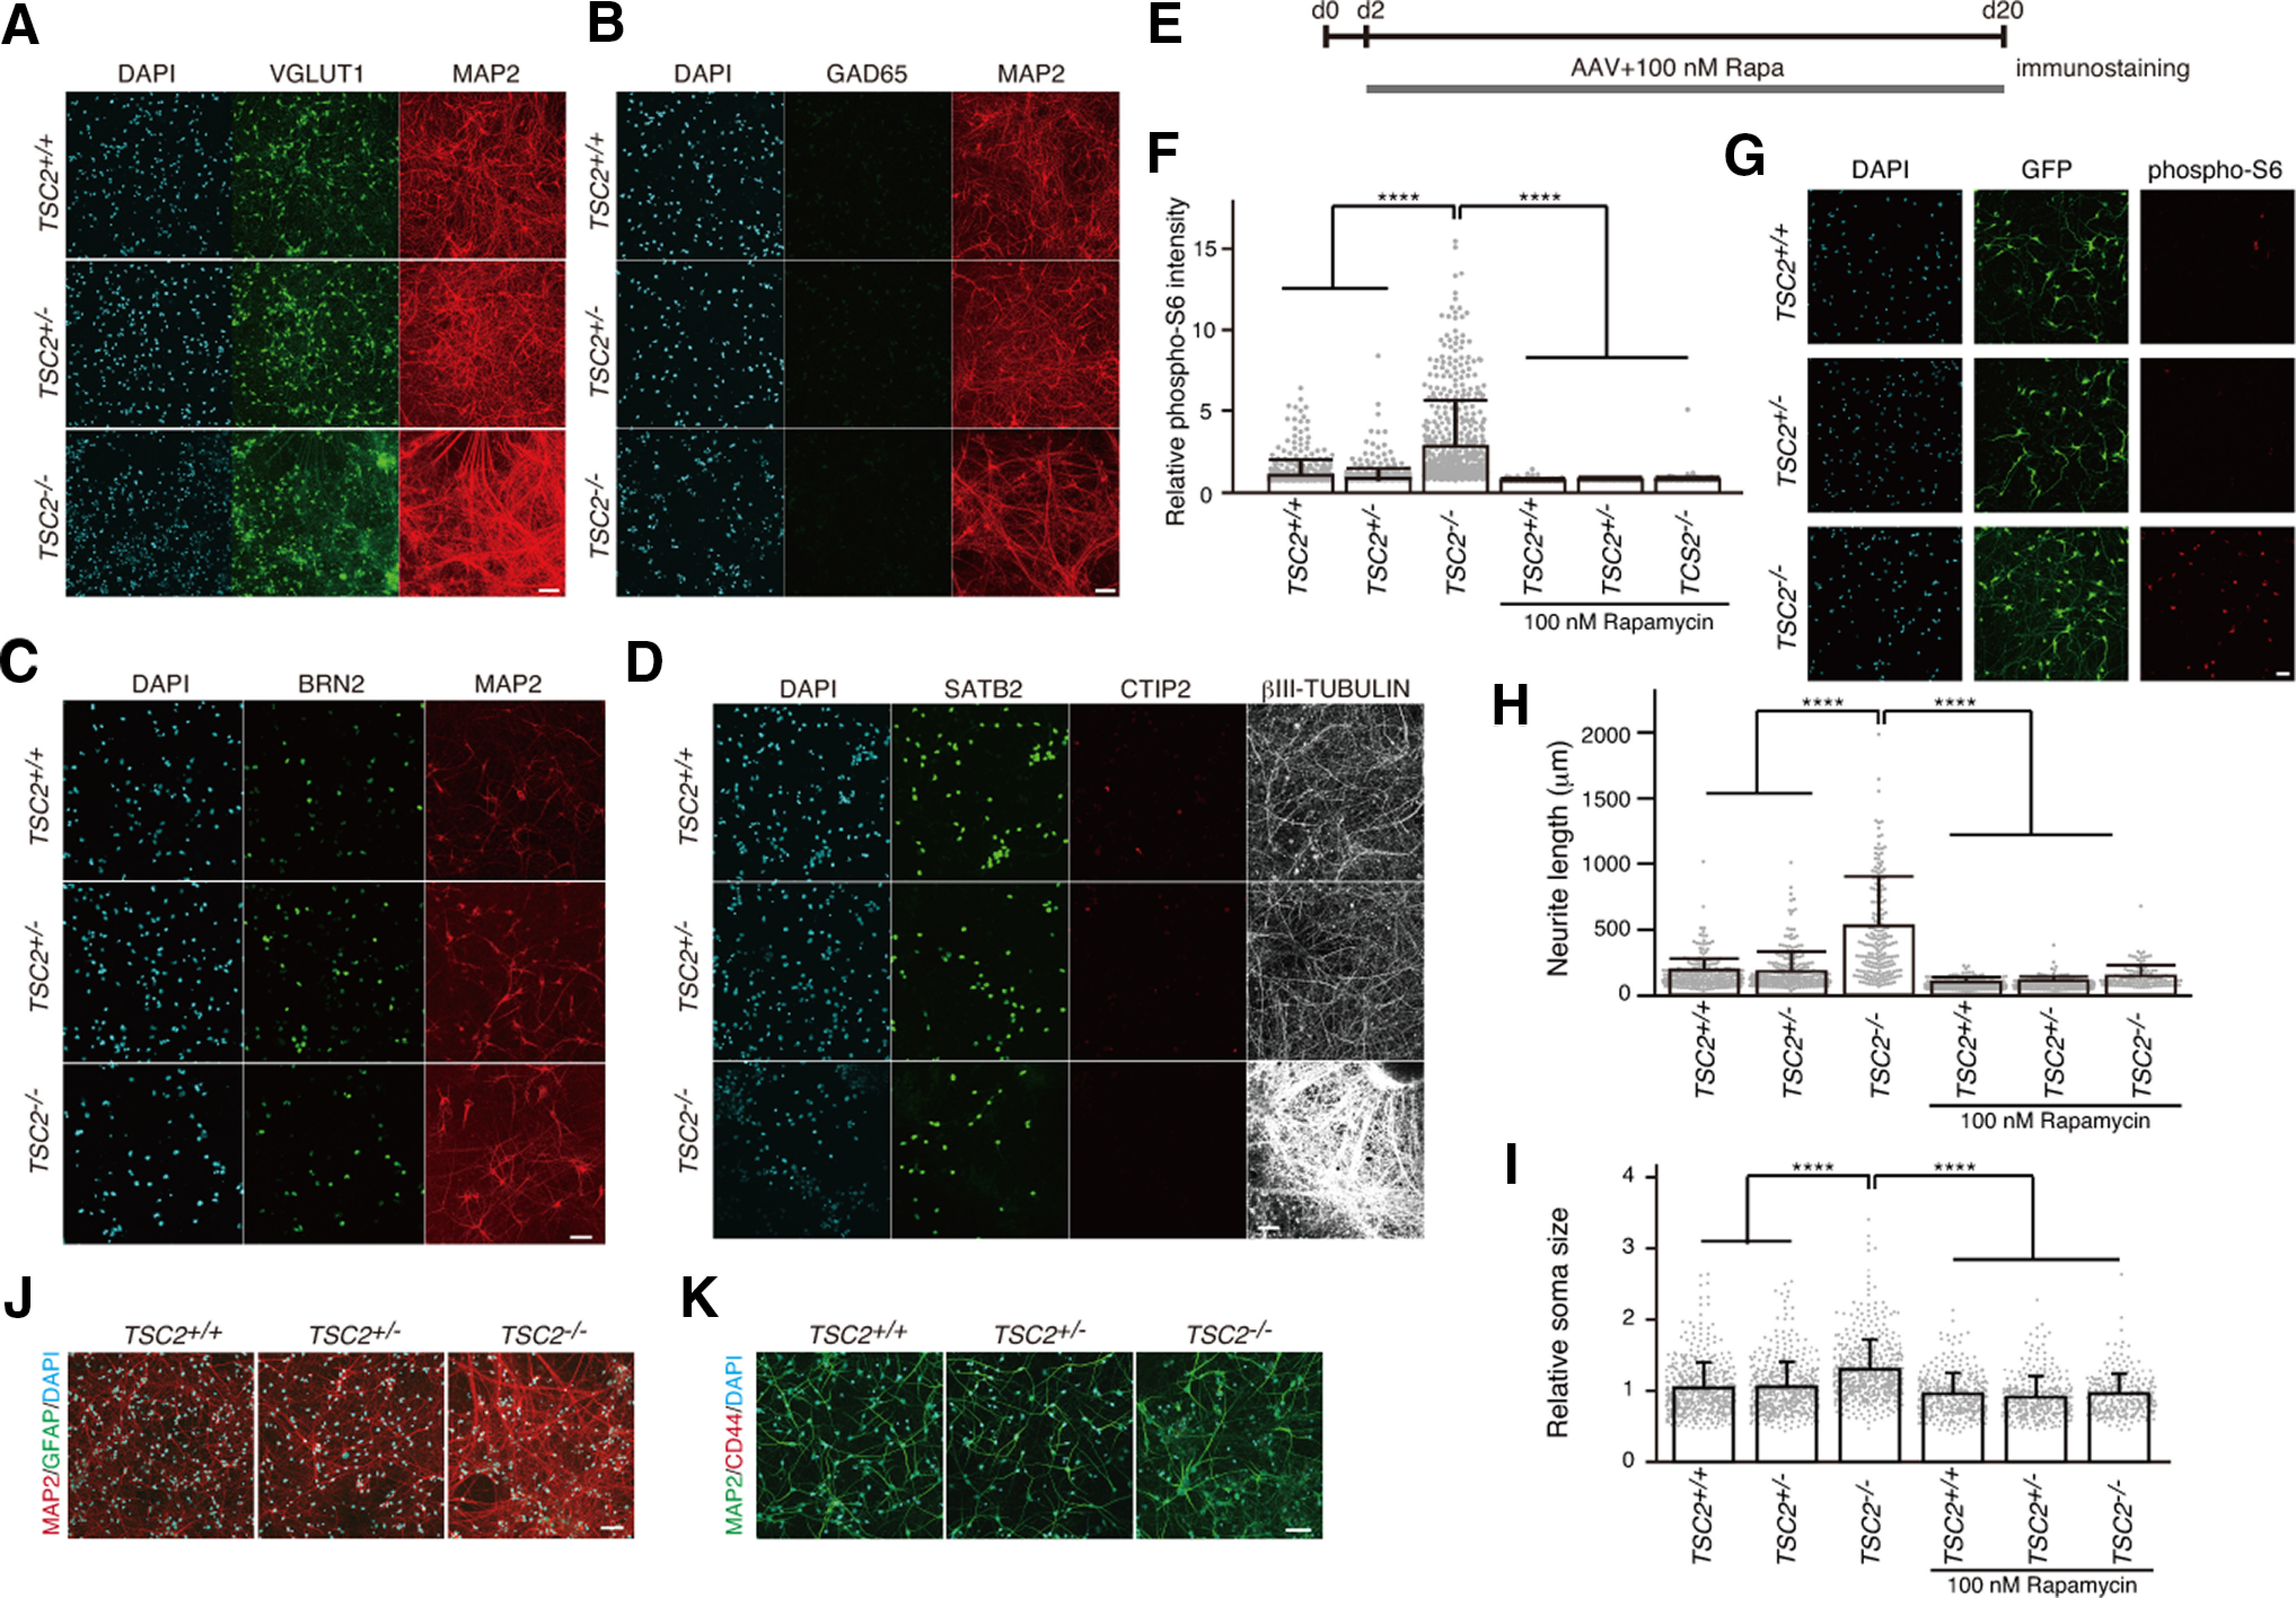
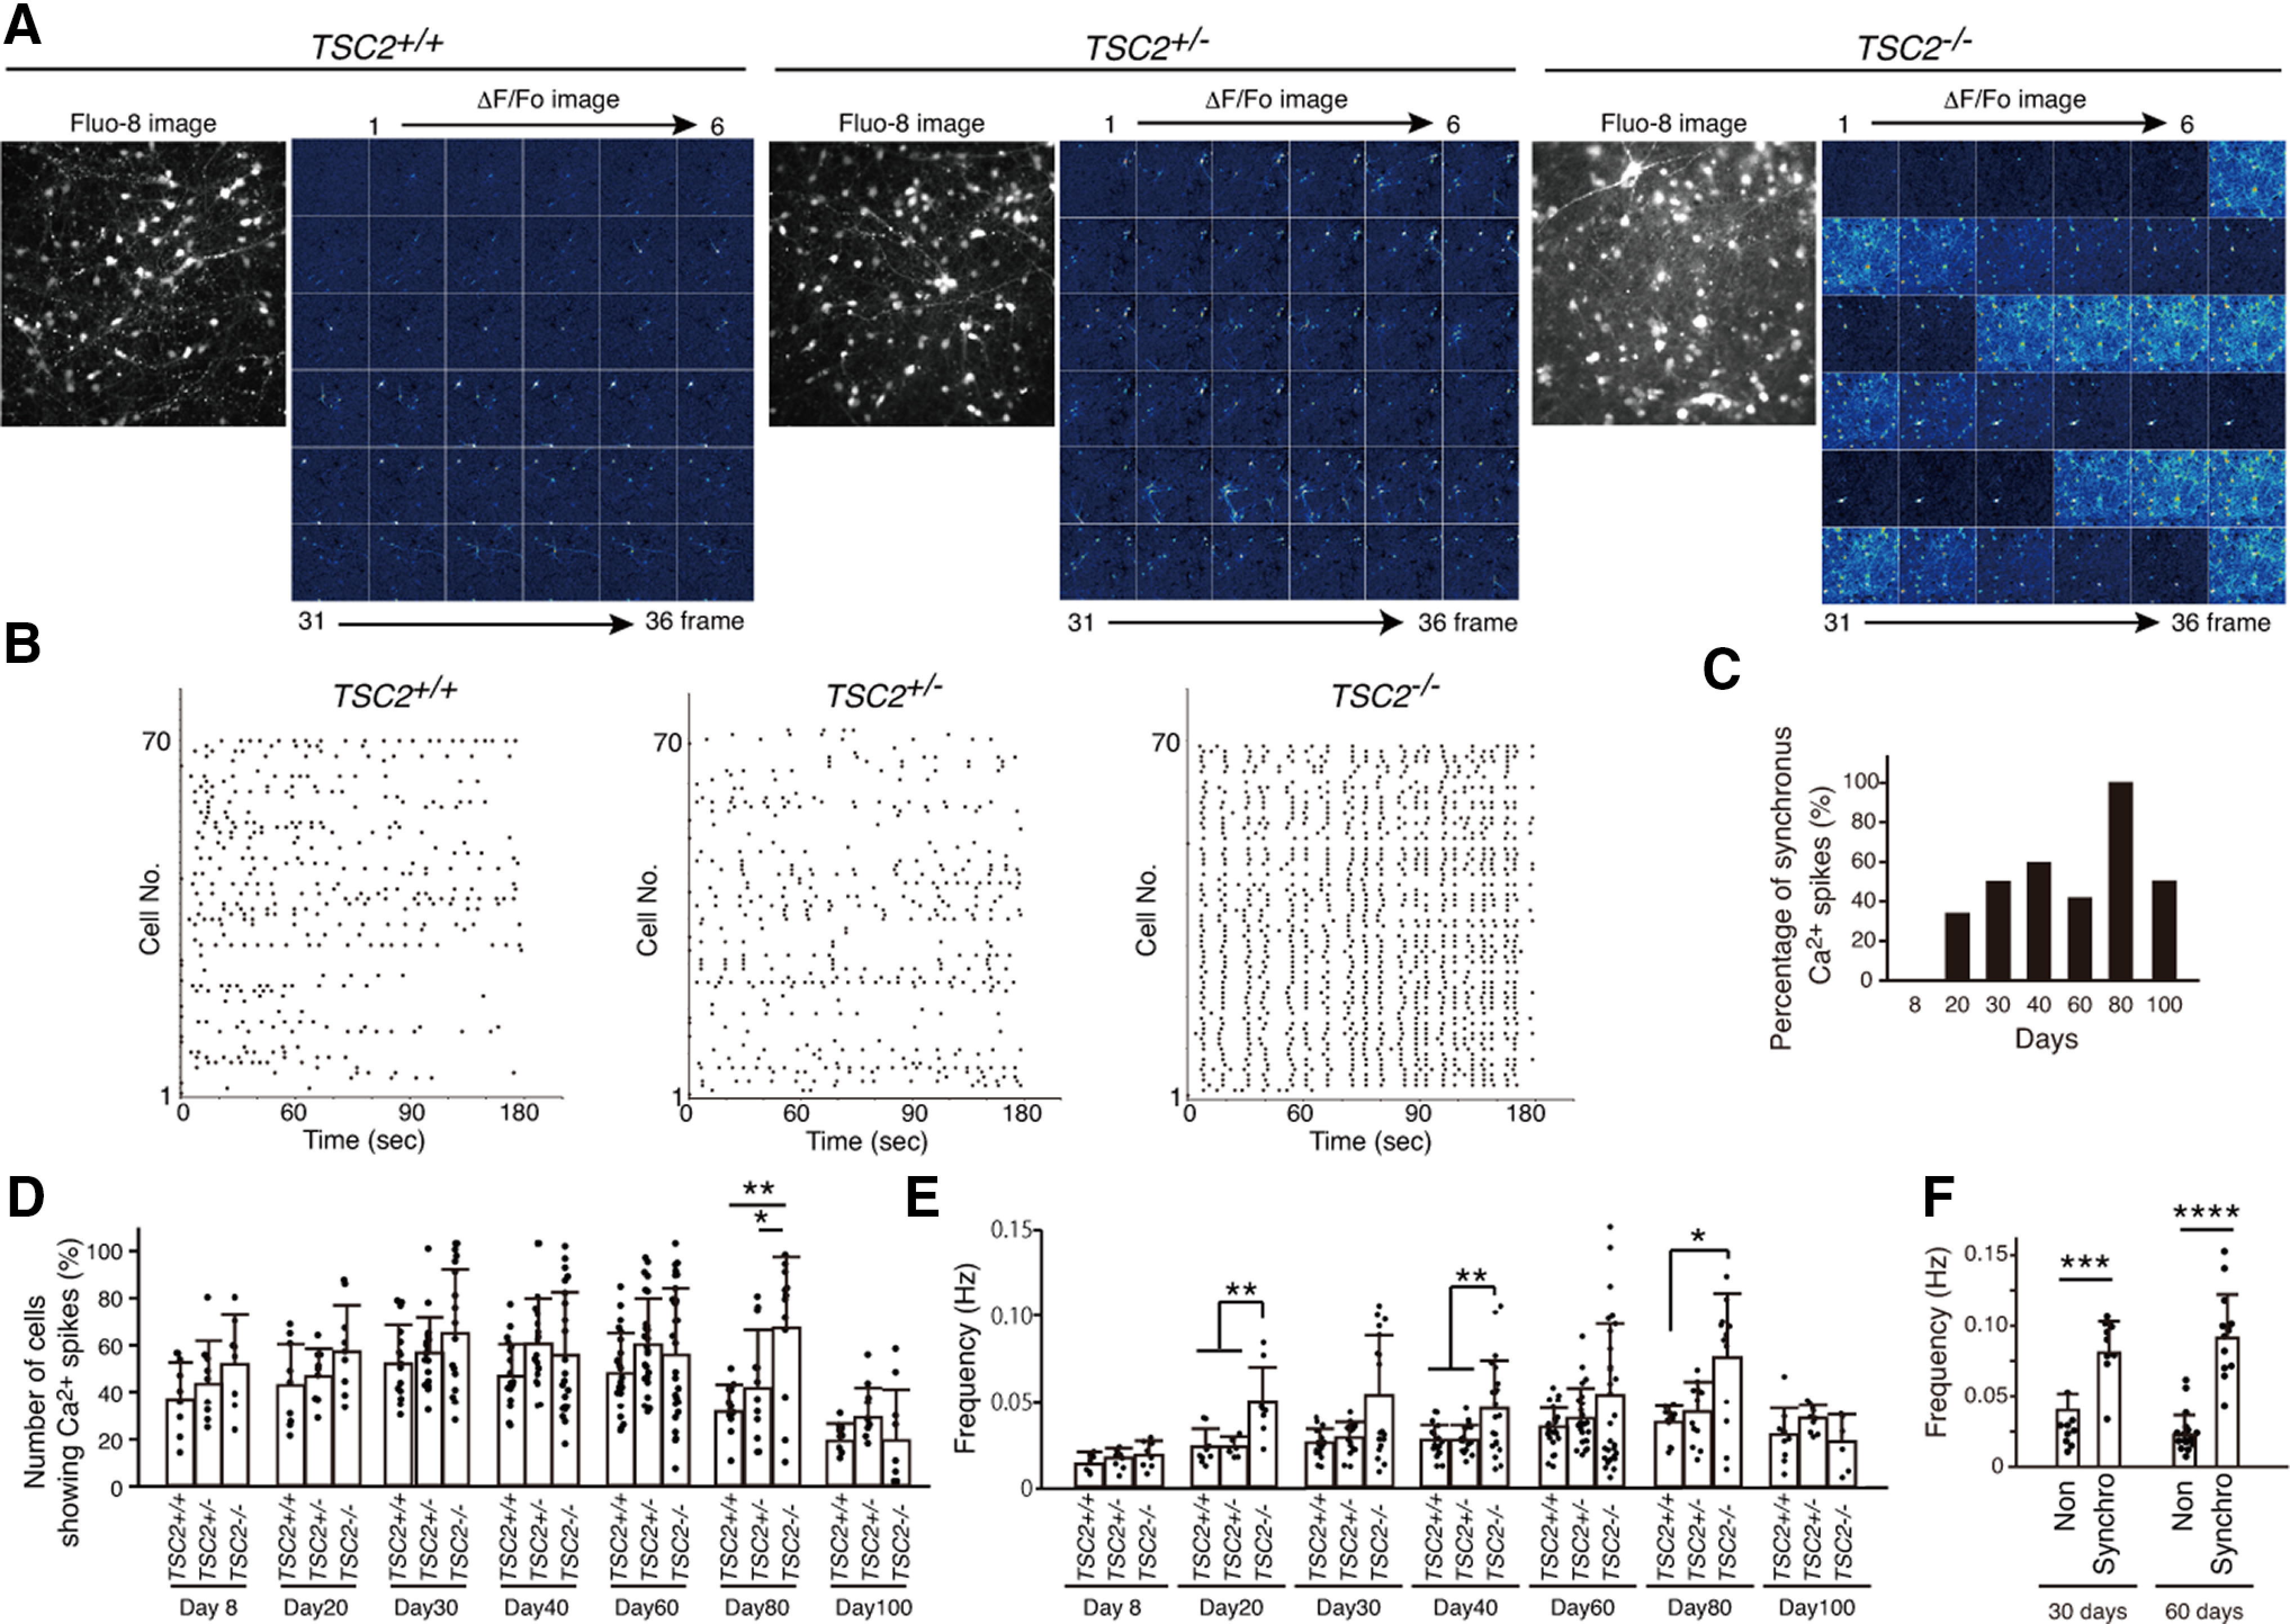
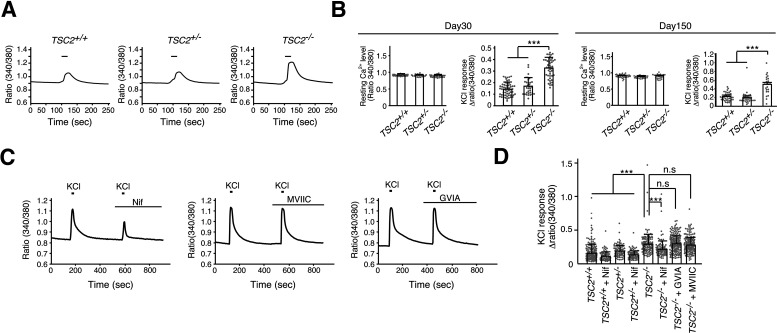
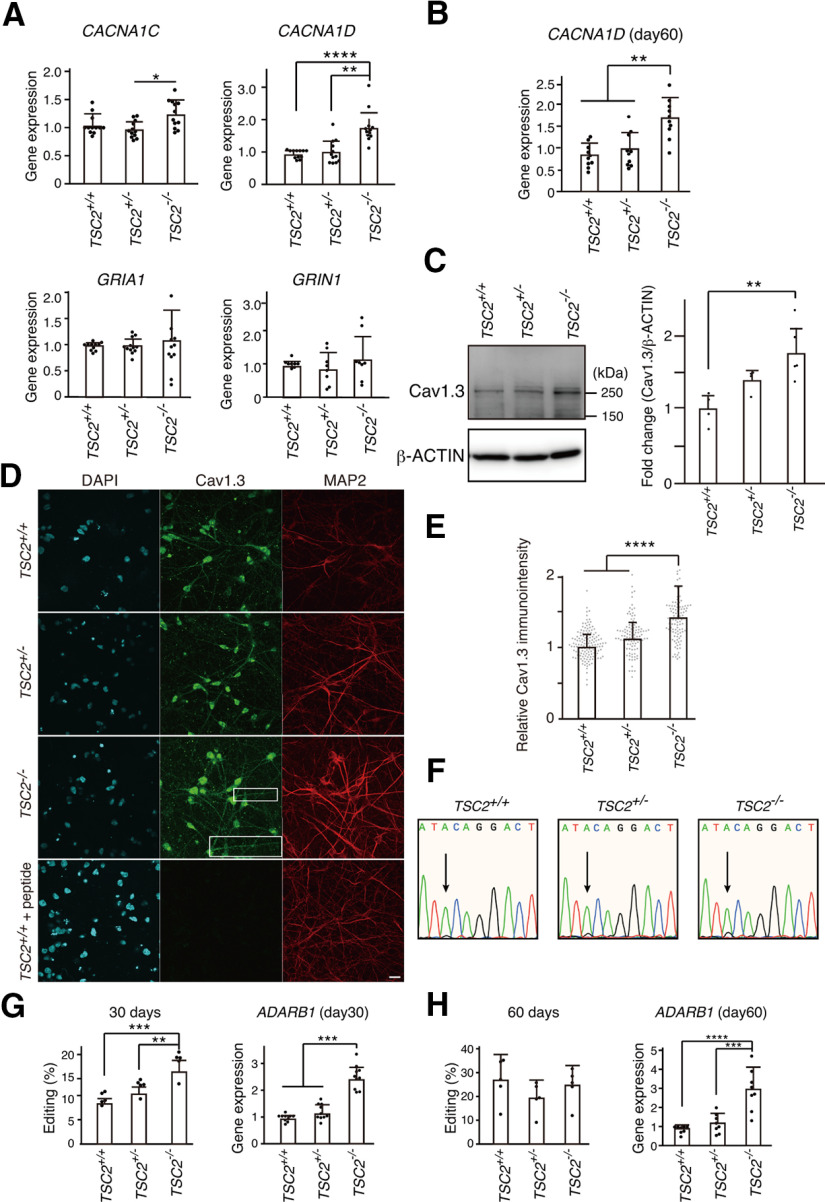
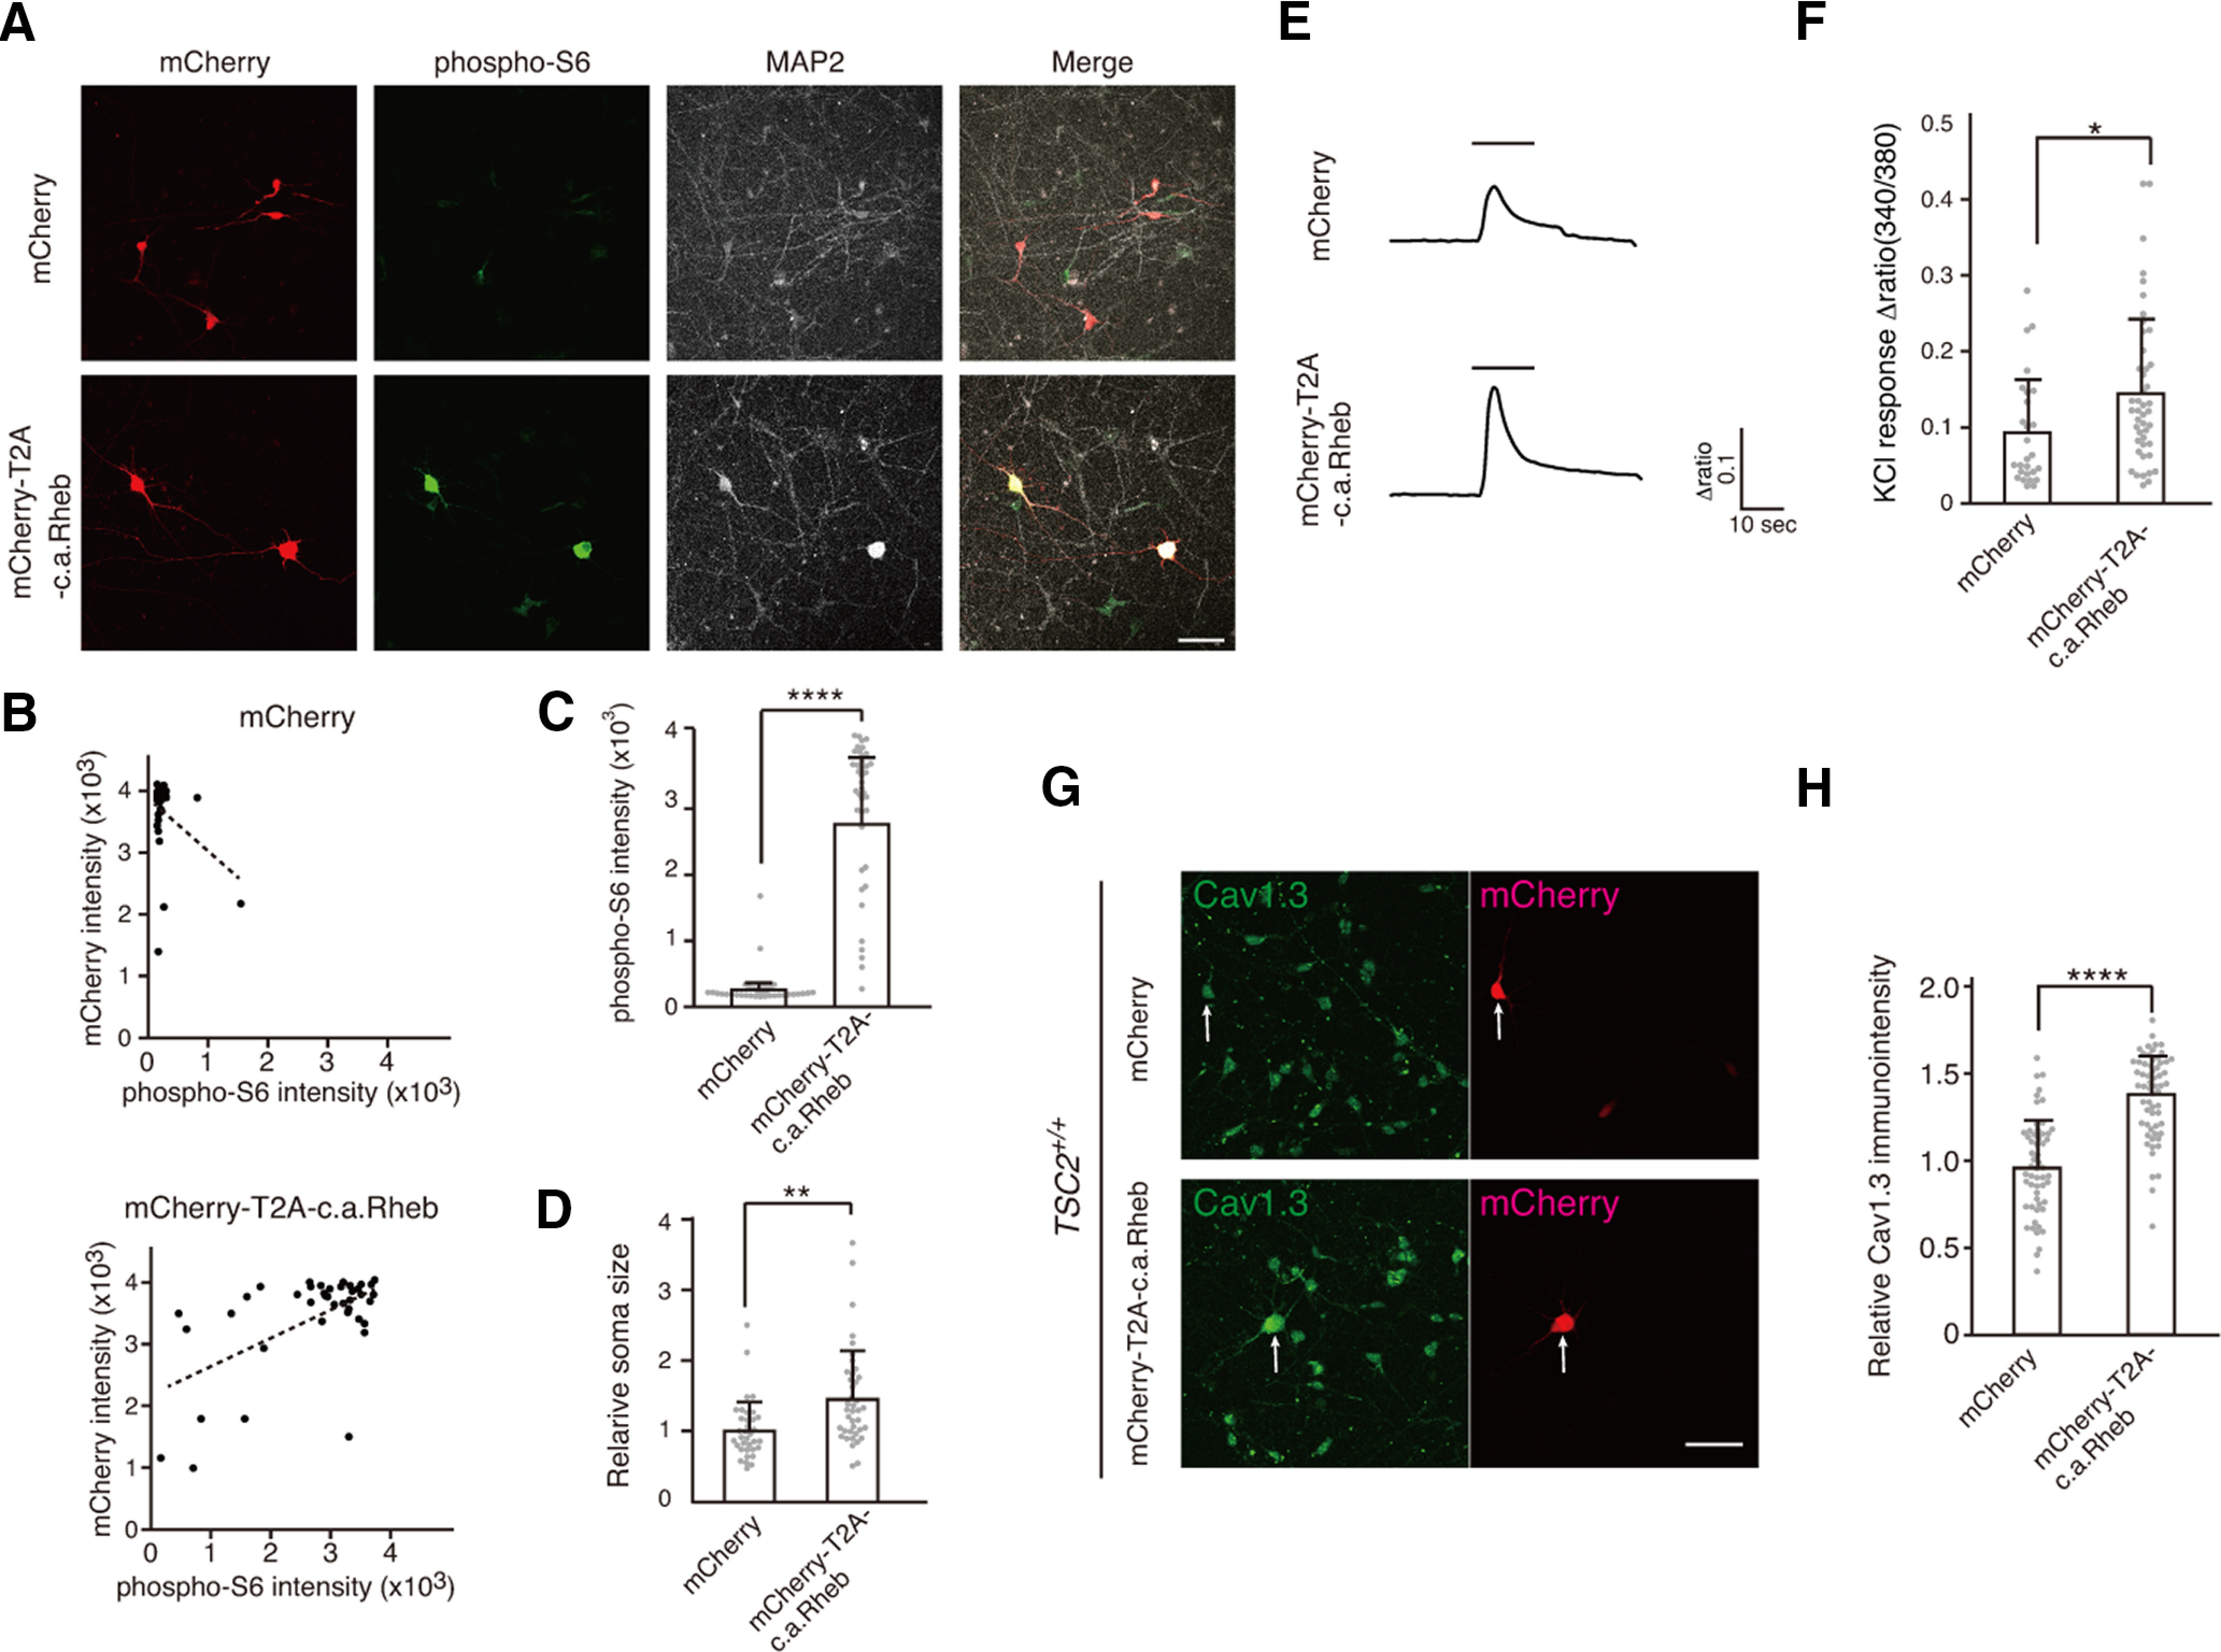
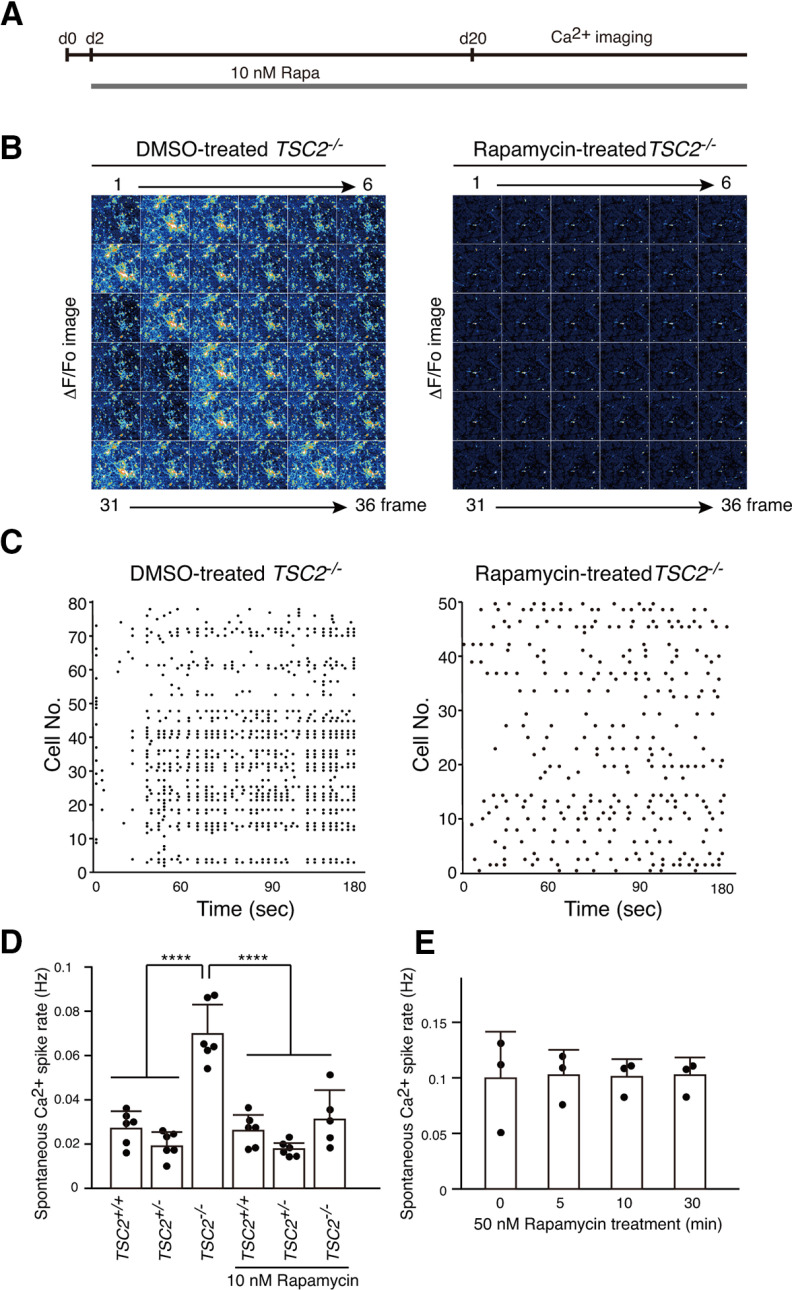
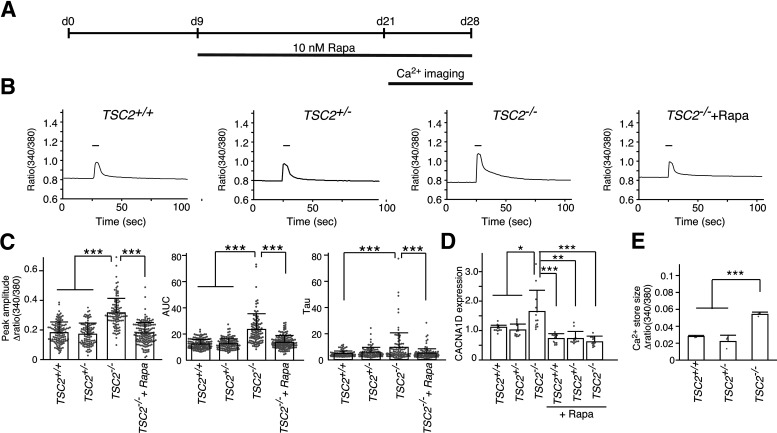
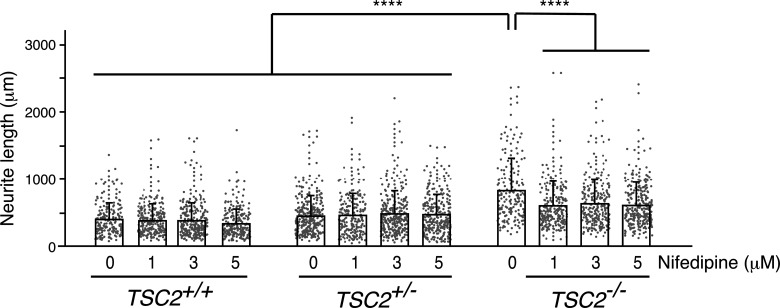
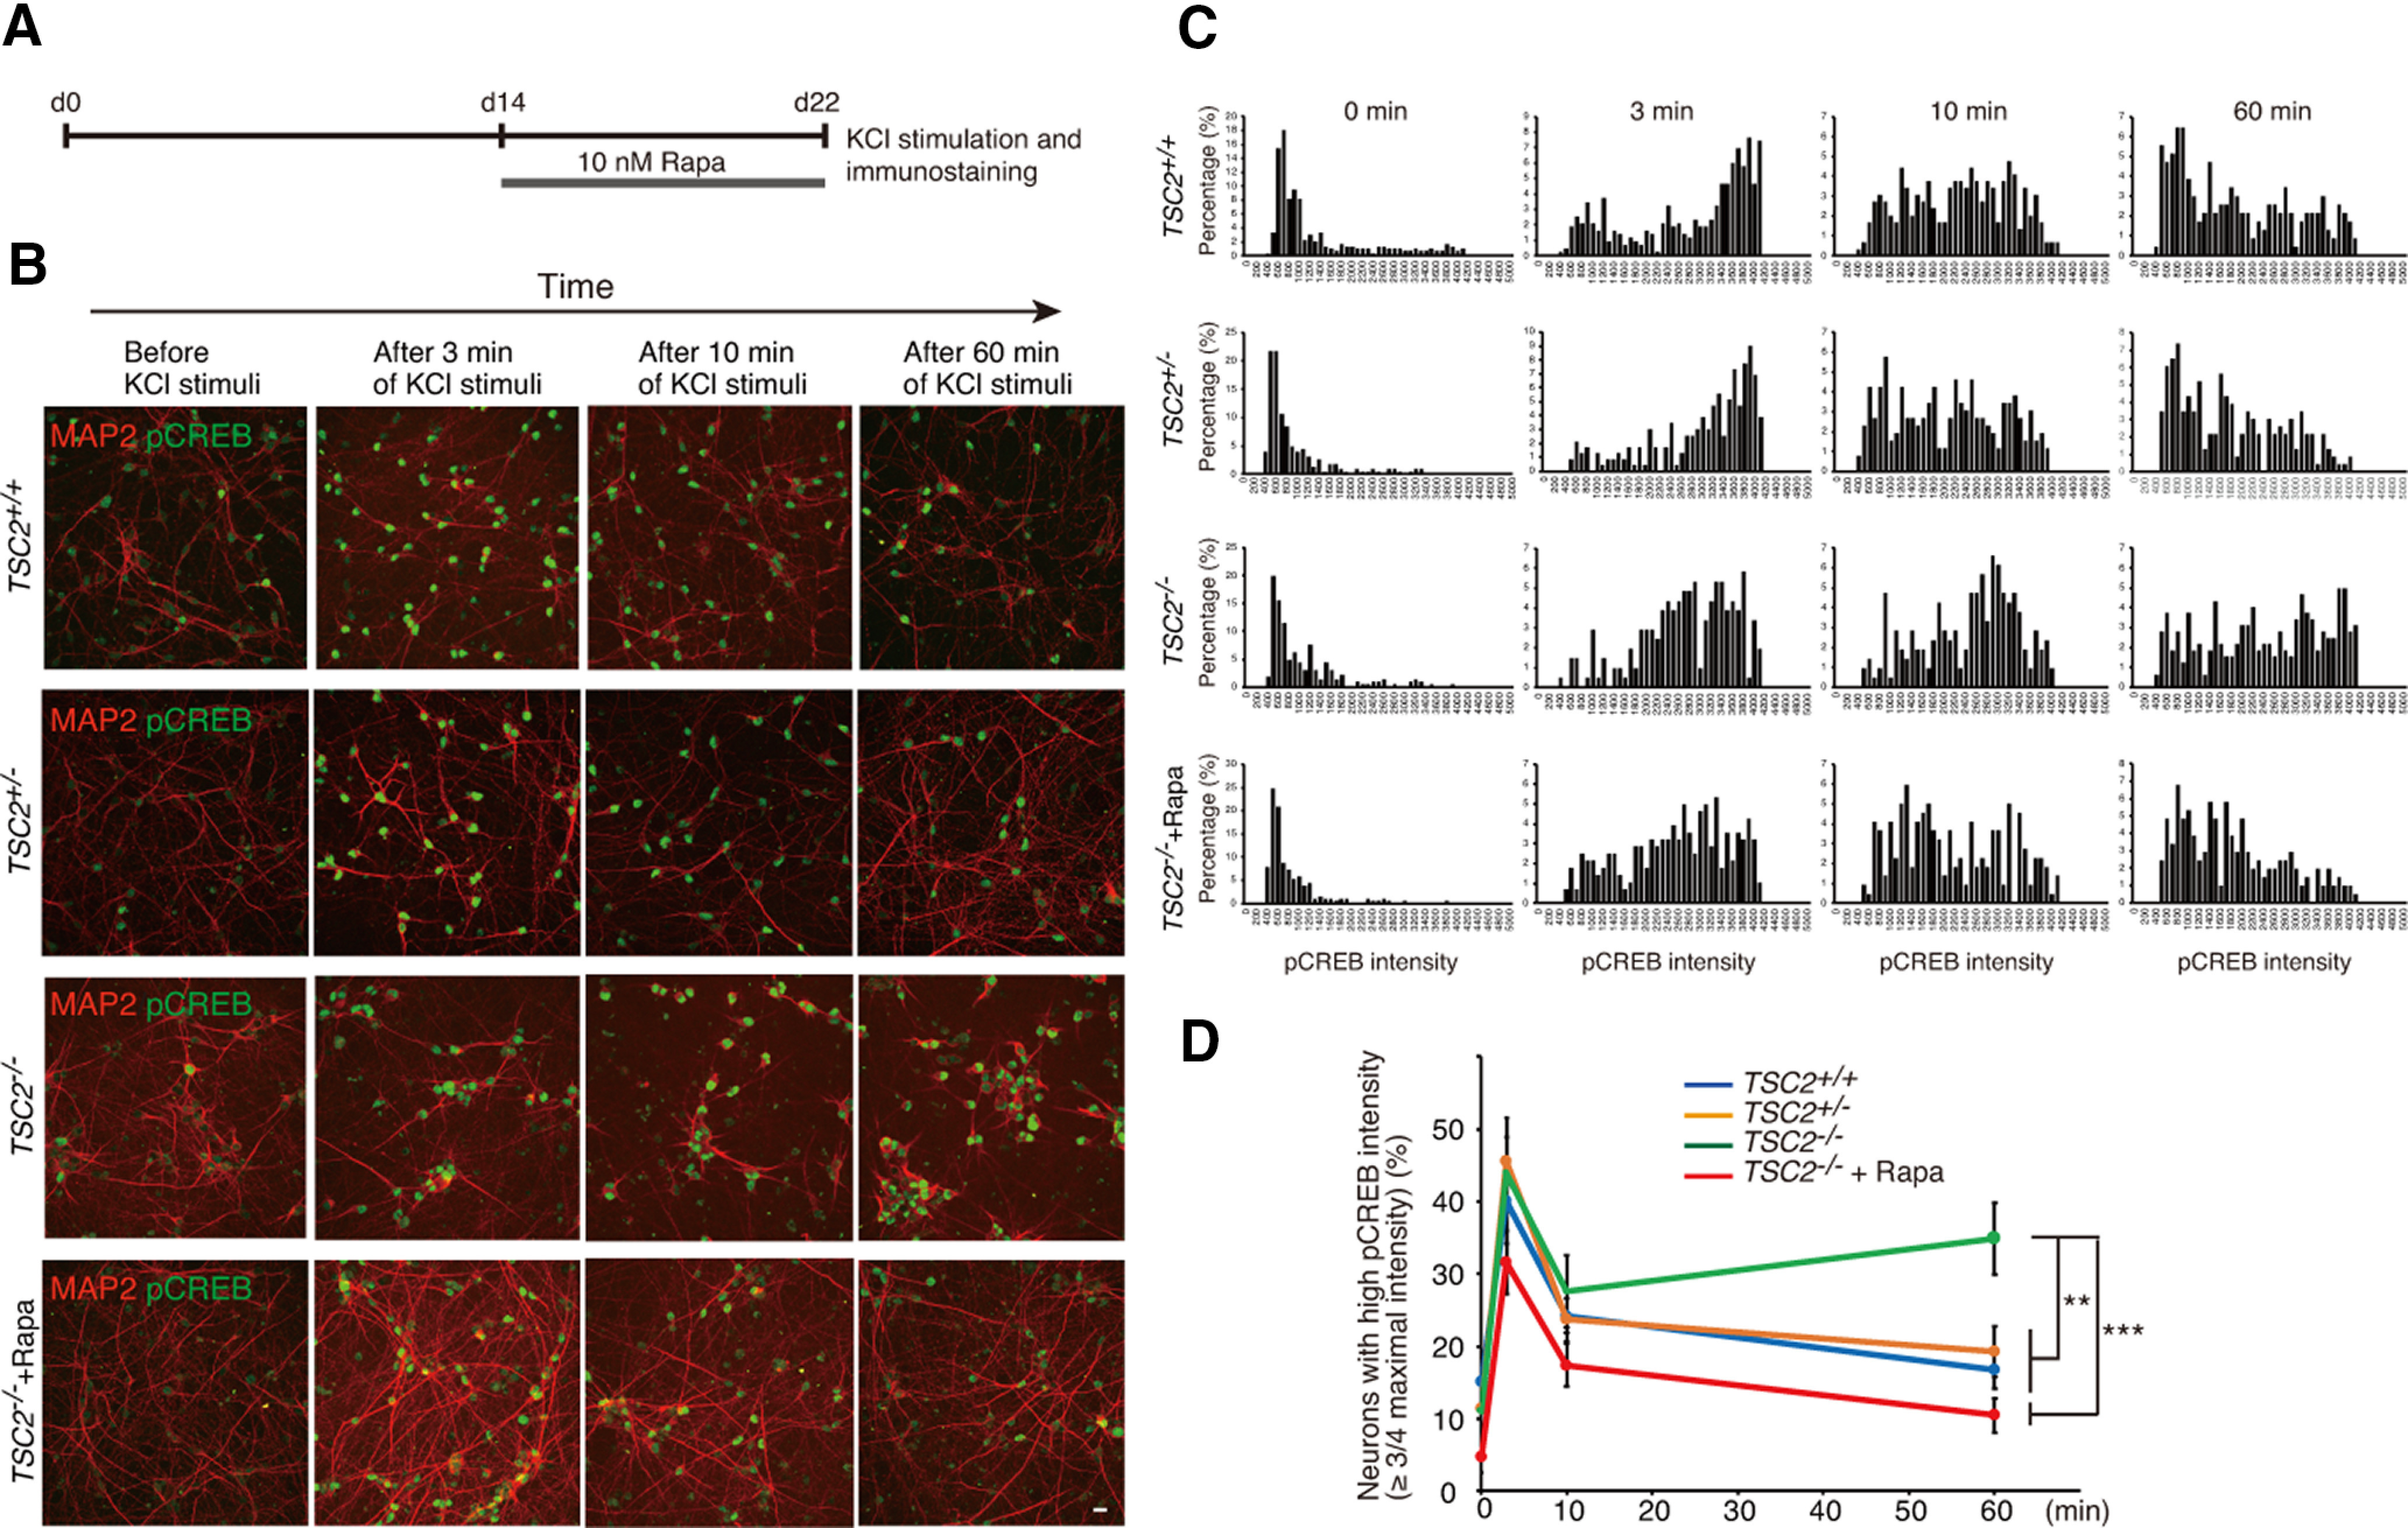
Tuberous sclerosis complex (TSC) is a multisystem developmental disorder characterized by hamartomas in various organs, such as the brain, lungs, and kidneys. Epilepsy, along with autism and intellectual disability, is one of the neurologic impairments associated with TSC that has an intimate relationship with developmental outcomes and quality of life. Sustained activation of the mammalian target of rapamycin (mTOR) via TSC1 or TSC2 mutations is known to be involved in the onset of epilepsy in TSC. However, the mechanism by which mTOR causes seizures remains unknown. In this study, we showed that, human induced pluripotent stem cell-derived TSC2-deficient (TSC2-/-) neurons exhibited elevated neuronal activity with highly synchronized Ca2+ spikes. Notably, TSC2-/- neurons presented enhanced Ca2+ influx via L-type Ca2+ channels (LTCCs), which contributed to the abnormal neurite extension and sustained activation of cAMP response element binding protein (CREB), a critical mediator of synaptic plasticity. Expression of Cav1.3, a subtype of LTCCs, was increased in TSC2-/- neurons, but long-term rapamycin treatment suppressed this increase and reversed the altered neuronal activity and neurite extensions. Thus, we identified Cav1.3 LTCC as a critical downstream component of TSC-mTOR signaling that would trigger enhanced neuronal network activity of TSC2-/- neurons. We suggest that LTCCs could be potential novel targets for the treatment of epilepsy in TSC.SIGNIFICANCE STATEMENT There is a close relationship between elevated mammalian target of rapamycin (mTOR) activity and epilepsy in tuberous sclerosis complex (TSC). However, the underlying mechanism by which mTOR causes epilepsy remains unknown. In this study, using human TSC2-/- neurons, we identified elevated Ca2+ influx via L-type Ca2+ channels as a critical downstream component of TSC-mTOR signaling and a potential cause of both elevated neuronal activity and neurite extension in TSC2-/- neurons. Our findings demonstrate a previously unrecognized connection between sustained mTOR activation and elevated Ca2+ signaling via L-type Ca2+ channels in human TSC neurons, which could cause epilepsy in TSC.

Keywords: LTCC; TSC; calcium; epilepsy; mTOR; rapamycin.


Figures

Figure 1.
Figure 1.
Characterization of TSC2-modified iPSCs and NPCs. A, DNA sequences of exon 3 in the TSC2 gene of TSC2+/+, TSC2+/−, and TSC2−/− iPSCs. TSC2+/− and TSC2−/− iPSCs had a heterozygous 5 base deletion and a homozygous 1 base insertion, respectively, as indicated by the arrows. B, Analysis of karyotypes of TSC2+/+, TSC2+/−, and TSC2−/− iPSCs by G-banding. Middle, Arrowhead indicates addition of an unidentified short fragment to chromosome 17 of TSC2+/− iPSCs. Right, Arrowheads indicate whole-arm translocation between the two copies of chromosome 12 in TSC2−/− iPSCs. C, Immunostaining of TSC2 in TSC2+/+, TSC2+/−, and TSC2−/− iPSCs. Green represents TSC2. Blue represents DAPI. Scale bar, 50 µm. D, TSC2/TUBERIN and S6 phosphorylation (phospho-S6) levels in cell lysates of TSC2+/+, TSC2+/−, and TSC2−/− iPSCs. β-actin was used as the loading control. E, Expression of NESTIN and SOX2 in TSC2+/+, TSC2+/−, and TSC2−/− NPCs. Scale bar, 50 µm. F, Increased phospho-S6 levels in TSC2−/− NPCs. G, Relative phospho-S6 intensity in TSC2+/+, TSC2+/−, and TSC2−/− NPCs. Data are mean ± SD. Experiments were performed 4 times. One-way ANOVA: F(2,9) = 6.845, p = 0.0156. Bonferroni's multiple comparisons test, *p = 0.035, TSC2+/+ versus TSC2−/−; *p = 0.03, TSC2+/− versus TSC2−/−.
Figure 2.
Figure 2.
mTOR-dependent abnormal morphology of human iPSC-derived TSC2−/− neurons. A, B, Immunostaining of iPSC-derived neurons with anti-vGLUT1, anti-GAD65, and anti-MAP2 antibodies at 23 d after neural differentiation from NPCs. C, D, Immunostaining of iPSC-derived neurons with anti-BRN2, anti-SATB2, anti-CTIP2, and anti-βIII-tubulin antibodies at ∼30 d after neural differentiation from NPCs. E, Schedule of application of AAV encoding EGFP and treatment with rapamycin after plating NPCs for neural differentiation at day 0 (d0). F, Relative phospho-S6 intensity of TSC2+/+, TSC2+/−, and TSC2−/− neurons at 23 d of neuronal differentiation. Kruskal–Wallis test, p < 0.0001. Steel test compared with TSC2−/− DMSO, ****p < 0.00001. The experiments were performed 3 times, and the number of neurons used for analysis was TSC2+/+ DMSO, 552; TSC2+/− DMSO, 522; TSC2−/− DMSO, 567; TSC2+/+ Rapa, 393; TSC2+/− Rapa, 349; and TSC2−/− Rapa, 289. G, Phospho-S6 signals in iPSC-derived TSC2+/+, TSC2+/−, and TSC2−/− neurons after 23 d. The cells were sparsely infected with AAVs encoding EGFP and stained with anti-GFP and anti-phospho S6 antibodies. Scale bar, 50 µm. H, Neurite length of TSC2+/+, TSC2+/−, and TSC2−/− neurons with or without 100 nm rapamycin treatment for 22 d from day 1 of neuronal differentiation. We measured the length of the longest and thin neurites of individual GFP-expressing neurons and defined them as the neurite length. Experiments were performed 4 times. Data are mean ± SD. Kruskal–Wallis test, p < 0.0001. Steel test compared with TSC2−/− DMSO, ****p < 0.00001. The number of cells used for analysis was TSC2+/+ DMSO, 298; TSC2+/− DMSO, 286; TSC2−/− DMSO, 196; TSC2+/+ Rapa, 396; TSC2+/− Rapa, 222; and TSC2−/− Rapa, 129. I, Relative soma size of TSC2+/+, TSC2+/−, and TSC2−/− neurons with or without 100 nm rapamycin treatment for 22 d from day 1 of neuronal differentiation. The experiments were performed 3 times. Data are mean ± SD. Kruskal–Wallis test, p < 0.0001. Steel test compared with TSC2−/− DMSO, ****p < 0.00001. The number of cells used for analysis was TSC2+/+ DMSO, 552; TSC2+/− DMSO, 522; TSC2−/− DMSO, 555; TSC2+/+ Rapa, 393; TSC2+/− Rapa, 349; and TSC2−/− Rapa, 289. J, K, Immunofluorescent staining of cultured cells with anti-GFAP, anti-CD44, and anti-MAP2 antibodies at ∼30 d after neural differentiation from NPCs. Scale bar, 50 µm.
Figure 3.
Figure 3.
Cultured TSC2−/− neurons exhibited synchronous neuronal activity. A, Ca2+ dynamics of iPS-derived TSC2+/+, TSC2+/−, and TSC2−/− neurons at 33 d. Fluorescence images of Fluo-8 and the ΔF/F0 changes in Fluo-8 signals are shown. Images were taken at 1 Hz. Thirty-six frames of ΔF/F0 changes in Fluo-8 are presented. B, Raster plots of Ca2+ spikes in TSC2+/+, TSC2+/−, and TSC2−/− neurons. Vertical axis represents the individual cells analyzed (∼1 in 70 cells). C, Developmental change in the percentage of experiments in which synchronous Ca2+ spikes were observed in TSC2−/− neurons. Each value was obtained from 6 to 29 independent experiments. D, Percentages of neurons exhibiting spontaneous Ca2+ spikes in TSC2+/+, TSC2+/−, and TSC2−/− neurons on various days of culture. Data are mean ± SD. The experimental numbers were 9-29 for each group. Day 8: one-way ANOVA, F(2,23) = 1.258, p = 0.296. Day 20: one-way ANOVA, F(2,24) = 2.042, p = 0.152. Day 30: one-way ANOVA, F(2,49) = 2.029, p = 0.142. Day 40: one-way ANOVA, F(2,57) = 2.031, p = 0.141. Day 60: one-way ANOVA, F(2,75) = 2.034, p = 0.138. Day 80: one-way ANOVA, F(2,34) = 7.907, p = 0.00151. Bonferroni's multiple comparisons test, **p = 0.0013, TSC2+/+ (n = 13) versus TSC2−/− (n = 12); *p = 0.0324, TSC2+/− (n = 12) versus TSC2−/− (n = 12). Day 100: one-way ANOVA, F(2,26) = 1.98, p = 0.158. E, Frequencies of Ca2+ spikes in TSC2+/+, TSC2+/−, and TSC2−/− neurons on various culture days of neuronal differentiation. The experimental numbers were 9-29 for each group. Day 8: one-way ANOVA, F(2,23) = 1.517, p= 0.24. Day 20: Kruskal–Wallis test, p = 0.001084, Steel–Dwass test, **p= 0.004896, TSC2+/+ (n = 9) versus TSC2−/− (n = 9); **p = 0.004896, TSC2+/− (n = 9) versus TSC2−/− (n = 9). Day 30: Kruskal–Wallis test, p = 0.0968. Day 40: one-way ANOVA, F(2,57) = 7.323, p = 0.00148, Bonferroni's multiple comparisons test, **p =0.0036, TSC2+/+ (n = 19) versus TSC2−/− (n = 19); **p = 0.0086, TSC2+/− (n = 19) versus TSC2−/− (n = 19). Day 60: Kruskal–Wallis test, p = 0.6337. Day 80: Kruskal–Wallis test, p = 0.0299, Steel test compared with TSC2−/−, *p = 0.03611, TSC2+/+ (n = 13) versus TSC2−/− (n = 12). Day 100: one-way ANOVA, F(2,23) = 2.644, p = 0.0926. F, Difference in Ca2+ spike frequencies between synchronized (synchro) and nonsynchronized (non) TSC2−/− neurons at 30 and 60 d. Data are mean ± SD. Day 30: Mann–Whitney U test, ***p = 0.00057. Day 60: Mann–Whitney U test, ****p = 0.0000105. The experimental number was synchronized (n = 9) and nonsynchronized (n = 9) at 30 d. The experimental number was synchronized (n = 12) and nonsynchronized (n = 17) at 60 d.
Figure 4.
Figure 4.
TSC2−/− neurons showed enhanced Ca2+ influx via LTCCs on membrane depolarization. A, Ca2+ response on membrane depolarization in iPSC-derived neurons with TSC2 mutations. The fluorescence ratio (340/380 nm) of fura-2 is shown. Bars represent 60 mm KCl stimulation for 20 s. B, Resting cytoplasmic Ca2+ levels and peak amplitude of Ca2+ influx into neurons on 60 mm KCl stimulation of 30-d-old (left) and 150-d-old (right) cultures. Data are mean ± SD. Resting Ca2+ level: day 30, one-way ANOVA, F(2,132) = 2.932, p = 0.0568; day 150, one-way ANOVA, F(2,83) = 2.824, p = 0.0651. The number of cells analyzed was 32-58 (30-d-old) and 23-35 (150-d-old). KCl response: day 30, Kruskal–Wallis test, p < 0.0001, Steel–Dwass test, ***p < 0.0001, TSC2+/+ (n = 58) versus TSC2−/− (n = 45); ***p < 0.0001, TSC2+/− (n = 32) versus TSC2−/− (n = 45). Day 150, Kruskal–Wallis test, p < 0.0001, Steel–Dwass test, ***p < 0.0001, TSC2+/+ (n = 35) versus TSC2−/− (n = 23); ***p < 0.0001, TSC2+/− (n = 29) versus TSC2−/− (n = 23). C, The effect of L-, P/Q-, and N-type VGCC blockers on Ca2+ signals of TSC2−/− neurons on membrane depolarization. Nif: 5 μm nifedipine; MVIIC: 1 μm ω-conotoxin MVIIC; GVIA: 1 μm ω-conotoxin GVIA. D, Ca2+ increases in neurons treated with Ca2+ channel blockers. Data are mean ± SD. Kruskal–Wallis test, p < 0.0001, Steel test compared with TSC2−/−, ***p < 0.0001, TSC2−/− (n = 156) versus TSC2−/− + Nif (n = 99); p = 0.705, TSC2−/− (n = 156) versus TSC2−/− + GVIA (n = 222); p = 0.9949, TSC2−/− (n = 156) versus TSC2−/− + MVIIC (n = 212). The number of cells used for analysis was 201, 82, 102, 102, 156, 99, 222, and 212 from the left bar to the right bar in the figure.
Figure 5.
Figure 5.
CACNA1D expression was increased in TSC2−/− neurons. A, Relative gene expression in iPSC-derived neurons with TSC2 mutations at 30 d of neuronal differentiation. Data are mean ± SD. CACNA1C: Kruskal–Wallis test, p = 0.01387, Steel–Dwass test, p = 0.167, TSC2+/+ (n = 12) versus TSC2−/− (n = 12); p = 0.3740, TSC2+/+ (n = 12) versus TSC2+/− (n = 12); *p = 0.0154, TSC2+/− (n = 12) versus TSC2−/− (n = 12). CACNA1D: Kruskal–Wallis test, p < 0.0001, Steel–Dwass test, ****p = 0.000083, TSC2+/+ (n = 12) versus TSC2−/− (n = 12); **p = 0.00190, TSC2+/− (n = 12) versus TSC2−/− (n = 12). GRIA1: one-way ANOVA, F(2,32) = 0.2749, p = 0.761. GRIN1: one-way ANOVA, F(2,21) = 0.6872, p = 0.514. The experiments were performed using the cDNA from 4 to 6 independent cultures. B, Relative CACNA1D expression on day 60. Data are mean ± SD. Kruskal–Wallis test, p = 0.000899, Steel–Dwass test, **p = 0.00194, TSC2+/+ (n = 10) versus TSC2−/− (n = 10), **p = 0.00897, TSC2+/− (n = 10) versus TSC2−/− (n = 10). The data were obtained using cDNA from five independent cultures. C, Expression levels of Cav1.3 in TSC2+/+, TSC2+/−, and TSC2−/− neurons. The same amounts of protein lysates (∼10 µg) were immunoblotted with an anti-Cav1.3 antibody (Ab144). β-Actin was used as the loading control. Right, Fold change in Cav1.3 expression normalized to β-actin. One-way ANOVA, F(2,10) = 8.205, **p = 0.00778, Bonferroni's multiple comparisons test, **p = 0.007, TSC2+/+ (n = 4) versus TSC2−/− (n = 5); p = 0.234, TSC2+/+ (n = 4) versus TSC2+/− (n = 4), p = 0.229, TSC2+/− (n = 4) versus TSC2−/− (n = 5). D, Immunostaining of Cav1.3 (green, Alomone Labs, ACC-005) and MAP2 (red) in TSC2+/+, TSC2+/−, and TSC2−/− neurons. Scale bar, 20 µm. Inset, Magnified image of the white box area. E, Relative immune intensity of Cav1.3 in neurons at the soma. Kruskal–Wallis χ2 = 106.08, df = 2, ***p < 2.2 × 10⁻¹⁶. Steel test, ****p < 1 × 10⁻⁹, TSC2−/− (n = 112) versus TSC2+/+ (n = 141), ****p < 1 × 10⁻⁹, TSC2−/− (n = 112) versus TSC2+/− (n = 104). F, A-to-I editing of the IQ domain of CACNA1D. The electropherograms of direct sequencing of the CACNA1D gene from TSC2+/+, TSC2+/−, and TSC2−/− neurons are shown. Arrows indicate the adenine-to-guanine conversion signals. G, Percentage of A-to-I editing of CACNA1D cDNA on day 30 (left). Right, Expression levels of ADARB1 mRNA in the neurons. Data are mean ± SD. A-to-I editing: one-way ANOVA, F(2,12) = 20.70, p = 0.000129, Bonferroni's multiple comparisons test, ***p = 0.00011, TSC2+/+ (n = 5) versus TSC2−/− (n = 5); **p = 0.00383, TSC2+/− (n = 5) versus TSC2−/− (n = 5). ADARB1: one-way ANOVA, F(2,27) = 67.80, p < 0.0001, Bonferroni's multiple comparisons test, ***p < 0.0001, TSC2+/+ (n = 10) versus TSC2−/− (n = 10); ***p < 0.0001, TSC2+/− (n = 10) versus TSC2−/− (n = 10). All data were obtained from five independent cultures. H, A-to-I editing (%) and relative ADARB1 expression in 60-d-old neurons. Data are mean ± SD. A-to-I editing: one-way ANOVA, F(2,12) = 1.117, p = 0.359, n = 5 experiments. ADARB1: one-way ANOVA, F(2,21) = 20.66, p = 0.000011, Bonferroni's multiple comparisons test, ****p = 0.00002, TSC2+/+ (n = 8) versus TSC2−/− (n = 8); ***p = 0.00015, TSC2+/− (n = 8) versus TSC2−/− (n = 8). Data were obtained from five independent cultures.
Figure 6.
Figure 6.
c.a.Rheb increased Ca2+ influx and Cav1.3 expression in TSC2+/+ neurons. A, c.a.Rheb increases phospho-S6 intensity in TSC2+/+ neurons. TSC2+/+ neurons were transfected with plasmids encoding mCherry (top panels) or mCherry-T2A-c.a.Rheb (bottom panels) and stained with anti-phospho-S6 and MAP2 antibodies. Scale bar, 50 µm. B, Scatter plots for mCherry versus phospho-S6 signals in mCherry (top) or mCherry-T2A-c.a.Rheb (bottom)-transfected neurons. C, Mean signal intensity of phospho-S6 in mCherry (n = 35) and mCherry-T2A-c.a.Rheb (n = 40) transfected neurons. Mann–Whitney U test, ****p = 1.09 × 10⁻¹⁸. D, Soma size of mCherry (n = 35) and mCherry-T2A-c.a.Rheb (n = 40) transfected neurons. Welch two-sample t test, **p = 0.00104. E, Ca2+ signals in mCherry or mCherry-T2A-c.a.Rheb-expressing neurons on KCl stimulation. TSC2+/+ neurons were transfected with mCherry or mCherry-T2A-c.a.Rheb-expressing plasmids on days 8-9, and Ca2+ signals were measured with fura 2-AM on days 9-11 after transfection. Bars represent 60 mm KCl application. F, Quantification of peak height of Ca2+ transient on KCl stimulation in mCherry (n = 27) or mCherry-T2A-c.a.Rheb (n = 41) expressing neurons. Mann–Whitney U test, *p = 0.016. Data were obtained from 9 dishes of 3 independent cultures for each plasmid. G, Immunostaining of Cav1.3 (Alomone Labs, ACC-005) in mCherry or mCherry-T2A-c.a.Rheb-expressing TSC2+/+ neurons. Arrows indicate mCherry-positive neurons. Scale bar, 50 µm. H, Relative immunoactivity of Cav1.3 in mCherry (n = 56) or mCherry-T2A-c.a.Rheb (n = 61) expressing neurons. Immunosignals were normalized to Cav1.3 immunosignals of mCherry-negative cells in each well. Kolmogorov–Smirnov test, mCherry: p = 0.9148; mCherry-T2A-c.a.Rheb: p = 0.2991; F test= 0.76. p = 0.3068. Student t test, ****p = 4.835 × 10⁻¹⁴.
Figure 7.
Figure 7.
Long-term treatment of TSC2−/− neurons with rapamycin changed Ca2+ dynamics from synchronous to sporadic patterns. A, Schematic illustration of rapamycin treatment and Ca2+ imaging after plating NPCs for differentiation. B, Ca2+ dynamics of DMSO-treated (left) or rapamycin-treated (right) TSC2−/− neurons. The ΔF/F0 changes of the Fluo-8 signals for 36 frames are shown. Neurons that were treated with DMSO or 10 nm rapamycin for >18 d from day 2 of neuronal differentiation were used for the analysis. C, Raster plots of Ca2+ spikes from B. D, Ca2+ spike frequencies of TSC2+/+, TSC2+/−, and TSC2−/− neurons with or without rapamycin treatment. Data are mean ± SD. One-way ANOVA, F(5,29) = 26.88, p < 0.0001, Dunnett's multiple comparisons test compared with TSC2−/−, ****p < 0.00001. The number of experiments was 6 for each group except for TSC2−/− + Rapa (n = 5). E, Ca2+ spike frequencies of TSC2−/− neurons after treatment with 50 nm rapamycin for 5, 10, or 30 min. We used 50 nm rapamycin to completely and rapidly suppress the mTOR activity. The experiments were performed 3 times. One-way ANOVA, F(3,8) = 0.009871, p = 0.999.
Figure 8.
Figure 8.
Long-term rapamycin treatment ameliorated enhanced Ca2+ influx into TSC2−/− neurons on membrane depolarization. A, Schematic illustration of rapamycin treatment and Ca2+ imaging after plating NPCs for differentiation. We applied rapamycin from nine day onward following NPC differentiation, since the Ca2+ response seen on depolarization did not likely depend on neural networks. B, Ca2+ dynamics of TSC2+/+, TSC2+/−, TSC2−/− and rapamycin-treated TSC2−/− neurons on stimulation with 60 mm KCl. The fura-2 ratio (380/340 nm) is shown. Bar represents the 60 mm KCl stimulation for 20 s. C, Peak amplitude (left), area under the curve (AUC, middle), and tau (right) of Ca2+ transients of TSC2+/+, TSC2+/−, TSC2−/− and rapamycin-treated TSC2−/− neurons for >11 d. A total of 104-149 neurons were analyzed for each group. Peak amplitude: Kruskal–Wallis test, p < 0.0001, Steel–Dwass test, ***p < 0.0001, TSC2+/+ (n = 126) versus TSC2−/− (n = 104); ***p < 0.0001, TSC2+/− (n = 105) versus TSC2−/− (n = 104); ***p < 0.0001, TSC2−/− (n = 104) versus TSC2−/− + Rapa (n = 149). AUC: Kruskal–Wallis test, p < 0.0001, Steel–Dwass test, ***p < 0.0001, TSC2+/+ (n = 126) versus TSC2−/− (n = 104); ***p < 0.0001, TSC2+/− (n = 105) versus TSC2−/− (n = 104); ***p < 0.0001, TSC2−/− (n = 104) versus TSC2−/− + Rapa (n = 149). Tau: Kruskal–Wallis test, p = 0.000109, Steel–Dwass test, **p < 0.001, TSC2+/+ (n = 126) versus TSC2−/− (n = 104); **p < 0.001, TSC2−/− (n = 104) versus TSC2−/− + Rapa (n = 149). D, Rapamycin treatment decreased CACNA1D expression. Data are mean ± SD. The number of experiments was 12 for each group. Kruskal–Wallis test, p < 0.0001, Steel test compared with TSC2−/−, *p = 0.01144, TSC2−/− (n = 12) versus TSC2+/+ (n = 12); *p = 0.01204, TSC2−/− (n = 12) versus TSC2+/− (n = 12); ***p = 0.000159, TSC2−/− (n = 12) versus TSC2+/+ + Rapa (n = 12); **p = 0.001035, TSC2−/− (n = 12) versus TSC2+/− + Rapa (n = 12); ***p = 0.000158, TSC2−/− (n = 12) versus TSC2−/− + Rapa (n = 12). E, Ca2+ store sizes of TSC2+/+, TSC2+/−, and TSC2−/− neurons. The peak amplitudes of intracellular Ca2+ levels on CPA treatment in the absence of extracellular Ca2+ were evaluated. Data are mean ± SD. The experiments were performed 3 times. For each experiment, 26-58 cells were used in the analysis. One-way ANOVA, F(2,6) = 49.67, p = 0.000185, Bonferroni's multiple comparisons test, ***p = 0.00077, TSC2+/+ (n = 3) versus TSC2−/− (n = 3); ***p = 0.00026, TSC2+/− (n = 3) versus TSC2−/− (n = 3).
Figure 9.
Figure 9.
Suppression of LTCCs partially ameliorated the aberrant neurite extensions in TSC2−/− neurons. Neurite length of DMSO- or nifedipine-treated TSC2+/+, TSC2+/−, and TSC2−/− neurons is shown. After transfection with pMax-GFP (Lonza), NPCs were differentiated into neurons, and neurite lengths were measured on day 7. For the nifedipine (Nif) treatment, neurons were incubated with three concentrations of nifedipine (1, 3, or 5 μm) or DMSO for 5 d from day 2 of neuronal differentiation. Experiments were performed 4 times. TSC2+/+, DMSO: 409.62 ± 244.4 (n = 197); 1 μm Nif: 395.58 ± 244.58 (n = 254); 3 μm Nif: 390.47 ± 268.61 (n = 276); 5 μm Nif: 341.54 ± 219.4 (n = 255). TSC2+/−, DMSO: 465.34 ± 297.23 (n = 312); 1 μm Nif: 477.92 ± 319.56 (n = 225); 3 μm Nif: 494.76 ± 337.62 (n = 313); 5 μm Nif: 482.75 ± 296.32 (n = 282). TSC2−/−, DMSO: 845.75 ± 472.27 (n = 179); 1 μm Nif: 617.02 ± 319.59 (n = 248); 3 μm Nif: 642.92 ± 364.58 (n = 256); 5 μm Nif: 615.16 ± 332.45 (n = 280). Data are mean ± SD. p < 0.00001 (Kruskal–Wallis test). Steel–Dwass test: ****p < 0.00001, DMSO-treated TSC2−/− (n = 179) versus 1 μm nifedipine-treated TSC2−/− (n = 248); ****p < 0.00001, DMSO-treated TSC2−/− (n = 179) versus 3 μm nifedipine-treated TSC2−/− (n = 256); ****p < 0.00001, DMSO-treated TSC2−/− (n = 179) versus 5 μm nifedipine-treated TSC2−/− (n = 280); ****p < 0.00001, DMSO-treated TSC2−/− (n = 179) versus DMSO-treated TSC2+/+ (n = 197); ****p < 0.00001, DMSO-treated TSC2−/− (n = 179) versus 1 μm nifedipine-treated TSC2+/+ (n = 254); ****p < 0.00001, DMSO-treated TSC2−/− (n = 179) versus 3 μm nifedipine-treated TSC2+/+ (n = 276); ****p < 0.00001, DMSO-treated TSC2−/− (n = 179) versus 5 μm nifedipine-treated TSC2+/+ (n = 255); ****p < 0.00001, DMSO-treated TSC2−/− (n = 179) versus DMSO-treated TSC2+/− (n = 312); ****p < 0.00001, DMSO-treated TSC2−/− (n = 179) versus 1 μm nifedipine-treated TSC2+/− (n = 225); ****p < 0.00001, DMSO-treated TSC2−/− (n = 179) versus 3 μm nifedipine-treated TSC2+/− (n = 313); ****p < 0.00001, DMSO-treated TSC2−/− (n = 179) versus 5 μm nifedipine-treated TSC2+/+ (n = 282); p = 0.0785, DMSO-treated TSC2+/+ (n = 197) versus 5 μm nifedipine-treated TSC2+/+ (n = 225); p = 0.9997, DMSO-treated TSC2+/− (n = 312) versus 5 μm nifedipine-treated TSC2+/− (n = 282). All statistical data are presented in Extended Data Figure 9.
Figure 10.
Figure 10.
Sustained activation of CREB in TSC2−/− neurons on membrane depolarization. A, Schematic illustration of rapamycin treatment, KCl stimulation, and immunostaining after plating NPCs for neuronal differentiation. B, Immunostaining of phospho-CREB (green) in TSC2+/+, TSC2+/−, TSC2−/−, and rapamycin-treated TSC2−/− neurons after membrane depolarization. Red represents MAP2. Scale bar, 50 µm. C, The intensity histograms of pCREB (arbitrary units) are shown. Experiments were performed at least 3 times with independent cultures. Representative data are shown. D, Percentage of neurons with high pCREB immunoreactivity (intensity> 3000). Data are mean ± SD; n = 4-8 experiments. For each experiment, 200-750 neurons were analyzed. Two-way repeated-measures ANOVA (genotype, F(3,56) = 3.6403), *p = 0.03038. Tukey HSD test, **p = 0.0051, TSC2+/− (n = 7) versus TSC2−/− (n = 6); ***p = 0.00073, TSC2−/− (n = 6) versus TSC2−/− + Rapa (n = 4); **p = 0.0013, TSC2+/+ (n = 8) versus TSC2−/− (n = 6).

Similar articles

Cited by

References

    1. Abs E, Goorden SM, Schreiber J, Overwater IE, Hoogeveen-Westerveld M, Bruinsma CF, Aganovic E, Borgesius NZ, Nellist M, Elgersma Y (2013) TORC1-dependent epilepsy caused by acute biallelic Tsc1 deletion in adult mice. Ann Neurol 74:569–579. 10.1002/ana.23943 - DOI - PubMed
    1. Azizan EA, Poulsen H, Tuluc P, Zhou J, Clausen MV, Lieb A, Maniero C, Garg S, Bochukova EG, Zhao W, Shaikh LH, Brighton CA, Teo AE, Davenport AP, Dekkers T, Tops B, Küsters B, Ceral J, Yeo GS, Neogi SG, et al. . (2013) Somatic mutations in ATP1A1 and CACNA1D underlie a common subtype of adrenal hypertension. Nat Genet 45:1055–1060. 10.1038/ng.2716 - DOI - PubMed
    1. Bazzazi H, Ben Johny M, Adams PJ, Soong TW, Yue DT (2013) Continuously tunable Ca2+ regulation of RNA-edited CaV1.3 channels. Cell Rep 5:367–377. 10.1016/j.celrep.2013.09.006 - DOI - PMC - PubMed
    1. Beers J, Gulbranson DR, George N, Siniscalchi LI, Jones J, Thomson JA, Chen G (2012) Passaging and colony expansion of human pluripotent stem cells by enzyme-free dissociation in chemically defined culture conditions. Nat Protoc 7:2029–2040. 10.1038/nprot.2012.130 - DOI - PMC - PubMed
    1. Benito E, Barco A (2010) CREB's control of intrinsic and synaptic plasticity: implications for CREB-dependent memory models. Trends Neurosci 33:230–240. 10.1016/j.tins.2010.02.001 - DOI - PubMed

Publication types

MeSH terms