Etiological and epidemiological features of acute respiratory infections in China
- PMID: 34408158
- PMCID: PMC8373954
- DOI: 10.1038/s41467-021-25120-6
Etiological and epidemiological features of acute respiratory infections in China
Abstract
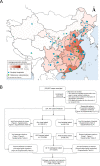
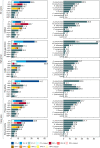
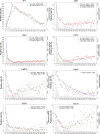
Nationwide prospective surveillance of all-age patients with acute respiratory infections was conducted in China between 2009‒2019. Here we report the etiological and epidemiological features of the 231,107 eligible patients enrolled in this analysis. Children <5 years old and school-age children have the highest viral positivity rate (46.9%) and bacterial positivity rate (30.9%). Influenza virus, respiratory syncytial virus and human rhinovirus are the three leading viral pathogens with proportions of 28.5%, 16.8% and 16.7%, and Streptococcus pneumoniae, Mycoplasma pneumoniae and Klebsiella pneumoniae are the three leading bacterial pathogens (29.9%, 18.6% and 15.8%). Negative interactions between viruses and positive interactions between viral and bacterial pathogens are common. A Join-Point analysis reveals the age-specific positivity rate and how this varied for individual pathogens. These data indicate that differential priorities for diagnosis, prevention and control should be highlighted in terms of acute respiratory tract infection patients' demography, geographic locations and season of illness in China.
© 2021. The Author(s).
Conflict of interest statement
The authors declare no competing interests.
Figures


Similar articles
-
[Pathogenic characteristics of hospitalized severe acute respiratory infections in Shanghai, China, 2015-2017].Zhonghua Liu Xing Bing Xue Za Zhi. 2019 Aug 10;40(8):911-916. doi: 10.3760/cma.j.issn.0254-6450.2019.08.008. Zhonghua Liu Xing Bing Xue Za Zhi. 2019. PMID: 31484253 Chinese.
-
Epidemiological and etiological characteristics of 1266 patients with severe acute respiratory infection in central China, 2018-2020: a retrospective survey.BMC Infect Dis. 2024 Apr 22;24(1):426. doi: 10.1186/s12879-024-09297-x. BMC Infect Dis. 2024. PMID: 38649799 Free PMC article.
-
[Etiologic and epidemiologic features of acute respiratory infections in adults from Shanghai, during 2015-2017].Zhonghua Liu Xing Bing Xue Za Zhi. 2019 Aug 10;40(8):904-910. doi: 10.3760/cma.j.issn.0254-6450.2019.08.007. Zhonghua Liu Xing Bing Xue Za Zhi. 2019. PMID: 31484252 Chinese.
-
Viral-bacterial interactions in the respiratory tract.J Gen Virol. 2016 Dec;97(12):3089-3102. doi: 10.1099/jgv.0.000627. Epub 2016 Oct 18. J Gen Virol. 2016. PMID: 27902340 Review.
-
Infection-related asthma.J Allergy Clin Immunol Pract. 2014 Nov-Dec;2(6):658-63. doi: 10.1016/j.jaip.2014.09.011. Epub 2014 Nov 6. J Allergy Clin Immunol Pract. 2014. PMID: 25439354 Free PMC article. Review.
Cited by
-
Epidemiological characteristics and meteorological factors of acute respiratory infections (ARIs) in hospitalized children in eastern Guangdong, China.Sci Rep. 2024 Oct 26;14(1):25518. doi: 10.1038/s41598-024-77005-5. Sci Rep. 2024. PMID: 39462026 Free PMC article.
-
Empirical assessment of the enrichment-based metagenomic methods in identifying diverse respiratory pathogens.Sci Rep. 2024 Oct 18;14(1):24493. doi: 10.1038/s41598-024-75120-x. Sci Rep. 2024. PMID: 39424897 Free PMC article.
-
Clinical characteristics and risk factors of pulmonary embolism with Mycoplasma pneumoniae pneumonia in children.Sci Rep. 2024 Oct 14;14(1):24043. doi: 10.1038/s41598-024-74302-x. Sci Rep. 2024. PMID: 39402105 Free PMC article.
-
Comparative study on the epidemiological characteristics and hazards of respiratory syncytial virus and influenza virus infections among elderly people.BMC Infect Dis. 2024 Oct 9;24(1):1129. doi: 10.1186/s12879-024-10048-1. BMC Infect Dis. 2024. PMID: 39385082 Free PMC article.
-
Epidemiological Characteristics of Upper Respiratory Tract Pathogens in Children in Guangdong, China.Clin Respir J. 2024 Oct;18(10):e70011. doi: 10.1111/crj.70011. Clin Respir J. 2024. PMID: 39367675 Free PMC article.
References
-
- World Health Organization. Global Health Estimates 2016: deaths by cause, age, sex, by country and by region, 2000‒2016 (2018); http://www.who.int/healthinfo/global_burden_disease/estimates/en/index1....
Publication types
MeSH terms
LinkOut - more resources
Full Text Sources
Medical

