. 2021 Aug 16;131(16):e145459.
doi: 10.1172/JCI145459.

BET bromodomain protein inhibition reverses chimeric antigen receptor extinction and reinvigorates exhausted T cells in chronic lymphocytic leukemia

Affiliations

BET bromodomain protein inhibition reverses chimeric antigen receptor extinction and reinvigorates exhausted T cells in chronic lymphocytic leukemia

Weimin Kong et al. J Clin Invest. .

Abstract

Chimeric antigen receptor (CAR) T cells have induced remarkable antitumor responses in B cell malignancies. Some patients do not respond because of T cell deficiencies that hamper the expansion, persistence, and effector function of these cells. We used longitudinal immune profiling to identify phenotypic and pharmacodynamic changes in CD19-directed CAR T cells in patients with chronic lymphocytic leukemia (CLL). CAR expression maintenance was also investigated because this can affect response durability. CAR T cell failure was accompanied by preexisting T cell-intrinsic defects or dysfunction acquired after infusion. In a small subset of patients, CAR silencing was observed coincident with leukemia relapse. Using a small molecule inhibitor, we demonstrated that the bromodomain and extra-terminal (BET) family of chromatin adapters plays a role in downregulating CAR expression. BET protein blockade also ameliorated CAR T cell exhaustion as manifested by inhibitory receptor reduction, enhanced metabolic fitness, increased proliferative capacity, and enriched transcriptomic signatures of T cell reinvigoration. BET inhibition decreased levels of the TET2 methylcytosine dioxygenase, and forced expression of the TET2 catalytic domain eliminated the potency-enhancing effects of BET protein targeting in CAR T cells, providing a mechanism linking BET proteins and T cell dysfunction. Thus, modulating BET epigenetic readers may improve the efficacy of cell-based immunotherapies.

Keywords: Cancer gene therapy; Immunology; Leukemias; Oncology; T cells.


Conflict of interest statement

Conflict of interest: JS, MVM, JJM, RMY, BLL, DLP, FDB, CHJ, MMD, SFL, and JAF are inventors of intellectual property licensed by the University of Pennsylvania to Novartis and have received patent royalties (USA Patent Number WO/2015/157252; Argentina Patent Number AR099974A1; USA Patent Numbers WO/2016/164580, WO/2017/049166, US20200087376A1, and US20200370012A1; European Patent Office Patent Number EP3788369A1). JJM receives funding from Novartis, Incyte, IASO Biotherapeutics, and Kite/Gilead; is a consultant for Simcere of America, Shanghai Unicar Therapy, Johnson & Johnson, Poseida Therapeutics, and IASO Biotherapeutics; and serves on the medical advisory board and scientific advisory board (SAB) for IASO Biotherapeutics. BLL and CHJ are scientific founders of Tmunity Therapeutics, for which they have founder’s stock. BLL, MMD, CHJ, and JAF have received royalties from Tmunity Therapeutics. CHJ and JAF are founders of DeCART Therapeutics. BLL is a consultant for Novartis and Terumo and SAB member for Avectas, Patheon/Thermo Fisher Scientific Viral Vector Services, Immuneel, In8bio, Ori Biotech, and Vycellix. MMD is a consultant and member of the SAB for Cellares Corporation. SFL is a consultant for Gilead/Kite. JAF is a consultant for Guidepoint and LEK Consulting.

Figures

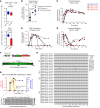
Figure 1
Figure 1. Exhaustion phenotypes are on-treatment biomarkers of resistance to CD19 CAR T cell therapy.
(A) Absolute numbers of B-CLL cells in the blood of patients treated with CAR T cells are shown (NR with no/poor CAR T cell expansion, n = 15; PR, n = 5; PRTD, n = 3; CR, n = 5). The expansion capacity of CAR T cells in each patient response group as determined by AUC calculations (copies per microgram genomic DNA, AUC 0–28 days) is indicated above each graph. (B) Expression levels of inhibitory receptors (CTLA-4, TIM-3, PD-1, and LAG-3) on preinfusion (top) and postinfusion (bottom) CAR T cells at the peak of in vivo expansion in the blood of the CR/PRTD versus PR/NR patients. (C) Flow cytometric plots of peripheral blood CAR T cells at the peak of in vivo expansion from representative CR and NR patients coexpressing PD-1 and TIM-3 are shown (top). Frequencies of CAR T cells coexpressing these inhibitory receptors in CR/PRTD compared with PR/NR patients are summarized as box plots (bottom). (D) Proportions of peak expansion CAR T cells expressing Ki-67 (top) and perforin (bottom) in CR/PRTD relative to PR/NR patient groups are shown. In all boxplots, boxes extend from the 25th to 75th percentiles; middle line, median; whiskers, minimum, and maximum. P values calculated using a Mann-Whitney test. (E) Longitudinal TIM-3 and (F) CTLA-4 expression on postinfusion CD8+CAR+ T cells at indicated time points. (G) CAR T cell expansion levels and (H) frequencies of perforin-expressing CD8+CAR+ T cells are shown in representative patients from the above response groups.
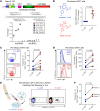
Figure 2
Figure 2. CAR extinction is associated with decreased expression of the transgenic protein despite persistence of the transgenic DNA and occurs independently of promoter methylation.
(A) Boxplots of CD19 CAR expression levels on preinfusion (top) and postinfusion (bottom) CD8+CAR+ T cells in CR/PRTD versus PR/NR groups. (B) CAR T cell expansion capacity as indicated by AUC 0–28-day calculations in NRs with no/poor CAR T cell expansion, NRs with CAR T cell expansion (patients 11, 17, and 40), and CR patients. Data are shown as the mean ± SEM. (C) CAR persistence at the DNA and (D) protein levels in n = 3 NR patients exhibiting CAR T cell expansion compared with a representative CR patient showing similar kinetics. (E) B-CLL burden in the peripheral blood of the same patients above. P values determined with a Mann-Whitney test. (F) CpG dinucleotide clustering within the vector-specific EF1α promoter is shown. Each circle depicts a single CpG site. LTR, long terminal repeat; cPPT, polypurine tract; EF1α, elongation factor 1 alpha promoter; U3, upstream region; U5, downstream region; R, repeat region. (G) Genomic DNA from preinfusion and postinfusion CAR T cells of a representative NR patient who exhibited CAR extinction was isolated followed by bisulfite conversion and targeted sequencing. Longitudinal EF1α promoter methylation analysis is shown, in which each row represents a specific time point, with methylated cytosine residues depicted by shaded circles and nonmethylated residues by unshaded circles. The color indicates the relative methylation level from low (white) to high (black). (H) EF1α promoter bisulfite sequencing results of preinfusion and postinfusion CAR T cells from evaluable patients with CLL with various clinical outcomes (NR, n = 7; PR, n = 2; PRTD, n = 2; CR, n = 5).
Figure 3
Figure 3. JQ1, a BET bromodomain inhibitor, rescues CAR expression.
(A) ChIP analysis of the CAR vector–specific EF1α promoter for BET bromodomain protein localization. A schematic of the PCR amplification for ChIP is shown (top). CAR T cells from nonresponding patients with CLL (n = 3) were subjected to ChIP with anti-BRD4 and anti-BRD2 antibodies. Enrichment of BRD4 and BRD2 at the vector-specific EF1α promoter was measured by qPCR. Data are shown as the mean ± SEM (bottom). (B) CAR T cells from nonresponders were treated with (–)-JQ1 (left panel) or (+)-JQ1 for 4 days, and real-time RT-PCR was subsequently performed to determine expression levels of the CAR transgene relative to CD3 epsilon, which served as a loading/normalization control. Fold expression levels of CAR in active JQ1-treated patient T cells compared with those in T cells treated with an inactive control are shown (n = 5, paired t test). Data are shown as the mean ± SEM. (C) Changes in the frequencies of nonresponding CLL patient CD3+CAR+ T cells (representative contour plots, left; graphical data summary, right) and (D) CAR expression levels as denoted by MFI of an antiidiotypic antibody (representative histograms, left; summarized data, right) after a 4-day incubation with 150–500 nM (–)-JQ1 or (+)-JQ1 are shown (n = 7, paired t test). (E) PBMCs were isolated from the peripheral blood of patients who exhibited CAR silencing in vivo (left). Cells were subsequently treated with (–)-JQ1 or (+)-JQ1 and analyzed for CAR expression (representative flow cytometric plots, middle). (F) Frequencies of CD3+CAR+ T cells from n = 3 patients were quantified (paired t test).
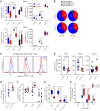
Figure 4
Figure 4. JQ1 reinvigorates dysfunctional CAR T cells from nonresponding patients with CLL.
(A) Spearman’s Rho correlation performed between the frequency of preinfusion CD8+PD-1+CAR+ T cells and the maximum proportion (Cmax) of in vivo expanded CD8+CAR+ T cells. Each dot represents an individual patient (n = 36) differentially colored according to therapeutic response. (B) CD8+CAR+ T cells were treated with 150–500 nM (–)-JQ1 or (+)-JQ1 for 4 days followed by evaluation of PD-1 levels. Flow cytometry histograms of PD-1 expression on CLL patient CAR+CD8+ T cells (left) are shown. PD-1 expression levels (middle) and proportions of CD8+CAR+ T cells after a 4-day incubation with 150 nM (–)-JQ1 or (+)-JQ1 are depicted (n = 11, paired t test). (C) CAR+ T cells were treated with (–)-JQ1 or (+)-JQ1 followed by stimulation with K562CD19 or K562CD19/PD-L1 cells. Functional properties of CAR T cells were then analyzed. (D) Proliferation of CAR T cells restimulated with K562 cells as indicated above (n = 3, paired t test). Arrows indicate stimulation time points. (E) Heatmap of cytokine profiles for CLL patient CAR T cells (n = 3) treated with (–)-JQ1 or (+)-JQ1 and stimulated with irradiated K562CD19 or K562CD19/PD-L1 cells is presented. Colors represent scaled cytokine data.
Figure 5
Figure 5. JQ1 ameliorates suppression of mitochondrial respiration and glycolysis in dysfunctional CD8+ CAR T cells from patients with CLL.
Metabolic flux profiling was performed on purified, dysfunctional CD8+ T cells from CLL patient infusion products after a 4-day treatment with 150 nM (–)-JQ1 (blue) or (+)-JQ1 (red). The metabolic profile of functional CD8+ CAR T cells from CR patients is shown as a control. (A) The extracellular acidification rate (ECAR) and (B) oxygen consumption rate (OCR) were measured at baseline. (C) Longitudinal OCR was quantified during a mitochondrial stress test performed by injection of oligomycin (Oligo), a mitochondrial decoupler (FCCP), followed by electron transport chain inhibitors, antimycin A/rotenone (Ant/Rot). (D) Maximal respiratory capacity (MRC) and (E) spare respiratory capacity (SRC) of CD8+ CAR T cells treated with (–)-JQ1 or (+)-JQ1 were determined after FCCP injection. (AE) n = 12, paired t test. Data are shown as the mean ± SEM. (F) ECAR was also measured over time during the same mitochondrial stress test. Data are shown as the mean ± SEM.
Figure 6
Figure 6. JQ1 treatment improves production of CAR T cells from dysfunctional autologous T cells.
Bulk CD3+ T cells were purified from PBMCs of patients with CLL and stimulated through CD3 and CD28 in the presence of 150 nM (–)-JQ1 or (+)-JQ1. Early (day 5) and late (day 9) harvested CD8+ T cells were evaluated for (A) the frequencies and MFI of inhibitory molecules (PD-1, TIM-3, and LAG-3) and (B) T cell differentiation phenotype. TN, naive-like; TCM, central memory; TEM, effector memory; TEFF, effector. (C) CD3+ T cells were isolated from leukapheresis material from highly relapsed/refractory patients with CLL treated with CD19 CAR T cells. After activation and expansion in the presence of (–)-JQ1 or (+)-JQ1, cells were analyzed for an inhibitory phenotype defined by expression of PD-1, TIM-3, and LAG-3. Representative flow cytometric histograms of inhibitory receptor expression on CD8+ T cells are shown. (D) Summarized inhibitory receptor expression data on (–)-JQ1– or (+)-JQ1–treated and expanded T cells from multiple relapsed/refractory patients with CLL are shown (statistical analyses were performed using paired t tests). After transduction of the above patient T cells with a lentiviral vector encoding an anti-CD19 4-1BBζ CAR and subsequent expansion in the presence of 150 nM (–)-JQ1 or (+)-JQ1, CAR T cells were assessed for (E) CAR expression, (F) activation status, (G) proportions of CAR T cells expressing PD-1 or coexpressing multiple inhibitory receptors, and (H) proliferative potency after repetitive stimulation with irradiated K562CD19 cells (n = 7, paired t tests). Data are shown as the mean ± SEM.
Figure 7
Figure 7. JQ1 treatment of dysfunctional CAR T cells from patients with CLL is associated with a unique transcriptional profile.
(A) Volcano plot showing differentially expressed genes identified through RNA-Seq of relapsed/refractory CLL patient CAR+CD8+ T cells treated with (–)-JQ1 or (+)-JQ1 for 4 days (n = 4). Downregulated genes are colored in blue and upregulated genes are depicted in red. Unadjusted P values are shown. (B) Gene ontology terms associated with genes that were significantly upregulated (red) and downregulated in the above JQ1-treated patient CD8+CAR+ T cells. (C) Representative GSEA results from running the unfiltered CD8+CAR+ T cell (+)-JQ1 versus (–)-JQ1 rank list against the Molecular Signatures Database (MSigDB) gene ontology collections.
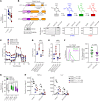
Figure 8
Figure 8. Downregulation of TET2 expression by JQ1 treatment contributes to reinvigoration of CAR T cells from patients with CLL.
(A) TET2 mRNA reduction in CD19 CAR T cells transduced and expanded in the presence of 150 nM (–)-JQ1 or (+)-JQ1 (n = 8; paired t test). (B) Depiction of the organization of the human (h)TET2 catalytic domain and structures of FLAG-tagged TET2-CS and TET2-HxD with highlighted targets for mutagenesis in red (top left panel). Schematic of the sequential oxidations of 5-mC to 5-hmC and to 5-fC and to 5-caC catalyzed by TET2 is shown (top right panel). Immunoblot of TET2 protein levels in HEK293T cells is depicted. HSP90 was used as a loading control (bottom left panel). Dot blots for 5-mC, 5-hmC, and 5-caC in genomic DNA isolated from the above HEK293T cells transfected with an empty vector, TET2-CS, and TET2-HxD are shown (bottom right panel, blots are representative of 3 independent experiments). (C) OCR, (D) SRC, and (E) MRC of expanded CLL patient CAR T cells transduced with vector alone or TET2-CS and subsequently treated with (–)-JQ1 or (+)-JQ1 for 4 days (n = 3–4; paired t test). (F) Levels of PD-1 expression on CLL patient CD8+ CAR+ T cells transduced with TET2-CS or TET2-HxD (representative histograms, left panel; graphical data summary, right panel; n = 7, paired t test). (G) Frequency of CD8+ PD-1+ CLL patient T cells transduced with vector alone or lentiviral vectors encoding TET2-CS and TET2-HxD followed by treatment with (–)-JQ1 or (+)-JQ1 (n = 6–12, 2-tailed t test). Data are shown as the mean ± SEM. (H) Levels of TNF-α and IL-2 elaborated by CD8+CAR+ T cells transduced with vector alone or TET2-CS and subsequently treated with (–)-JQ1 or (+)-JQ1 and stimulated with irradiated K562CD19 or K562CD19/PD-L1 cells (n = 4, paired t test). *P ≤ 0.05, **P ≤ 0.01, NS, not significant.

Similar articles

Cited by

References

    1. Porter DL, et al. Chimeric antigen receptor-modified T cells in chronic lymphoid leukemia. N Engl J Med. 2011;365(8):725–733. doi: 10.1056/NEJMoa1103849. - DOI - PMC - PubMed
    1. Maude SL, et al. Tisagenlecleucel in children and young adults with B-cell lymphoblastic leukemia. N Engl J Med. 2018;378(5):439–448. doi: 10.1056/NEJMoa1709866. - DOI - PMC - PubMed
    1. Park JH, et al. Long-term follow-up of CD19 CAR therapy in acute lymphoblastic leukemia. N Engl J Med. 2018;378(5):449–459. doi: 10.1056/NEJMoa1709919. - DOI - PMC - PubMed
    1. Lee DW, et al. T cells expressing CD19 chimeric antigen receptors for acute lymphoblastic leukaemia in children and young adults: a phase 1 dose-escalation trial. Lancet. 2015;385(9967):517–528. doi: 10.1016/S0140-6736(14)61403-3. - DOI - PMC - PubMed
    1. Porter DL, et al. Chimeric antigen receptor T cells persist and induce sustained remissions in relapsed refractory chronic lymphocytic leukemia. Sci Transl Med. 2015;7(303):303ra139. doi: 10.1126/scitranslmed.aac5415. - DOI - PMC - PubMed

Publication types

MeSH terms