. 2021 Oct;116(4):1044-1063.
doi: 10.1111/mmi.14792. Epub 2021 Aug 30.

Bacteriophage λ RexA and RexB functions assist the transition from lysogeny to lytic growth

Affiliations

Bacteriophage λ RexA and RexB functions assist the transition from lysogeny to lytic growth

Lynn C Thomason et al. Mol Microbiol. 2021 Oct.

Abstract

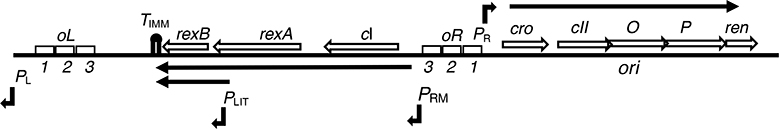
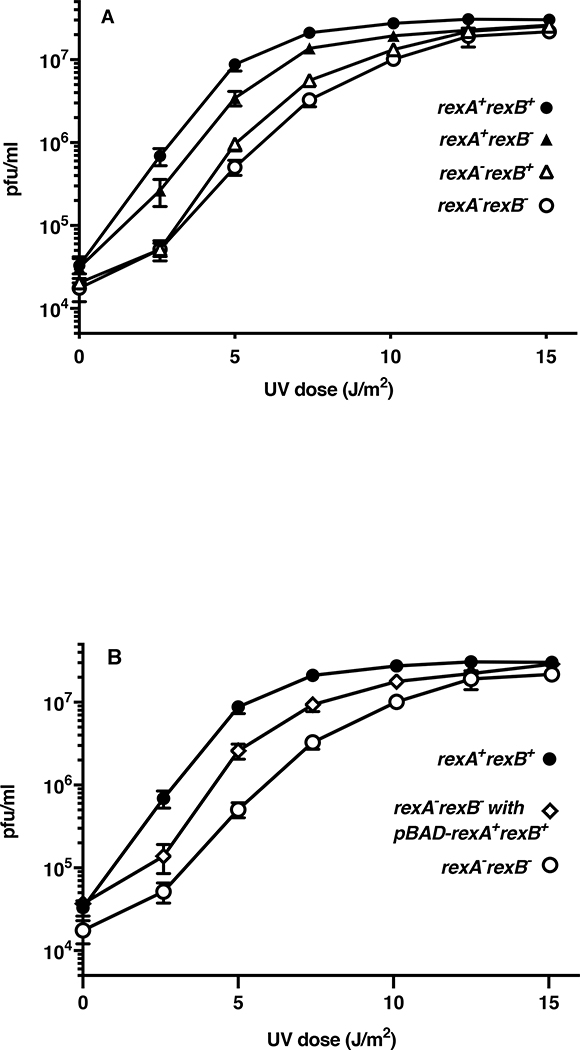
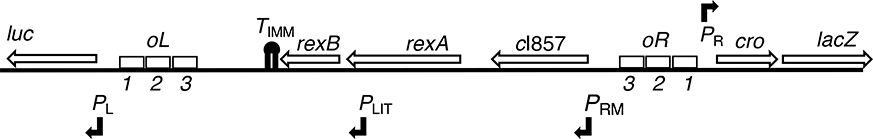
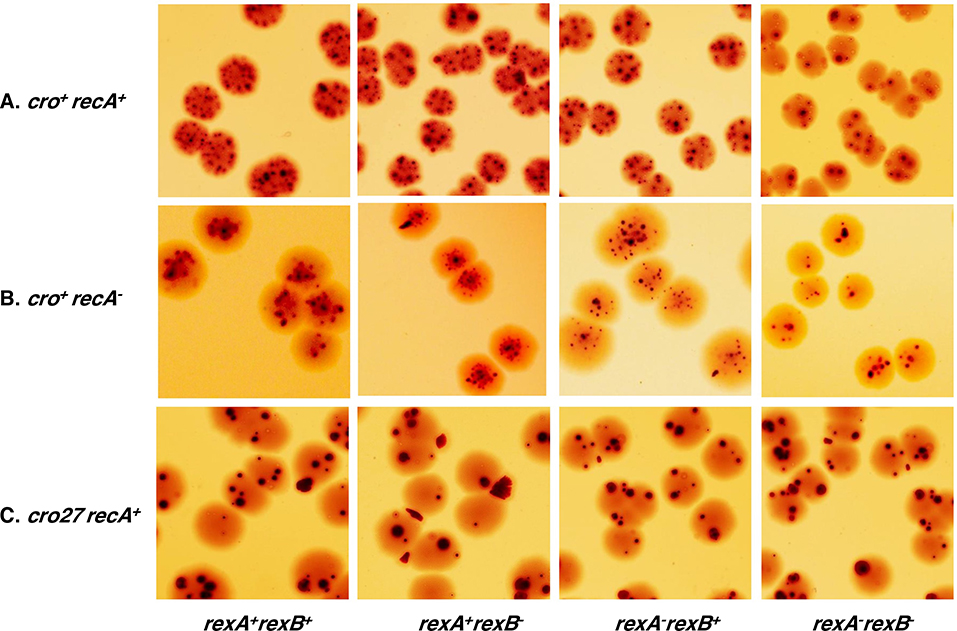
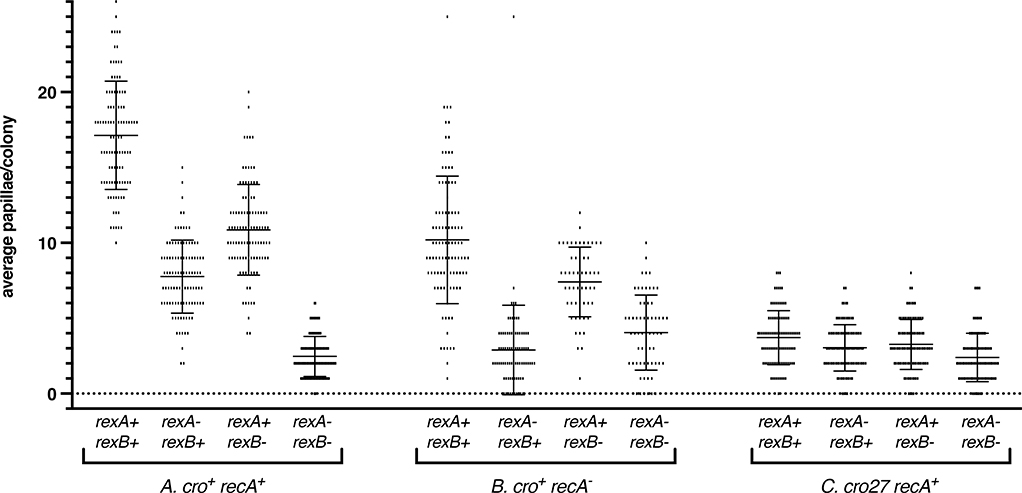
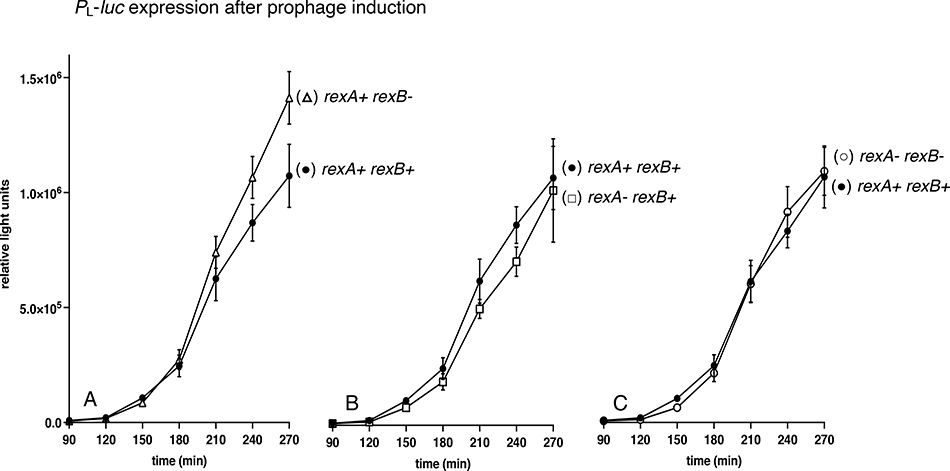
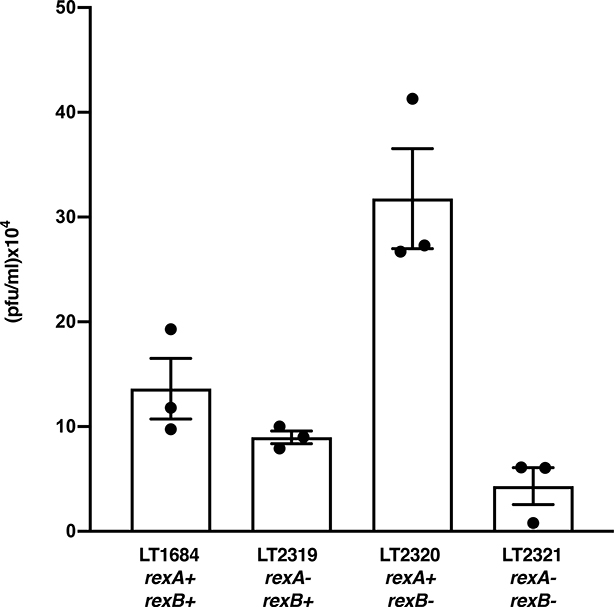
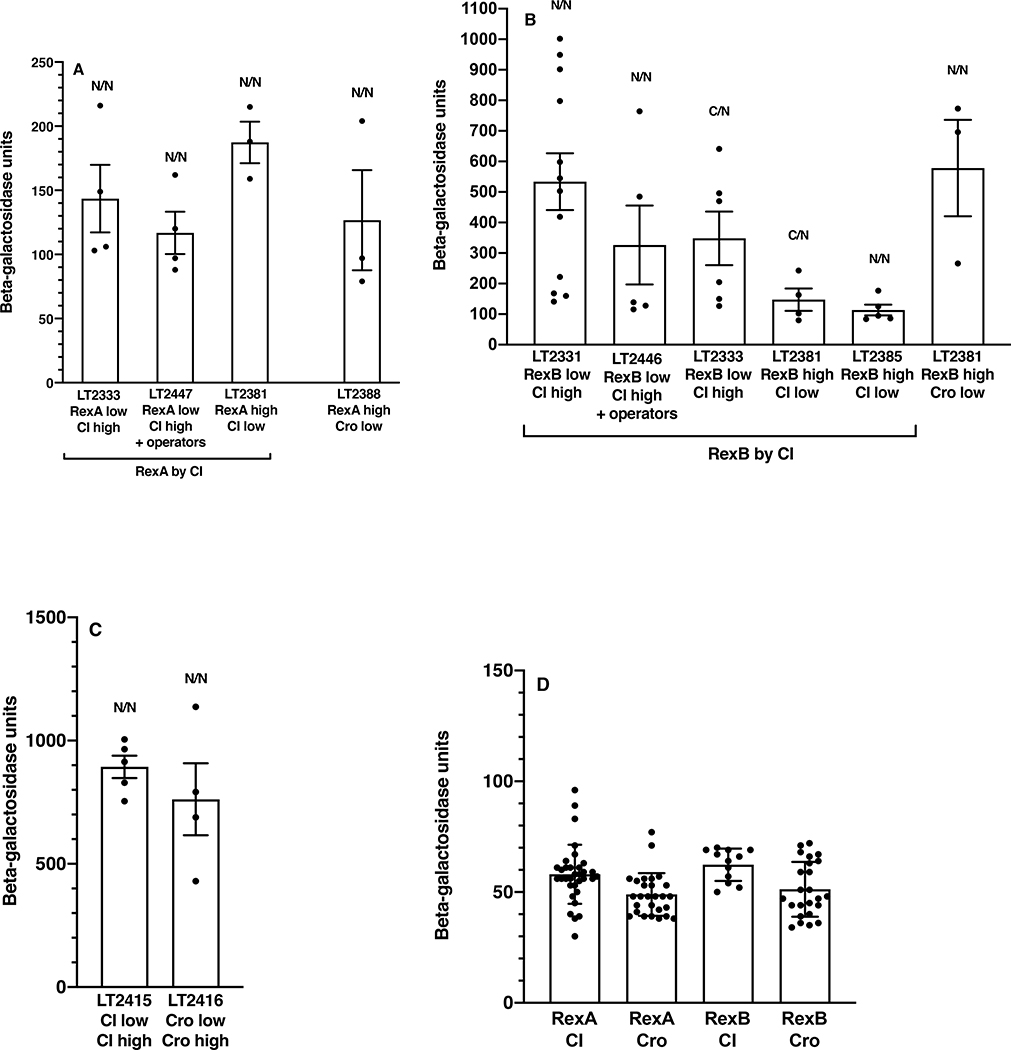
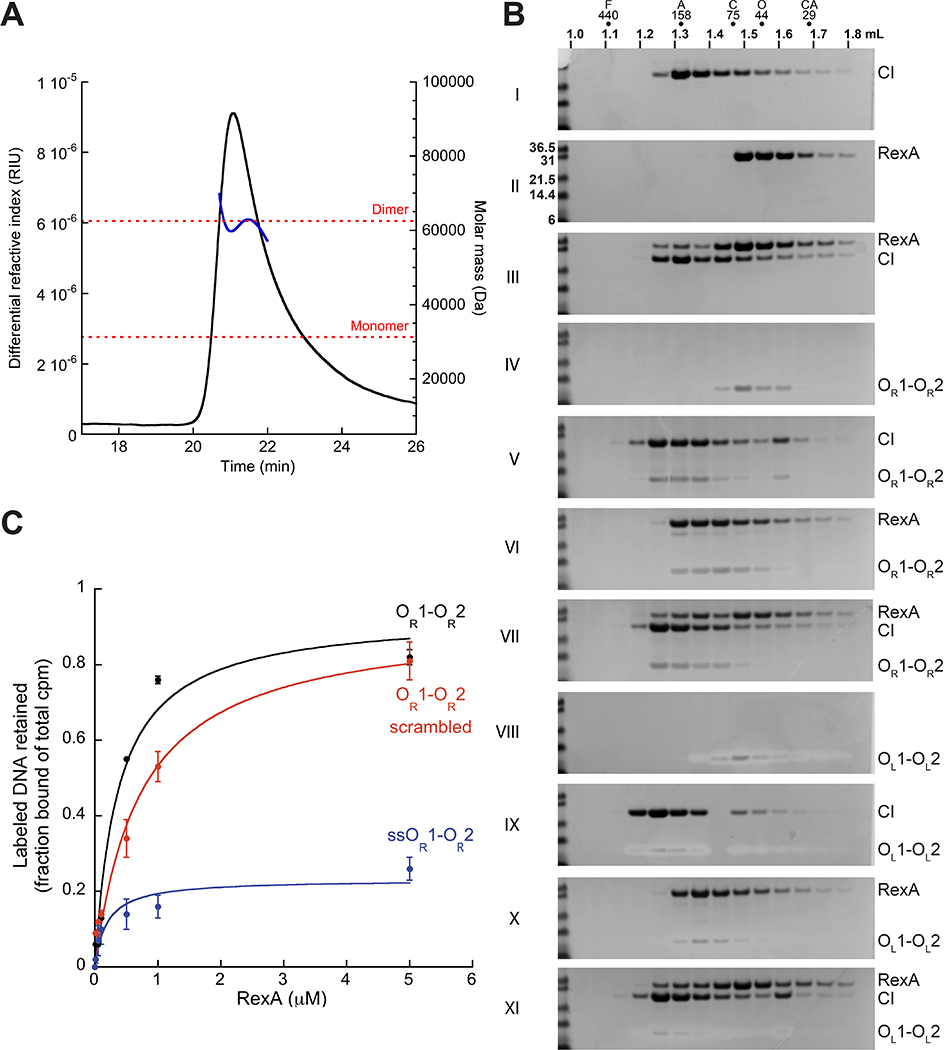
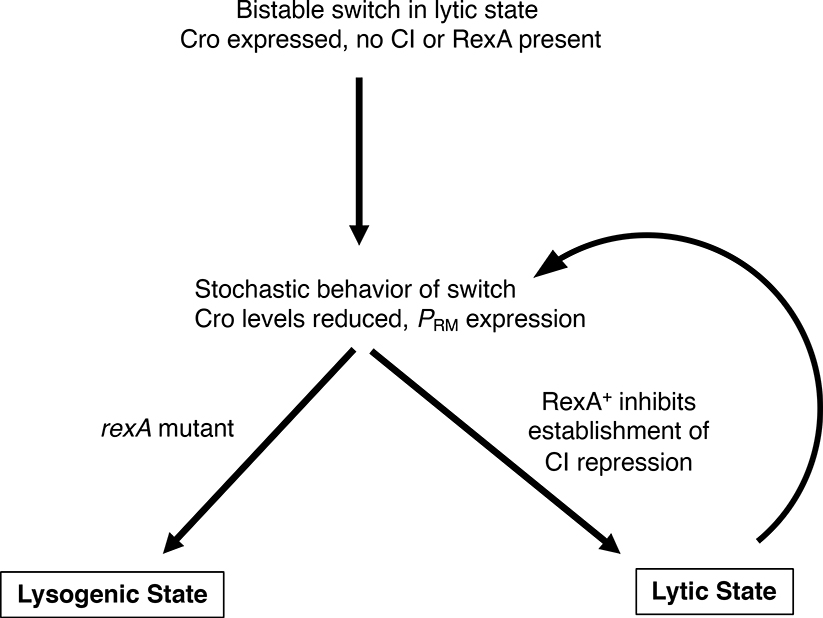
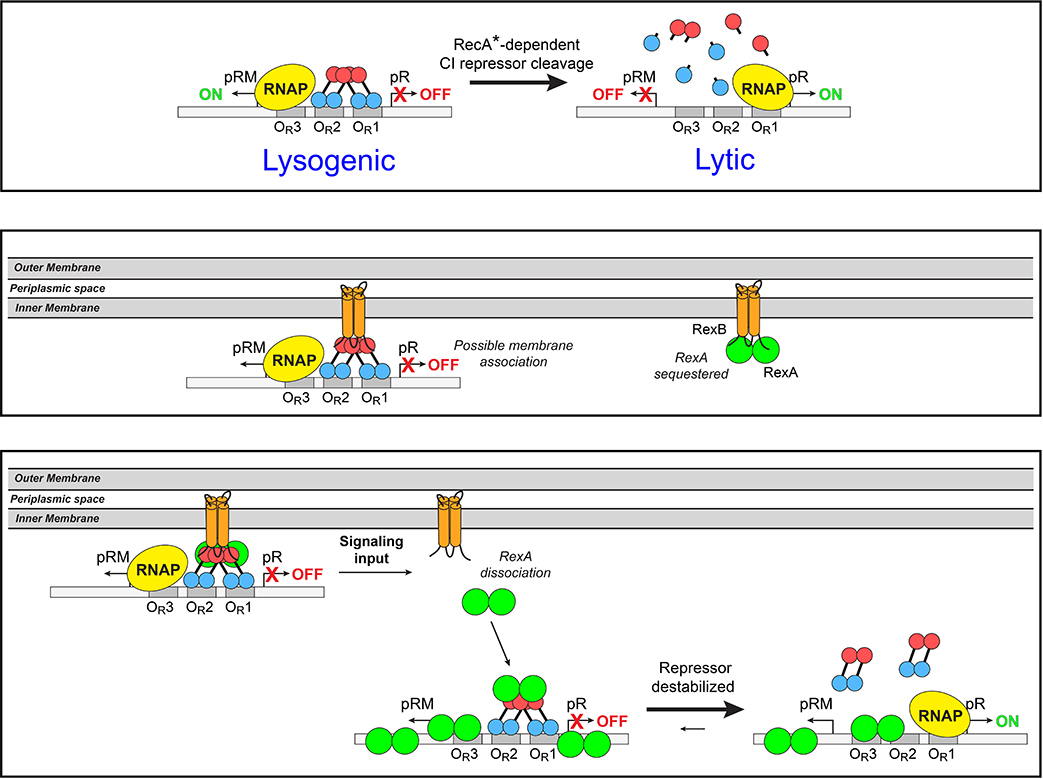
The CI and Cro repressors of bacteriophage λ create a bistable switch between lysogenic and lytic growth. In λ lysogens, CI repressor expressed from the PRM promoter blocks expression of the lytic promoters PL and PR to allow stable maintenance of the lysogenic state. When lysogens are induced, CI repressor is inactivated and Cro repressor is expressed from the lytic PR promoter. Cro repressor blocks PRM transcription and CI repressor synthesis to ensure that the lytic state proceeds. RexA and RexB proteins, like CI, are expressed from the PRM promoter in λ lysogens; RexB is also expressed from a second promoter, PLIT , embedded in rexA. Here we show that RexA binds CI repressor and assists the transition from lysogenic to lytic growth, using both intact lysogens and defective prophages with reporter genes under the control of the lytic PL and PR promoters. Once lytic growth begins, if the bistable switch does return to the immune state, RexA expression lessens the probability that it will remain there, thus stabilizing the lytic state and activation of the lytic PL and PR promoters. RexB modulates the effect of RexA and may also help establish phage DNA replication as lytic growth ensues.

Keywords: bacteriophage λ; genetic switch; lysogeny; lytic growth; phage development; prophage.


Figures

Figure 1.
Figure 1.. Genetic map of λ immunity region and DNA replication genes.
The CI and Cro repressors are expressed in the PRM and PR operons, respectively, and are major players in the lysis-lysogeny decision. These two repressors control expression of the major lytic promoters PL and PR by binding to the left and right tripartite operator sites, OL and OR, with the lytic PR and lysogenic PRM promoters sharing coordinate but opposing regulation within the OR segment. The rexA and rexB genes are downstream of cI. The PLIT promoter is embedded in the terminal coding sequence of rexA, with the consequence that rexB is transcribed from two promoters, PRM and PLIT, while cI and rexA are transcribed only from PRM (Thomason et al 2019). Black arrows represent the beginning of the various promoter transcripts shown. Transcription from PRM and PLIT ends at the transcriptional terminator, TIMM, immediately downstream of rexB. The DNA replication genes O and P are transcribed from PR, as is ren, which is also likely involved in DNA replication.
Figure 2.
Figure 2.. RexA+ enhances UV induction of a λ cI+ prophage at low UV doses.
UV induction of λ lysogens was performed as described in Experimental Procedures. A. LT445 is MG1655(λ cI+ rexA+ rexB+) (●) (n=7); LT1676 is MG1655(λcI+ rexA<>cat rexB+) (Δ) (n=3); LT1677 is MG1655(λcI+ rexA+ rexB<>cat) (▲) (n=6), LT1678 is MG1655(λcI+ (rexA rexB)<>cat) (○) (n=3). Titers of the lysates on strain A584 were determined at t=0 and the time points indicated following UV irradiation. B. LT445 is MG1655(λ) (●); LT1678 is MG1655(λ (rexA rexB)<>cat) (○) (n=3); LT2109 is MG1655(λ (rexA rexB)<>cat)/PBAD-rexA+ rexB+ (⬦) (n=4). The error bars indicate standard error of the mean (s.e.m). The number of trials is indicated by (n).
Figure 3.
Figure 3.. Genetic map of dual PL PR reporter.
The phage λ immunity region has been inserted within the E. coli lac operon such that expression of lacZ is driven from the PR lytic promoter (Svenningsen 2005) with the lacI gene and the lac promoter being replaced by PR. This leaves the lacZ ribosome-binding site and the rest of the lacZYA operon intact. Versions of this reporter with the temperature sensitive cI857 repressor were used to determine the effects of RexA and/or RexB functions on induction and the switch to activate PL and PR promoter transcription. Single colonies were grown on MacConkey Lactose indicator medium. When the switch is in the CI-repressed or immune state, colonies do not express LacZ and are white. When the switch is in the Cro-repressed nonimmune state, lacZ is expressed from PR and the colonies are red. The firefly luciferase gene luc replaces the λ N gene beyond the PL promoter.
Figure 4.
Figure 4.. λ RexA promotes the transition to nonimmune state within individual colonies.
In these pictures, colonies of strains containing the PL and PR reporters with the temperature sensitive cI857 repressor allele were plated on MacConkey Lactose agar and incubated at 32°-34°C. All colonies are white after one day of incubation but develop red papillae after two days, indicative of a transition to the lytic state by cells within the colony and consequent expression of lacZ from PR. The rex genotypes are indicated, and the strain numbers are shown below. A. Top row: the strains (LT1886, LT1887, LT1891, and LT1892) display different papillation levels dependent on the genotype of the rexA and rexB genes. B. Middle row: The recA mutant strains (LT2063, LT2064, LT2065, and LT2066) also display variable papillation based on rex genotype. C. Bottom row: The cro27 mutant strains of λ (LT1055, LT1395, LT1865, and LT1866) all papillate similarly, regardless of rex genotype.
Figure 5.
Figure 5.. Quantitation of red papillae in individual colonies.
The number of papillae in individual colonies was counted for each of the twelve genotypes shown in Figure 4. The data are plotted as scatterplots, with each small vertical line indicating the number of papillae found in a single colony. One hundred colonies were scored for each genotype unless otherwise indicated below. The error bars show the standard deviation (s.d.). A. Cro+ RecA+strains: LT1886, rexA+ rexB+; LT1887, rexA rexB+; LT1891, rexA+ rexB; LT1892, rexA rexB. B. Cro+ ΔRecA strains: LT2063, rexA+ rexB+; LT2064, rexA rexB+ (n=82); LT2065, rexA+ rexB (n=54); LT2066, rexA rexB (n=62). C. cro27 RecA+ strains (LT1055, rexA+ rexB+; LT1395, rexA rexB+; LT1865, rexA+ rexB; and LT1866, rexA rexB.
Figure 6.
Figure 6.. λ RexA function stabilizes the non-immune state.
RecA+ and RecA colonies containing the Cro+ PR reporter pictured in Fig. 3 were analyzed to determine the effect of RexA and RexB on the frequency of returning from the non-immune state to the immune state in the presence of Cro repression. The y-axis indicates the percentage of immune (white) colonies arising during overnight growth of a culture that initially carried a reporter in the non-immune (red) state. The final number of colonies analyzed for each genotype is indicated. The error bars show the standard deviation (s.d.). A. RecA+ strains: LT1886, rexA+ rexB+(n=18); LT1887, rexA rexB+ (n=21); LT1891, rexA+ rexB (n=22); LT1892, rexA rexB (n=20). B. ΔrecA strains: LT2063, rexA+ rexB+ (n=17); LT2064, rexA rexB+ (n=14); LT2065, rexA+ rexB (n=15); LT2066, rexA rexB (n=14).
Figure 7.
Figure 7.. Monitoring λ RexA and RexB effects on luciferase activity from the PL promoter after DNA damage.
After addition of Mitomycin C at 3ng/ml, expression of firefly luciferase from the PL promoter (PL N-luc) was monitored over time in four strains carrying the λ immunity region with different rexA and rexB mutations. The linear y-axis is the same for all three graphs and shows relative light units; the x-axis shows time in minutes. MMC was added at t=0. A. (●) LT1657, rexA+ rexB+ and (Δ) LT1895, rexA+ rexB<>cat. B. (●) LT1657, rexA+ rexB+ and (□) LT1659, rexA<>cat rexB+; C. (●) LT1657, rexA+ rexB+ and (o) LT1897, (rexA rexB)<>cat. The experiment was repeated six times and the s.e.m. is shown.
Figure 8.
Figure 8.. λ RexA and RexB affect the level of spontaneous phage release from λcI857 ind1 lysogens.
The bar graph shows the plaque-forming units (PFU) per ml of spontaneously released phage particles arising during 32°C growth of lysogenic cultures. Strain numbers and rex genotypes for each culture are indicated below the bars. Three independent repetitions of each experiment were performed; error bars represent the standard deviation (s.d.). These data are presented in terms of the rate of spontaneous induction (Zong et al., 2010) in Table S4 of Supporting Materials.
Figure 9.
Figure 9.. β-galactosidase measurements of λ RexA and RexB interactions with CI and Cro repressors in a two-hybrid analysis.
The BACTH system was used to look for evidence of in vivo interaction between the RexA and RexB proteins and the phage repressor proteins, CI and Cro. Since the interactions we measured are of various magnitudes they are plotted in three separate graphs, with different ranges for the y-axes. In each case the y-axis shows units of β-galactosidase and the x-axis shows the pairs of plasmids that, when co-transformed into BTH101, allowed the cyclase mutant strain to grow on minimal maltose. The terms “low” and “high” indicate whether the protein of interest was cloned into a low copy (KanR) plasmid or a high copy (AmpR) plasmid. When necessary, low values arising from poor expression of the fusion proteins were eliminated from the data sets as described in Experimental Procedures. Each experiment was done at least three times, individual measurements are shown, and standard error of the mean (s.e.m.) is indicated. In all cases, the location of the cyclase tag on either the N- or C-terminus of the fusion protein is indicated by the letter N or C above the bar, with the first letter corresponding to the first protein listed underneath the strain numbers below the bar. The β-galactosidase data are also presented in Table 2 and Table S5. Panel A. RexA protein interacts, albeit weakly, with both CI and Cro proteins in vivo. LT2333 and LT2447 have the same pair of plasmids but differ in that LT2447 has a set of phage λ left and right operator sites located on the E. coli chromosome. Panel B. RexB also interacts with both the CI and Cro repressors in the two-hybrid assay. LT2331 and LT2446 have the same plasmid pair but differ in that LT2446 has a set of phage λ operator sites located on the E. coli chromosome. Panel C. The affinities of the CI and Cro repressors, each known to form a dimer, were measured as positive controls. The results in panel C demonstrate that in vivo protein-protein interactions can be detected with this two-hybrid system. Panel D. For each pair of proteins we tested, the level of β-galactosidase was determined for all plasmids pairs that did not confer the ability to grow on minimal maltose on the cya mutant tester strain (see Table S5). The average values used to determine negative control data are presented in Table 2.
Figure 10.
Figure 10.. RexA forms stable complexes with CI and DNA in vitro.
A. SEC-MALS analysis of purified RexA. UV trace (black) and measured mass based on light scattering (blue) are shown. B. SEC analysis of RexA and CI protein-protein and protein-DNA interactions. SDS-PAGE gels (silver-stained for DNA and Coomassie-stained for protein) from individual SEC injections are numbered with Roman numerals and shown to visualize shifts in retention volume off of SEC in response to different conditions. Molecular weight standards in kDa are shown in the first lane of each gel with samples labeled on the right. All samples were run on a Superdex 200 PC 3.2 column (GE). The elution volume across the fractions is marked above along with the relative positions of molecular weight standards (F, ferritin, 440 kDa; A, aldolase, 158 kDa; C, conalbumin, 75 kDa; O, ovalbumin, 44 kDa; CA, carbonic anhydrase, 29 kDa). A leftward shift of the bands indicates formation of a larger molecular weight species and is associated with complex formation. See Experimental Procedures and Table S6 for DNA substrate preparation and oligonucleotide sequences, respectively. C. Filter binding analysis of RexA interactions with different DNA substrates. Substrate nomenclature: OR1-OR2, double-stranded DNA containing wildtype OR1 and OR2 operator sites; ss, single-stranded DNA; scrambled, mutated substrate altering operator site sequences. Binding was performed with wildtype RexA at 30°C for 10 min in a 30 μL reaction mixture containing 14.5 nM unlabeled DNA and 0.5 nM labelled DNA. Samples were filtered through KOH-treated nitrocellulose and binding was assessed by scintillation counting. The data points represent the averages of at least three independent experiments (mean ± standard deviation) and were compared to a negative control to determine fraction bound.
Figure 11.
Figure 11.. Effect of RexA on the transition from the lytic state to the immune state.
When only the phage immunity region is present on the E. coli chromosome (see Figure 3), the bistable switch can be in either the immune or nonimmune state. The purified red colonies used for the experiment of Figure 6 have the switch in the nonimmune state, with the Cro protein expressed from PR repressing PRM, so that cI and rexA are not expressed. Because of stochastic events, switching to the immune state may occur that relieves Cro repression and allows some PRM transcription, resulting in cI and rexA expression. The data of Figure 6 show that in this situation, RexA protein lessens the probability that CI can establish immune repression, and thus RexA stabilizes the lytic state. If rexA is mutant, the switch tends to return to the lysogenic state.
Figure 12.
Figure 12.. Model for involvement of RexA and RexB in the transition to lytic growth.
Top Panel: The divergent PRM and PR promoters and the right operator sites are illustrated. In the lysogenic state, CI dimers are bound cooperatively to OR1 and OR2, repressing PR, and transcription of PRM is activated by CI contacting RNA polymerase. Similar CI dimers bound to OL1 and OL2 repress the PL promoter (not shown in diagram), with long-range DNA looping between the left and right operators mediated by CI repressor molecules. This is the normal state in a λ lysogen. In response to an inducing signal such as DNA damage, RecA protein becomes activated (RecA*) and binds to CI repressor, promoting CI inactivation. This allows transcription from PL and PR and subsequent Cro expression; Cro will bind to OR3 and repress PRM transcription. Middle Panel: Our two-hybrid data suggest protein-protein interactions between CI repressor and the integral membrane protein, RexB. Here, we have shown the CI repressor protein bound to the operator sites while associating with RexB, which we propose enhances repression. However, this postulated membrane association is not the tight membrane tethering of the λ genome observed by Hallick and Echols (1973). Our two-hybrid data also show interaction between RexB and RexA (Thomason et al., 2019). Bottom Panel: It is possible that CI, RexB, and RexA co-localize at the periphery of the inner membrane to form a complex that includes all three proteins. We postulate that CI and RexA can be released from RexB, perhaps in response to an environmental signal or a conformational change in RexB. RexA is then free to interact with CI repressor bound to DNA at the operator sites; RexA may also bind DNA nonspecifically. These protein-protein and protein-DNA interactions may destabilize CI repression and activate the lytic state.
Figure 13.
Figure 13.. Predicted RexB membrane topology and location of charged amino acid residues.
The computer program TMHMM was used to predict the orientation of RexB in the E. coli cytoplasmic membrane. The numbers indicate the locations of amino acid residues, with the first and last residues of each transmembrane spanning domain shown. The negatively charged residue in the third transmembrane domain may serve as a proton sink and play some role in energetics. The relative locations of charged amino acids are also indicated. Created with BioRender.com.

Similar articles

Cited by

References

    1. Arkin A, Ross J, & McAdams HH (1998). Stochastic kinetic analysis of developmental pathway bifurcation in phage lambda-infected Escherichia coli cells. Genetics, 149(4), 1633–1648. - PMC - PubMed
    1. Baek K, Svenningsen S, Eisen H, Sneppen K, & Brown S (2003). Single-cell analysis of λ immunity regulation. J Mol Biol, 334(3), 363–372. - PubMed
    1. Battesti A, & Bouveret E (2012). The bacterial two-hybrid system based on adenylate cyclase reconstitution in Escherichia coli. Methods, 58(4), 325–334. doi:10.1016/j.ymeth.2012.07.018 - DOI - PubMed
    1. Beckett D, Burz DS, Ackers GK, & Sauer RT (1993). Isolation of λ repressor mutants with defects in cooperative operator binding. Biochemistry, 32(35), 9073–9079. doi:10.1021/bi00086a012 - DOI - PubMed
    1. Bednarz M, Halliday JA, Herman C, & Golding I (2014). Revisiting bistability in the lysis/lysogeny circuit of bacteriophage lambda. PLoS One, 9(6), e100876. doi:10.1371/journal.pone.0100876 - DOI - PMC - PubMed

Publication types

MeSH terms