. 2021 Aug 10;12(1):4798.
doi: 10.1038/s41467-021-25081-w.

Conversion of dietary inositol into propionate and acetate by commensal Anaerostipes associates with host health

Affiliations

Conversion of dietary inositol into propionate and acetate by commensal Anaerostipes associates with host health

Thi Phuong Nam Bui et al. Nat Commun. .

Abstract

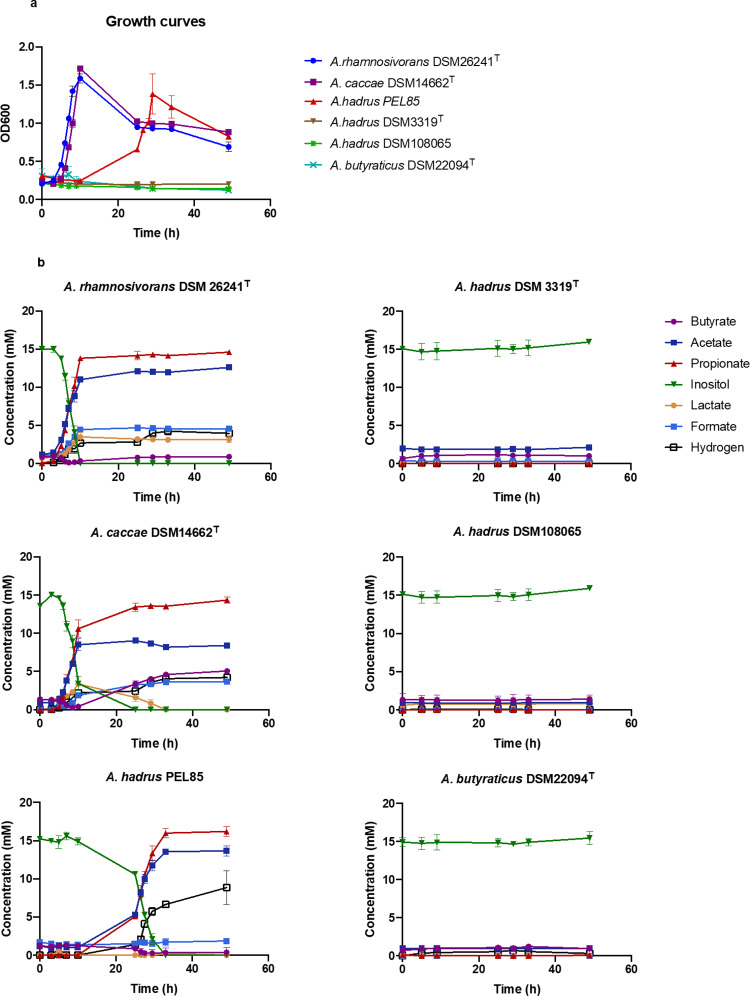
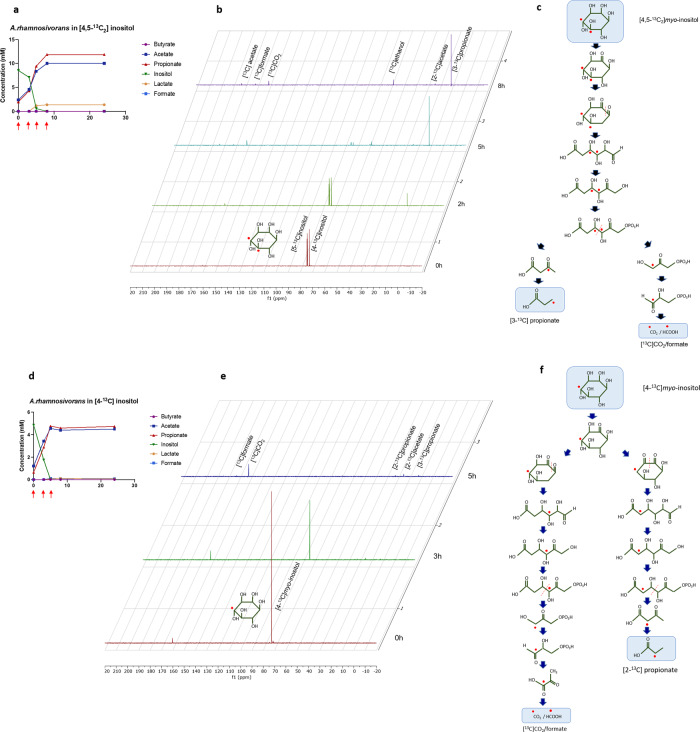
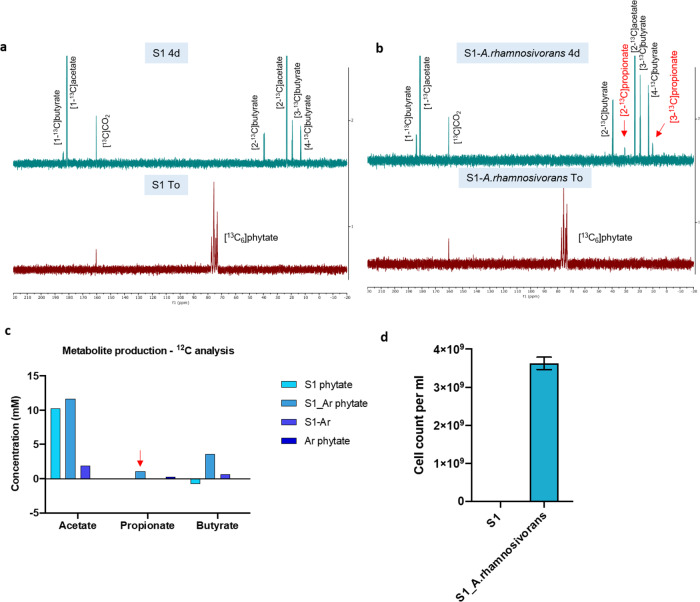
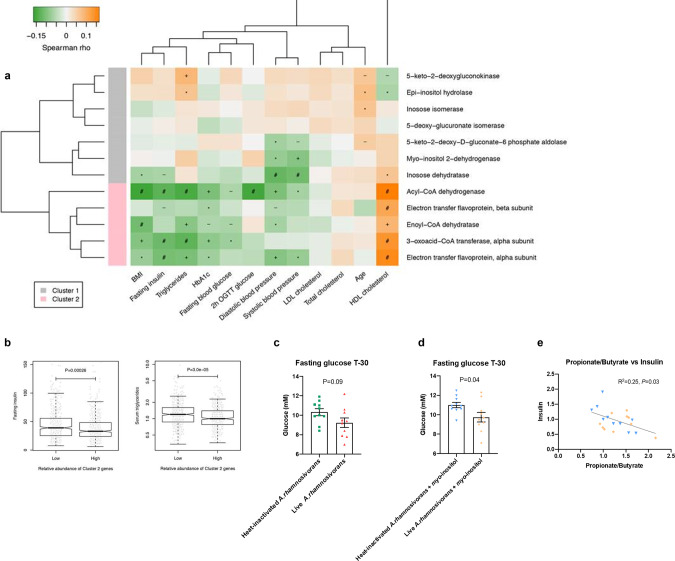
We describe the anaerobic conversion of inositol stereoisomers to propionate and acetate by the abundant intestinal genus Anaerostipes. A inositol pathway was elucidated by nuclear magnetic resonance using [13C]-inositols, mass spectrometry and proteogenomic analyses in A. rhamnosivorans, identifying 3-oxoacid CoA transferase as a key enzyme involved in both 3-oxopropionyl-CoA and propionate formation. This pathway also allowed conversion of phytate-derived inositol into propionate as shown with [13C]-phytate in fecal samples amended with A. rhamnosivorans. Metabolic and (meta)genomic analyses explained the adaptation of Anaerostipes spp. to inositol-containing substrates and identified a propionate-production gene cluster to be inversely associated with metabolic biomarkers in (pre)diabetes cohorts. Co-administration of myo-inositol with live A. rhamnosivorans in western-diet fed mice reduced fasting-glucose levels comparing to heat-killed A. rhamnosivorans after 6-weeks treatment. Altogether, these data suggest a potential beneficial role for intestinal Anaerostipes spp. in promoting host health.


Conflict of interest statement

The Wageningen University has applied for a patent relating to the use of bacteria capable of converting inositol into propionate on which T.P.N.B. and W.M.dV. are inventors (Wageningen; WO2021028585). Other authors declare no competing interests.

Figures

Fig. 1
Fig. 1. Metabolite production from myo-inositol by Anaerostipes strains.
The growth was performed in bicarbonate-buffered medium supplemented up to 15 mM myo-inositol as substrate. a Growth curves (n = 3 biological replicates); b Metabolite production and substrate consumption by 6 Anaerostipes strains (n = 3 biological replicates). Data are presented as mean values ±SD.
Fig. 2
Fig. 2. Elucidation of myo-inositol pathway via 13C-NMR analysis.
High-resolution 13C-NMR spectra showing [4,513C2]myo-inositol fermentation products that are [3-13C]propionate, [13C]CO2, [1-13C]ethanol, [2-13C]acetate, [1-13C]acetate, [13C]formate (b) with anticipated scheme of 13C flow (c), and [4-13C]myo-inositol fermentation products that are [13C]CO2, [13C]formate, [2-13C]propionate, [2-13C]acetate and [3-13C]propionate (e) with anticipated scheme of 13C flow (f). a and d show concentrations of substrate and end metabolites analysed using high performance liquid chromatography-refractive index detection (HPLC-RI) when the cells were grown in [4,513C2]myo-inositol and [4-13C]myo-inositol respectively. Red arrows indicate the samples time points for 13C-NMR.
Fig. 3
Fig. 3. Postulated myo-inositol metabolic pathway via proteogenomic analysis.
a Differential protein abundance in myo-inositol and rhamnose. The T-test result shows that proteins are considered to be significantly (orange dots) different between the two conditions when there is a difference of a factor 10 or larger between the Inositol and Rhamnose condition (that is Log10 Protein abundance ratio (Inositol/Rhamnose) below −1 or above 1) and a p-value below 0.002 (−Log10 p-value > 2.7). Contaminants (human keratins and bovine trypsin), shown as grey dots, show poor p-values as expected since they should not be significantly different (-Log10 p-values below 1.4 = p > 0.04). Other proteins identified and quantified do not show a significantly different abundance (blue circles) between the Inositol and Rhamnose condition. b myo-inositol metabolic pathway. The locus tag and fold induction of the proteins (bold) based on the proteomic data are indicated for each reaction. Myo-inositol is first metabolised via a step-wise reaction by myo-inositol dehydrogenase (IolG encoded by AR1Y2_0317), inosose dehydratase (IolE encoded by AR1Y2_0345), epi-inositol hydrolase (IolD encoded by AR1Y2_1105), 5-deoxy-glucuronate isomerase (IolB encoded byAR1Y2_1106) and 5-keto-2-deoxygluconokinase (IolC encoded by AR1Y2_1104) before being cleaved off to glycerone phosphate and 3-oxopropionate by 5-keto-2-deoxy-d-gluconate-6 phosphate aldolase (IolJ encoded by AR1Y2_1054). While glycerone phosphate is further converted to pyruvate via glycolysis, 3-oxopropionate enters a reduction branch involved newly identified enzymes including a 3-oxoacid CoA transferase (OxcT encoded by AR1Y2_1115), an enoyl-CoA dehydratase (AcaD encoded by AR1Y2_1116) and an acyl dehydrogenase (EcdH encoded by AR1Y2_1117) and acyl dehydrogenase complex (AcaD-Etf encoded by AR1Y2_1050-1052). CO2/H2 or formate is also formed from a conversion of pyruvate to acetyl-CoA involved pyruvate-flavodoxin oxidoreductase (Por encoded by AR1Y2_3042). Genes involved in a production of side products (lactate and ethanol) are also indicated in the graph. c Homologues of myo-inositol pathway gene candidates in genomes of Anaerostipes isolates. The similarity of each pathway gene to this of A. rhamnosivorans is indicated via colour code from yellow to blue ranging from low to high. The genes and locus tags of the myo-inositol pathway genes in the genome of A. rhamnosivorans are shown on the right of the figure.
Fig. 4
Fig. 4. Identification of propionyl coA transferase in A. rhamnosivorans.
Phylogeny of CoA transferase family (a) and CoA transferase activity (bf). a Phylogenetic tree of predicted CoA transferases from A rhamnosivorans DSM26241T (bold) and other anaerobes. The tree was constructed using sequences from butyryl-CoA:acetate CoA transferase (But, in blue), butyryl-CoA:4-hydroxybutyrate CoA transferase (4Hbt, in green), butyryl-CoA:acetoacetate CoA transferase (Ato) alpha subunit (AtoD, in orange), beta subunit (AtoA, in yellow) and oxoacid CoA transferase (OxcT, in light blue), respectively. b Growth curves of A. rhamnosivorans on myo-inositol and rhamnose of which cells at 2 time points were harvested for crude extracts and enzyme assays. c Butyrate and propionate production from rhamnose and myo-inositol condition at T1 and T2 (n = 2 technical replicates). Data are presented as mean values ±SD. d Ratios between activities on propionyl-CoA out of butyryl-CoA in all anaerobic cell-free extracts with blue and purple column for crude extracts from myo-inositol and rhamnose respectively. CoA transferase activities for butyryl-CoA and propionyl-CoA in anaerobic cell-free cell extracts were determined and subsequently used for ratio calculation. Each measurement was performed in triplicate (n = 3 technical replicates). Data are presented as mean values ±SD. Cell free extract of Intestinimonas butyriciproducens AF211 grown on lysine was used as a negative control (NC). As strain AF211 did not show any activities toward either butyryl-CoA or propionyl-CoA, the ratio result of this strain was omitted from the graph to avoid confusion. e Growth curve of A. rhamnosivorans in myo-inositol (n = 2 biological replicates). Red arrows show sampling points (T1–T5) of which enzyme extracts were obtained for the assay. Data are presented as mean values ±SD. f Increases in enzyme activities toward propionyl-CoA during exponential phase correspond to an increase in propionate production and inositol consumption. Data of CoA activity are presented as mean values of biological duplicates (n = 2) and technical triplicates (n = 3) while values shown for inositol and propionate concentration are means of biological duplicates (n = 2). Data are presented as mean values ±SD.
Fig. 5
Fig. 5. [13C6]-labelled phytate degradation by human microbiota in presence or absence of A. rhamnosivorans.
a13C compounds detected by NMR at To or 4 day incubation in phytate enrichment using faecal microbiota. b13C compounds detected by NMR at To or 4 day incubation in phytate enrichment using faecal microbiota and A. rhamnosivorans. c Quantity of metabolite production analysed by high performance liquid chromatography - refractive index detection (HPLC-RI). d A. rhamnosivorans qPCR-based cell counts at initial time points of S1 and S1 plus A. rhamnosivorans enrichments. Mean values of technical triplicates are shown with ±SD.
Fig. 6
Fig. 6. Propionate production gene cluster negatively associates with metabolic risk markers in prediabetes/diabetes cohort and reduced fasting glucose in mice fed with live A. rhamnosivorans.
Metagenomic analysis (a) shows that inositol utilisation gene cluster (cluster 1) did not form significant correlation with metabolic biomarkers while propionate production gene cluster (cluster 2) was significantly negatively associated with metabolic risk markers, especially fasting insulin and serum triglyceride (Spearman correlation); (b) shows significant differences in levels of fasting insulin (P = 2.6e-04) and serum triglyceride (= 3.0e-05) in individuals with low versus high abundances of cluster 2 genes in a Swedish prediabetes cohort (Wilcox rank-sum test). −P < 0.1; *P < 0.05; +P < 0.01; #P < 0.001. The horizontal line in each box represents the median, the top and bottom of the box the 25th and 75th percentiles, and the whiskers 1.5 times the interquartile range. Fasting glucose levels in western diet fed C57BL/6J mice after 6 weeks oral administration of heat-killed or live A. rhamnosivorans without (c) or with myo-inositol (d). N = 10 mice per group. Data are mean ± SEM; statistical analysis was done by unpaired two-tailed Student’s t tests. Pearson correlation (e) between caecal propionate:butyrate ratio and fasting insulin in mice treated with heat-killed (blue circles) or live (orange circles) A. rhamnosivorans plus myo-inositol (P = 0.03).

Similar articles

Cited by

References

    1. The Human Microbiome Project Consortium. Structure, function and diversity of the healthy human microbiome. Nature. 2012;486:207–214. doi: 10.1038/nature11234. - DOI - PMC - PubMed
    1. Guarner F, Malagelada J-R. Gut flora in health and disease. Lancet. 2003;361:512–519. doi: 10.1016/S0140-6736(03)12489-0. - DOI - PubMed
    1. Schroeder BO, Bäckhed F. Signals from the gut microbiota to distant organs in physiology and disease. Nat. Med. 2016;22:1079–1089. doi: 10.1038/nm.4185. - DOI - PubMed
    1. Medzhitov R. Recognition of microorganisms and activation of the immune response. Nature. 2007;449:819–826. doi: 10.1038/nature06246. - DOI - PubMed
    1. Hernández MAG, Canfora EE, Jocken JWE, Blaak EE. The short-chain fatty acid acetate in body weight control and insulin sensitivity. Nutrients. 2019;11:1943. doi: 10.3390/nu11081943. - DOI - PMC - PubMed

Publication types