

LncRNA DUXAP10 Upregulation and the Hedgehog Pathway Activation Are Critically Involved in Chronic Cadmium Exposure-Induced Cancer Stem Cell-Like Property
- PMID: 34373904
- PMCID: PMC8677432
- DOI: 10.1093/toxsci/kfab099
LncRNA DUXAP10 Upregulation and the Hedgehog Pathway Activation Are Critically Involved in Chronic Cadmium Exposure-Induced Cancer Stem Cell-Like Property
Abstract
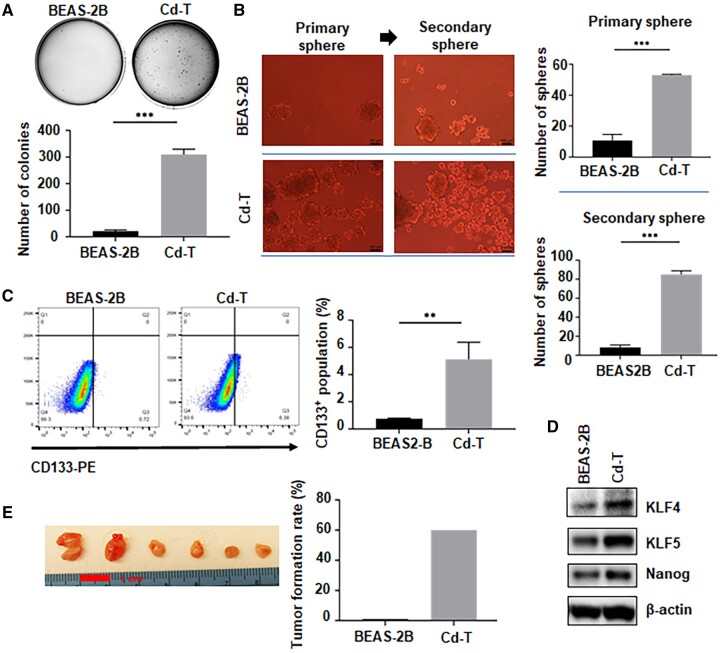
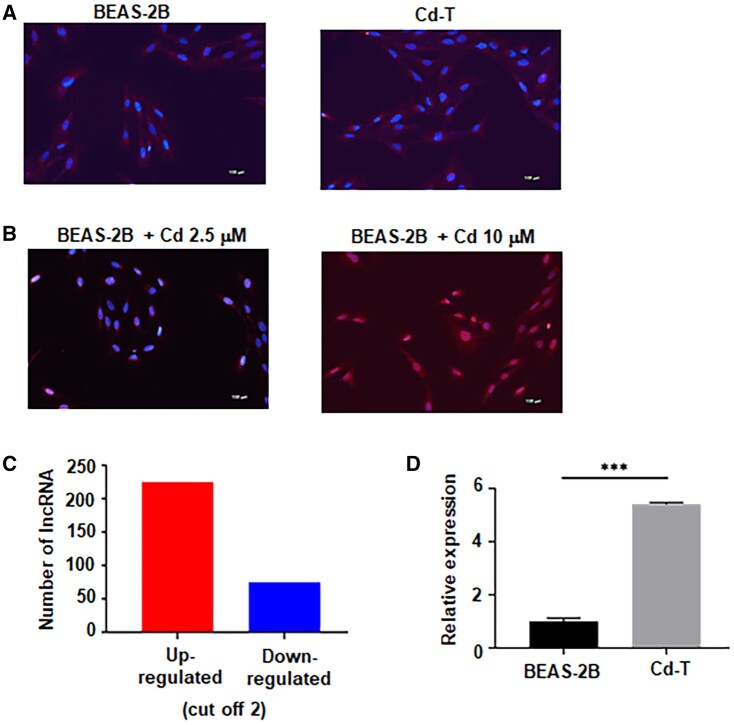
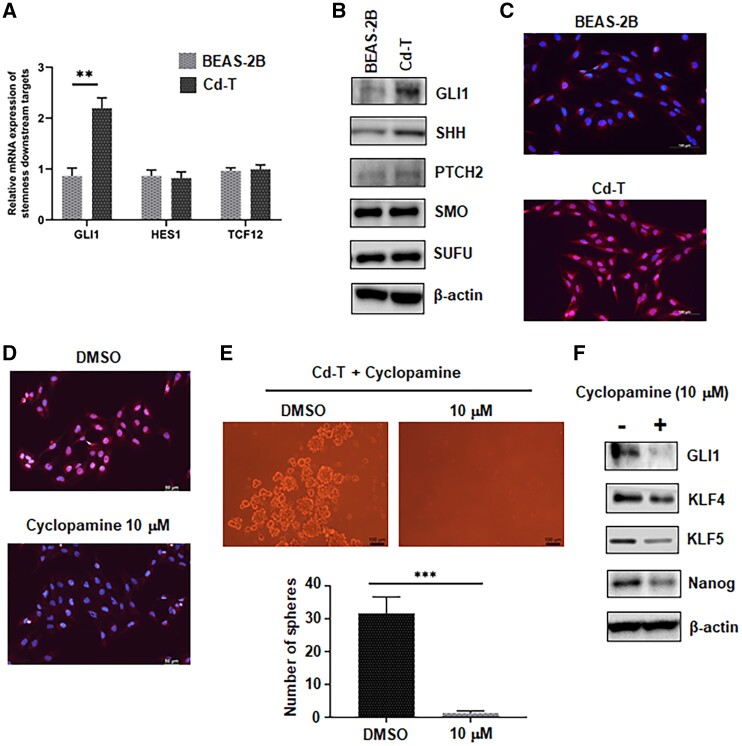
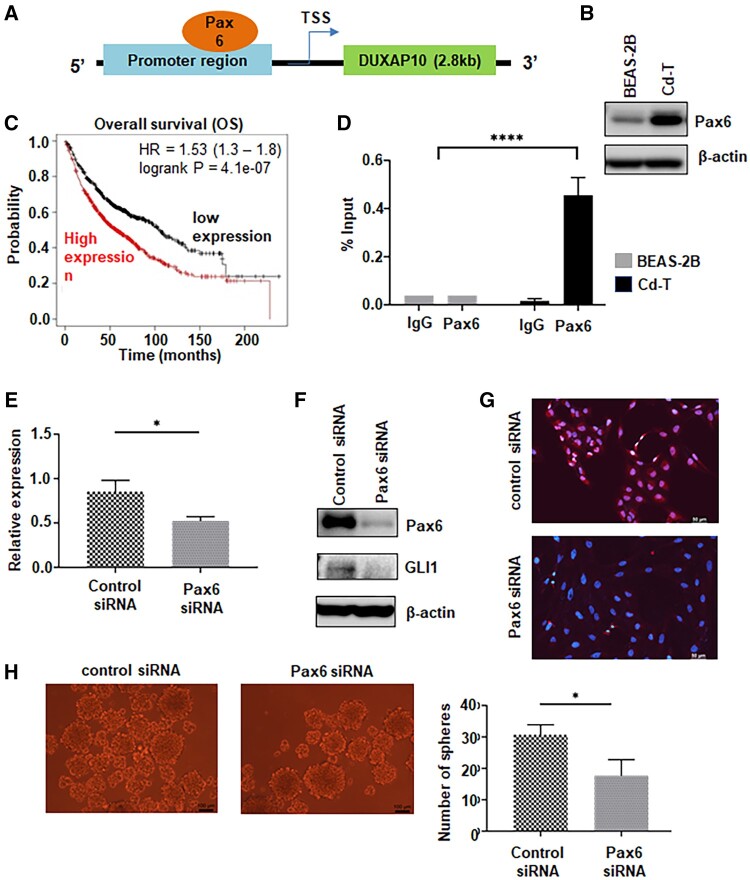
Cadmium (Cd) is a well-known lung carcinogen. However, the mechanism of Cd carcinogenesis remains to be clearly defined. Cd has been shown to act as a weak mutagen, suggesting that it may exert tumorigenic effect through nongenotoxic ways, such as epigenetic mechanisms. Long noncoding RNAs (lncRNAs) refer to RNA molecules that are longer than 200 nucleotides in length but lack protein-coding capacities. Regulation of gene expressions by lncRNAs is considered as one of important epigenetic mechanisms. The goal of this study is to investigate the mechanism of Cd carcinogenesis focusing on the role of lncRNA dysregulations. Cd-induced malignant transformation of human bronchial epithelia BEAS-2B cells was accomplished by a 9-month low-dose Cd (CdCl2, 2.5 µM) exposure. The Cd-exposed cells formed significantly more colonies in soft agar, displayed cancer stem cell (CSC)-like property, and formed tumors in nude mice. Mechanistically, chronic low-dose Cd exposure did not cause significant genotoxic effects but dysregulated lncRNA expressions. Further Q-PCR analysis confirmed the significant upregulation of the oncogenic lncRNA DUXAP10 in Cd-transformed cells. DUXAP10 knockdown in Cd-transformed cells significantly reduced their CSC-like property. Further mechanistic studies showed that the Hedgehog pathway is activated in Cd-transformed cells and inhibition of this pathway reduces Cd-induced CSC-like property. DUXAP10 knockdown caused the Hedgehog pathway inactivation in Cd-transformed cells. Furthermore, Pax6 expression was upregulated in Cd-transformed cells and Pax6 knockdown significantly reduced their DUXAP10 levels and CSC-like property. In summary, these findings suggest that the lncRNA DUXAP10 upregulation may play an important role in Cd carcinogenesis.
Keywords: DUXAP10; Hedgehog pathway; Pax6; cadmium; cancer stem cell-like property; long noncoding RNA.
© The Author(s) 2021. Published by Oxford University Press on behalf of the Society of Toxicology. All rights reserved. For permissions, please e-mail: journals.permissions@oup.com.
Figures


Similar articles
-
Down-regulation of lncRNA MEG3 promotes chronic low dose cadmium exposure-induced cell transformation and cancer stem cell-like property.Toxicol Appl Pharmacol. 2021 Nov 1;430:115724. doi: 10.1016/j.taap.2021.115724. Epub 2021 Sep 11. Toxicol Appl Pharmacol. 2021. PMID: 34520792 Free PMC article.
-
Upregulation of histone-lysine methyltransferases plays a causal role in hexavalent chromium-induced cancer stem cell-like property and cell transformation.Toxicol Appl Pharmacol. 2018 Mar 1;342:22-30. doi: 10.1016/j.taap.2018.01.022. Epub 2018 Jan 31. Toxicol Appl Pharmacol. 2018. PMID: 29391238 Free PMC article.
-
LncRNA-Hh Strengthen Cancer Stem Cells Generation in Twist-Positive Breast Cancer via Activation of Hedgehog Signaling Pathway.Stem Cells. 2016 Jan;34(1):55-66. doi: 10.1002/stem.2219. Epub 2015 Nov 17. Stem Cells. 2016. PMID: 26418365 Free PMC article.
-
Metal carcinogen exposure induces cancer stem cell-like property through epigenetic reprograming: A novel mechanism of metal carcinogenesis.Semin Cancer Biol. 2019 Aug;57:95-104. doi: 10.1016/j.semcancer.2019.01.002. Epub 2019 Jan 11. Semin Cancer Biol. 2019. PMID: 30641125 Free PMC article. Review.
-
Dysregulations of long non-coding RNAs - The emerging "lnc" in environmental carcinogenesis.Semin Cancer Biol. 2021 Nov;76:163-172. doi: 10.1016/j.semcancer.2021.03.029. Epub 2021 Apr 3. Semin Cancer Biol. 2021. PMID: 33823237 Free PMC article. Review.
Cited by
-
Mechanisms of Heavy Metal Cadmium (Cd)-Induced Malignancy.Biol Trace Elem Res. 2025 Feb;203(2):608-623. doi: 10.1007/s12011-024-04189-2. Epub 2024 Apr 29. Biol Trace Elem Res. 2025. PMID: 38683269 Review.
-
Non-coding RNAs and exosomal non-coding RNAs in lung cancer: insights into their functions.Front Cell Dev Biol. 2024 May 27;12:1397788. doi: 10.3389/fcell.2024.1397788. eCollection 2024. Front Cell Dev Biol. 2024. PMID: 38859962 Free PMC article. Review.
-
Identification of Candidate lncRNA and Pseudogene Biomarkers Associated with Carbon-Nanotube-Induced Malignant Transformation of Lung Cells and Prediction of Potential Preventive Drugs.Int J Environ Res Public Health. 2022 Mar 2;19(5):2936. doi: 10.3390/ijerph19052936. Int J Environ Res Public Health. 2022. PMID: 35270630 Free PMC article.
-
The LncRNA DUXAP10 Could Function as a Promising Oncogene in Human Cancer.Front Cell Dev Biol. 2022 Feb 3;10:832388. doi: 10.3389/fcell.2022.832388. eCollection 2022. Front Cell Dev Biol. 2022. PMID: 35186937 Free PMC article. Review.
-
The crosstalk between long non-coding RNAs and the hedgehog signaling pathway in cancer.Med Oncol. 2022 Jun 18;39(9):127. doi: 10.1007/s12032-022-01710-2. Med Oncol. 2022. PMID: 35716241 Review.
References
-
- Achanzar W. E., Diwan B. A., Liu J., Quader S. T., Webber M. M., Waalkes M. P. (2001). Cadmium-induced malignant transformation of human prostate epithelial cells. Cancer Res. 61, 455–458. - PubMed
-
- Akerstrom M., Barregard L., Lundh T., Sallsten G. (2013). The relationship between cadmium in kidney and cadmium in urine and blood in an environmentally exposed population. Toxicol. Appl. Pharmacol. 268, 286–293. - PubMed
-
- Alama A., Gangemi R., Ferrini S., Barisione G., Orengo A. M., Truini M., Bello M. G., Grossi F. (2015). CD133-positive cells from non-small cell lung cancer show distinct sensitivity to cisplatin and afatinib. Arch. Immunol. Ther. Exp. 63, 207–214. - PubMed
-
- Ali I., Damdimopoulou P., Stenius U., Halldin K. (2015). Cadmium at nanomolar concentrations activates Raf-MEK-ERK1/2 MAPKs signaling via EGFR in human cancer cell line. Chem. Biol. Interact. 231, 44–52. - PubMed
Publication types
MeSH terms
Substances
Grants and funding
LinkOut - more resources
Full Text Sources
